. 2023 Dec 1;146(12):5168-5181.
doi: 10.1093/brain/awad259.

Identifying sources of human interictal discharges with travelling wave and white matter propagation

Affiliations

Identifying sources of human interictal discharges with travelling wave and white matter propagation

C Price Withers et al. Brain. .

Abstract

Interictal epileptiform discharges have been shown to propagate from focal epileptogenic sources as travelling waves or through more rapid white matter conduction. We hypothesize that both modes of propagation are necessary to explain interictal discharge timing delays. We propose a method that, for the first time, incorporates both propagation modes to identify unique potential sources of interictal activity. We retrospectively analysed 38 focal epilepsy patients who underwent intracranial EEG recordings and diffusion-weighted imaging for epilepsy surgery evaluation. Interictal discharges were detected and localized to the most likely source based on relative delays in time of arrival across electrodes, incorporating travelling waves and white matter propagation. We assessed the influence of white matter propagation on distance of spread, timing and clinical interpretation of interictal activity. To evaluate accuracy, we compared our source localization results to earliest spiking regions to predict seizure outcomes. White matter propagation helps to explain the timing delays observed in interictal discharge sequences, underlying rapid and distant propagation. Sources identified based on differences in time of receipt of interictal discharges are often distinct from the leading electrode location. Receipt of activity propagating rapidly via white matter can occur earlier than more local activity propagating via slower cortical travelling waves. In our cohort, our source localization approach was more accurate in predicting seizure outcomes than the leading electrode location. Inclusion of white matter in addition to travelling wave propagation in our model of discharge spread did not improve overall accuracy but allowed for identification of unique and at times distant potential sources of activity, particularly in patients with persistent postoperative seizures. Since distant white matter propagation can occur more rapidly than local travelling wave propagation, combined modes of propagation within an interictal discharge sequence can decouple the commonly assumed relationship between spike timing and distance from the source. Our findings thus highlight the clinical importance of recognizing the presence of dual modes of propagation during interictal discharges, as this may be a cause of clinical mislocalization.

Keywords: epilepsy; iEEG; interictal epileptiform discharges; source localization; white matter.


Conflict of interest statement

The authors report no competing interests.

Figures
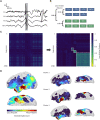
Figure 1
Figure 1
IED spike sequence detection and clustering. (A) Detection of an interictal epileptiform discharge (IED) sequence in TT1, TT2, TT3 and PST1 electrodes. Shaded (grey) region represents a 100 ms detection window. TT = temporal tip; PST = posterior subtemporal. (B) Four sample IED sequences with Jaro-Winkler distance calculations. The first sequence is the same IED represented in A. Similar sequences are grouped together through clustering. TG = temporal grid. (C) HDBSCAN clustering of sequences for Subject p39. Left panel shows sequences before clustering and right panel shows emergence of three distinct IED clusters with high intra-similarity and low inter-similarity after clustering. (D) Visualization of Subject p39 spike clustering. Unclustered spiking is displayed on left; clustered spiking is displayed on right. Cluster 1 corresponds to the first two sequences in B and Cluster 2 corresponds to the third and fourth sequences in B.
Figure 2
Figure 2
White matter can be necessary to explain IED spike latencies. (A) Lag times between the most frequent leading electrode (RAD17) and three most common followers (RAD18, RAD23 and RPST2) in Cluster 1 of Subject p80. Because RAD17 does not always lead the sequence, there are some instances when lag time is negative. Top (green) and bottom (blue) shaded boxes represent the expected latencies between RAD17 and its three primary follower electrodes, under the assumption of direct propagation from the leading parcel (red) to each follower. Grey matter (GM) and white matter (WM) ranges of estimated lag times are calculated from the min and max distance between electrodes and estimated conduction velocities. The y-axis ranges from −100 to 100 ms based on the IED sequence detection window of 100 ms. There is no white matter connection present between RAD17-RAD18 and RAD17-RAD23 and the estimated grey matter lag range for RAD17-RAD23 exceeds 100 ms. RAD = right amygdala depth; RPST = right posterior subtemporal. (B) Estimated lag times assuming propagation from the grey matter source parcel (red, located primarily within a sulcus, see Supplementary Fig. 4 for inflated brain view). The unfilled box for grey matter propagation to RAD23 indicates that this range exceeds the maximum distance threshold of 45 mm. Latencies between RAD17-RAD23 are unexplained by travelling waves only. (C) Estimated lag times assuming propagation from the white matter source. There is no white matter connection between the source and RAD23, so the lag times are unexplained by white matter propagation only. (D) Estimated lag times assuming grey or white matter propagation from the GM+WM source. For this cluster, the identified source is the same as that of the white matter localization method. Unfilled boxes indicates that the source is >45 mm from the electrode and grey matter propagation is not permitted. Lighter filled box (light blue) represents white matter propagation to the leader (RAD17), followed by grey matter propagation to the follower. Darker unfilled box (purple) represents grey matter propagation to the leader, followed by white matter propagation to the follower. This is the only approach that successfully explains the observed lag times between all three pairs of electrodes.
Figure 3
Figure 3
Comparison of IED source localization methods across clusters. (A) Results for leading parcel localization, grey matter (GM) source localization, white matter (WM) source localization and GM+WM source localization in clusters 1 (240 sequences) and 2 (170 sequences) of Subject p80. This patient underwent an anterior temporal lobectomy (shaded area Fig. 4F) but experienced occasional disabling seizures postoperatively (Engel 2b). In both clusters 1 and 2, the leading parcel method localizes to the resected anterior temporal lobe. Grey matter source localization explains noticeably fewer sequences than GM+WM source localization across both clusters. The grey matter source for cluster 1 is in a sulcus posterior to the resection territory (Fig. 2B), whereas the grey matter source for cluster 2 is within the resection. White matter source localization creates a non-specific map of possible sources across both clusters, based on structural connectivity; integrating grey matter into the white matter method helps to identify the best source. This is apparent when comparing the white matter and GM+WM sources. GM+WM source localization discovers a source parcel posterior to the resection in both clusters. Notice that, in cluster 1, the maximal GM+WM source is distant from the leading parcel, whereas in cluster 2 the GM+WM source is adjacent to the leading parcel. (B) Comparison of the proportion of sequences explained by each source localization method, among the 67 total clusters. Significance bars represent results of Tukey’s multiple comparisons test after one-way repeated measures ANOVA. ****P < 0.0001; ns = not significant. (C) Histogram of Euclidean distances (in mm) from the leading parcel to the GM+WM source parcel. Distances were calculated between the centre of mass of each parcel. (D) Number of electrodes in the GM+WM source parcel, grouped by concordance with the leading parcel. When the GM+WM source parcel differed from the leading parcel, the number of electrodes per parcel was significantly less than when the GM+WM source parcel was the same as the leading parcel (Mann-Whitney U = 383.5, P-value = 0.002 one-tailed, median = 3 versus 8.5 electrodes per parcel).
Figure 4
Figure 4
White matter propagation may travel to distant electrodes before grey matter travelling waves reach nearby regions. (A) Depiction of the four possible relationships between leader-follower pairs across sequencers. The star represents the focal source of IEDs. The top row (grey matter propagation to E1) corresponds to Eqs 2–3, and the bottom row (white matter propagation to E1) corresponds to Eqs 4–5. The top left quadrant corresponds to grey matter sequences, whereas the other three quadrants that contain at least one leader-follower pair involving white matter propagation are classified as requiring white matter (+WM). (B) Mean number of sequences classified as grey matter versus +WM across clusters. Error bars for B, C, D and H represent 95% confidence intervals across 67 clusters. Significance bars for B, C and D show results of Wilcoxon signed-rank tests; ns = not significant; ****P < 0.0001. (C) Mean geodesic distances between the source parcel and all electrodes participating in sequences, grouped by sequence type. For all geodesic distance computations, electrodes contralateral to the source were excluded from analysis. (D) Mean lag times of all electrodes participating in sequences, grouped by sequence type. (E) Maximum propagation distances (in mm). For a given sequence, maximum propagation distance is calculated as the geodesic distance between the source parcel and the farthest electrode. The proportion of sequences is normalized by sequence type, such that each group sums to 1.00. (F) Exemplar IED sequence with distant leading electrodes in Subject p80. This patient underwent anterior temporal lobectomy but had occasional disabling seizures postoperatively (Engel 2b). Anterior shaded area (dark grey) = resection zone; posterior shaded area (red) = GM+WM source parcel; RPST = right posterior superior temporal; RAD = right amygdala depth; RPLT = right posterior lateral temporal. (G) Bivariate kernel density estimation (KDE) plots of lag times and propagation distances for all spikes (including leading and following electrodes). Density estimation is log normalized separately for each sequence classification. (H) Bar chart comparing the number of sequences explained by GM+WM propagation, depending on the index of the closest electrode in a sequence. In grey matter source localization, propagation velocity within sequences is fixed in all directions, so the leading electrode will always have a possible geodesic distance closest to the source parcel in its sequence. However, here we find the electrode with the shortest minimum geodesic distance to any part of the source parcel which closer approximates the clinical approach. Significance bars represent results of Tukey’s multiple comparisons test, only showing difference between index 1 (leading electrode) and all other indices. ****P < 0.0001; ns = not significant.
Figure 5
Figure 5
Source localization comparison with resection zone and surgical outcomes. (A) Concordance of the GM+WM source parcel with the resection cavity for every subject’s clusters. Patients are grouped by surgical outcome, where seizure free means Engel 1. (B) Distance (in mm) between the grey matter source and GM+WM source, grouped by concordance with the resection territory. Euclidean distance is computed between the centre of mass of each parcel. (C) Source localization maps for cluster with highest number of sequences in Subject p39. This cluster is outlined in A and B. The patient underwent a left temporal topectomy but was seizure persistent (Engel 3a) at time of latest follow-up (24 months postoperatively). Both the leading parcel method and grey matter source method yield solutions that remain relatively confined to the anterior temporal lobe. In contrast, the GM+WM source method is inconclusive with multiple putative sources explaining a high proportion of sequences in undersampled cortical regions.

References

    1. Alarcon G, Garcia Seoane JJ, Binnie CD, et al. Origin and propagation of interictal discharges in the acute electrocorticogram. Implications for pathophysiology and surgical treatment of temporal lobe epilepsy. Brain. 1997;120(Pt 12):2259–2282. - PubMed
    1. de Curtis M, Jefferys JGR, Avoli M. Interictal epileptiform discharges in partial epilepsy: Complex neurobiological mechanisms based on experimental and clinical evidence. In: Noebels JL, Avoli M, Rogawski MA, Olsen RW, Delgado-Escueta AV, eds. Jasper's basic mechanisms of the epilepsies, 4th ed. National Center for Biotechnology Information; 2012:213-227. - PubMed
    1. de Curtis M, Avanzini G. Interictal spikes in focal epileptogenesis. Prog Neurobiol. 2001;63:541–567. - PubMed
    1. Rosenow F, Luders H. Presurgical evaluation of epilepsy. Brain. 2001;124(Pt 9):1683–1700. - PubMed
    1. Zijlmans M, Zweiphenning W, van Klink N. Changing concepts in presurgical assessment for epilepsy surgery. Nat Rev Neurol. 2019;15:594–606. - PubMed