. 2023 Aug 17;186(17):3659-3673.e23.
doi: 10.1016/j.cell.2023.07.002. Epub 2023 Jul 31.

Repeat polymorphisms underlie top genetic risk loci for glaucoma and colorectal cancer

Affiliations

Repeat polymorphisms underlie top genetic risk loci for glaucoma and colorectal cancer

Ronen E Mukamel et al. Cell. .

Abstract

Many regions in the human genome vary in length among individuals due to variable numbers of tandem repeats (VNTRs). To assess the phenotypic impact of VNTRs genome-wide, we applied a statistical imputation approach to estimate the lengths of 9,561 autosomal VNTR loci in 418,136 unrelated UK Biobank participants and 838 GTEx participants. Association and statistical fine-mapping analyses identified 58 VNTRs that appeared to influence a complex trait in UK Biobank, 18 of which also appeared to modulate expression or splicing of a nearby gene. Non-coding VNTRs at TMCO1 and EIF3H appeared to generate the largest known contributions of common human genetic variation to risk of glaucoma and colorectal cancer, respectively. Each of these two VNTRs associated with a >2-fold range of risk across individuals. These results reveal a substantial and previously unappreciated role of non-coding VNTRs in human health and gene regulation.

Keywords: GWAS; VNTR; colorectal cancer; expression and splicing quantitative trait loci; genetic associations; genomic structural variation; glaucoma; imputation; tandem repeat; variable numbers of tandem repeats.


Conflict of interest statement

Declaration of interests The authors declare no competing interests.

Figures
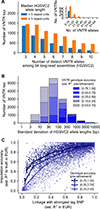
Figure 1.
Figure 1.. Ascertainment, genotyping and imputation of 15,653 multiallelic VNTR loci.
A) Counts of VNTR loci stratified by number of distinct alleles observed among N=64 long-read haploid genome assemblies from HGSVC2 (x-axis) and the median number of repeats per allele (blue/orange bars). Inset, same counts binned at coarser scale. B) Counts of VNTR loci stratified by HGSVC2 allele length distribution width (standard deviation) and estimated accuracy of VNTR genotypes pre-refinement (i.e., measured from WGS depth-of-coverage in individual genomes; STAR Methods). C) Scatter of imputation accuracy vs. level of linkage disequilibrium with the best tag SNP for each VNTR. Color indicates pre-refinement genotype accuracy as in b); VNTRs with noisy estimates of imputation accuracy due to low pre-refinement genotype accuracy (R2<0.25) were omitted, leaving N=7,145 VNTRs for plotting. Lines represent mean imputation accuracy at loci binned by level of linkage with SNPs. Error bars, 95% CIs; EUR, European-ancestry; est., estimated.
Figure 2.
Figure 2.. Phenome-wide association and statistical fine-mapping analyses identify 58 VNTRs linked to complex traits.
A) Manhattan plot displaying 107 VNTR-phenotype associations (involving 58 distinct VNTRs) that reached Bonferroni significance (P<5 × 10⁻⁹) and for which the VNTR was assigned a high posterior probability of causality by FINEMAP (PIP>0.5). Marker color indicates phenotype category, and marker shape indicates genic context. Outlined markers indicate associations for which we improved VNTR genotyping or refined the associated phenotype (Table S4). For context, the plot also includes two associations to protein-coding VNTRs (at MUC1 and TENT5A) that we previously identified in analysis of whole-exome sequencing data. B) Frequency of VNTR overlap with GeneHancer annotated promoters and enhancers (left), GENCODE (v26) exons (middle), and GENCODE (v26) transcripts (right) for VNTRs grouped by association and fine-mapping status. Error bars, 95%CIs.
Figure 3.
Figure 3.. An intronic repeat expansion within TMCO1 associates with glaucoma risk and intraocular pressure.
A) Frequencies of the 1-, 2-, and ≥5 repeat unit alleles in each of the continental populations represented in the 1000 Genomes Project. Expanded alleles (5–11 repeat units) segregated with a ~70kb SNP haplotype (red) represented by rs2790052:G. Each allele in HGSVC2 also contains a partial repeat (7bp of the 28bp unit) depicted in the haplotype diagrams. B,C) Associations of SNPs and VNTR with glaucoma (B) and intraocular pressure (C). SNP and VNTR associations are shown at the TMCO1 locus (top) and genome-wide (bottom). Colored markers in locus plots, variants in partial LD with the VNTR (R2>0.01). D,E) Effect sizes of VNTR alleles for glaucoma risk (D, left axis) and mean intraocular pressure in carriers of each allele (E, left axis). Values in UK Biobank are shown in blue; values inferred based on SNP associations in independent replication cohorts are shown in gray (STAR Methods). Histograms (right axis), frequencies of VNTR allele lengths estimated in European-ancestry UKB participants. Error bars, 95% CIs.
Figure 4.
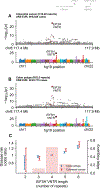
Figure 4.. A repeat expansion downstream of EIF3H associates with colorectal cancer risk and colon polyps.
A,B) Associations of inherited variants with colorectal cancer (A) and colon polyps (B) at the EIF3H locus (top) and genomewide (bottom). Colored markers in locus plots, variants in partial LD with the VNTR (R2>0.01). C) Frequencies of VNTR alleles observed in European-ancestry UKB participants (histogram, right axis) and their effect sizes (markers, left axis) for colorectal cancer (red) and colon polyps (blue). Error bars, 95% CIs.
Figure 5.
Figure 5.. An intronic repeat expansion at CUL4A associates with erythrocyte traits and splice isoform usage.
A) Alternative splicing of two commonly expressed CUL4A isoforms. The fifth intron of the canonical transcript contains a highly length-polymorphic VNTR (0.1–3kb, green). The image on the right is zoomed in on the region of CUL4A containing the alternative splice. B) VNTR and SNP associations with mean corpuscular hemoglobin at the CUL4A locus. Colored markers, variants in partial LD with the VNTR (R2>0.01). C) VNTR allele length distribution in European-ancestry UKB participants (histogram, right axis) and mean phenotype in carriers of VNTR alleles (binned by length) for the four most strongly associated blood cell traits (lines, left axis). D) VNTR and SNP associations with CUL4A alternative splicing usage in cultured fibroblasts. Colored markers, variants in partial LD with the VNTR (R2>0.01). E) VNTR allele distribution in GTEx (histogram, right axis) and mean alternative splice usage in carriers of VNTR alleles (binned by length) for the five tissues with the strongest VNTR association (lines, left axis). Alternative splice usage is the proportion of CUL4A transcripts that are alternatively spliced as indicated in panel (a) (as quantified by LeafCutter; STAR Methods). F) Scatter plot of VNTR association strength vs. strength of the strongest SNP association with alternative splicing in each of the N=49 tissues analyzed by GTEx. Gray dots, tissues for which no variant significantly associated with splicing. G) Scatter of median alternative splice usage vs. median CUL4A expression for each of N=49 tissues. Error bars, 95% CIs.
Figure 6.
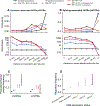
Figure 6.. VNTRs associated with gene regulation are enriched near relevant genomic elements and implicate genes mediating complex trait associations.
A) Frequency distribution of distances between eVNTRs and transcription start sites of associated genes (top). VNTRs are stratified by association status and fine-mapping PIP. Fold-change in frequency (i.e., enrichment) relative to baseline distribution (bottom) derived from all tested VNTR-gene pairs (black). B) Similar to panel (A) for distribution of distances between sVNTRs and affected splice sites. Affected splice sites are endpoints of introns whose excision counts are tabulated in the denominator of the associated splicing quantitative trait. C) Frequency of overlap with a GeneHancer annotated promoter or enhancer, stratifying VNTRs as in panels (A,B). D) Proportion of VNTRs involved in a fine-mapping-supported (PIP>0.5) association with a splicing or expression quantitative trait, stratifying VNTRs by association status and fine-mapping PIP in analyses of complex traits in UKB. Error bars, 95% CIs.
Figure 7.
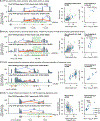
Figure 7.. Repeat polymorphisms influence splicing by diverse mechanisms.
VNTRs at UPF3A (A), NOC4L (B), PLIN5 (C), and PLQC1 (D) exhibit consistent evidence of regulating splicing across multiple tissues. See Data S1 for additional examples of splice-regulating VNTRs. At each locus: Sashimi plot (left) displaying RNA sequencing depth-of-coverage and LeafCutter intron excision counts for GTEx samples from individuals with short (top) or long (bottom) VNTR genotypes. Coverage within VNTR (green) is normalized to account for VNTR allele length. Orange arrows, splice sites identified by LeafCutter. Scatter plot of excision ratio vs. VNTR allele length sum (middle); dots correspond to samples from a single representative tissue. Excision ratios are computed from excision counts for the red vs. red plus blue introns (STAR Methods). Green markers, samples displayed in sashimi plots; large blue markers, means across samples binned by VNTR genotype; error bars, 95% CIs. Scatter of VNTR vs. SNP association statistics (right) for the splicing quantitative trait derived from the intron with starred excision count (left panel). Statistics are displayed for all tissues for which the VNTR reached study-wide significance (P<1 × 10⁻¹⁰). Marker fill, posterior probability of the VNTR’s inclusion in the causal set (PIP).

References

    1. Lalioti MD, Scott HS, Buresi C, Rossier C, Bottani A, Morris MA, Malafosse A, and Antonarakis SE (1997). Dodecamer repeat expansion in cystatin B gene in progressive myoclonus epilepsy. Nature 386, 847–851. 10.1038/386847a0. - DOI - PubMed
    1. Wijmenga C, Hewitt JE, Sandkuijl LA, Clark LN, Wright TJ, Dauwerse HG, Gruter A-M, Hofker MH, Moerer P, Williamson R, et al. (1992). Chromosome 4q DNA rearrangements associated with facioscapulohumeral muscular dystrophy. Nat. Genet. 2, 26–30. 10.1038/ng0992-26. - DOI - PubMed
    1. Course MM, Gudsnuk K, Smukowski SN, Winston K, Desai N, Ross JP, Sulovari A, Bourassa CV, Spiegelman D, Couthouis J, et al. (2020). Evolution of a Human-Specific Tandem Repeat Associated with ALS. Am. J. Hum. Genet. 107, 445–460. 10.1016/j.ajhg.2020.07.004. - DOI - PMC - PubMed
    1. Bakhtiari M, Park J, Ding Y-C, Shleizer-Burko S, Neuhausen SL, Halldórsson BV, Stefánsson K, Gymrek M, and Bafna V (2021). Variable number tandem repeats mediate the expression of proximal genes. Nat. Commun. 12, 2075. 10.1038/s41467-021-22206-z. - DOI - PMC - PubMed
    1. Eslami Rasekh M, Hernández Y, Drinan SD, Fuxman Bass JI, and Benson G (2021). Genome-wide characterization of human minisatellite VNTRs: population-specific alleles and gene expression differences. Nucleic Acids Res. 49, 4308–4324. 10.1093/nar/gkab224. - DOI - PMC - PubMed

Publication types

LinkOut - more resources