. 2023 Aug 1;14(1):4610.
doi: 10.1038/s41467-023-40326-6.

A genetically encoded sensor for visualizing leukotriene B4 gradients in vivo

Affiliations

A genetically encoded sensor for visualizing leukotriene B4 gradients in vivo

Szimonetta Xénia Tamás et al. Nat Commun. .

Abstract

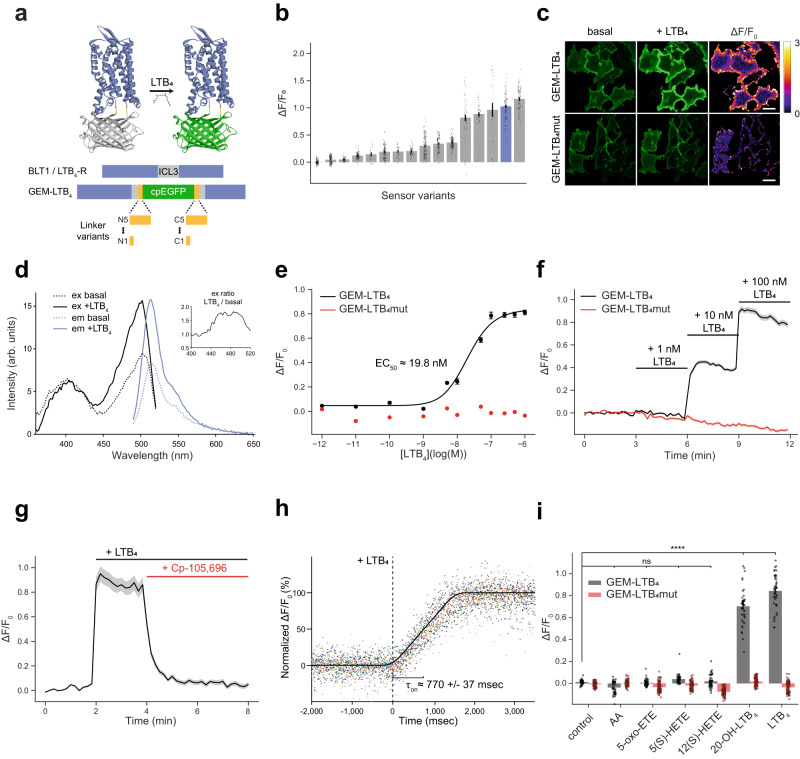
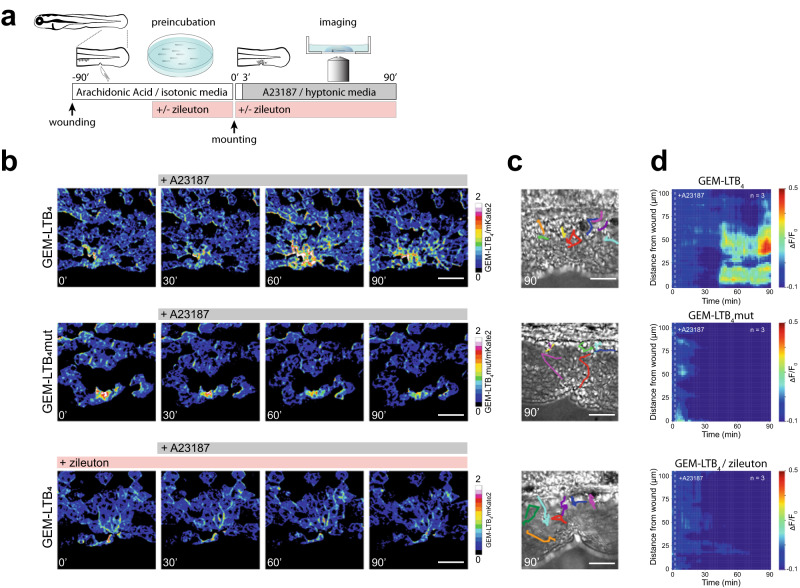
Leukotriene B4 (LTB4) is a potent lipid chemoattractant driving inflammatory responses during host defense, allergy, autoimmune and metabolic diseases. Gradients of LTB4 orchestrate leukocyte recruitment and swarming to sites of tissue damage and infection. How LTB4 gradients form and spread in live tissues to regulate these processes remains largely elusive due to the lack of suitable tools for monitoring LTB4 levels in vivo. Here, we develop GEM-LTB4, a genetically encoded green fluorescent LTB4 biosensor based on the human G-protein-coupled receptor BLT1. GEM-LTB4 shows high sensitivity, specificity and a robust fluorescence increase in response to LTB4 without affecting downstream signaling pathways. We use GEM-LTB4 to measure ex vivo LTB4 production of murine neutrophils. Transgenic expression of GEM-LTB4 in zebrafish allows the real-time visualization of both exogenously applied and endogenously produced LTB4 gradients. GEM-LTB4 thus serves as a broadly applicable tool for analyzing LTB4 dynamics in various experimental systems and model organisms.


Conflict of interest statement

The authors declare no competing interests.

Figures

Fig. 1
Fig. 1. Development and characterization of the GEM-LTB4 sensor in HEK293A cells.
a Schematic diagram of LTB4-sensor design showing fluorescence increase upon ligand binding. The sensor consists of cpEGFP inserted with linkers into the 3rd intracellular loop (ICL3) of BLT1. b Summary of ΔF/F0 fluorescence responses in all LTB4-sensor variants tested in this study. Data shown as mean ± SEM for n = 106, 134, 61, 90, 17, 105, 30, 62, 135, 98, 139, 62, 47, 26, 97 and 86 cells from 3 independent experiments, respectively. GEM-LTB4 is shown in blue. c Representative GEM-LTB4 and GEM-LTB4mut confocal fluorescence and corresponding ΔF/F0 ratio images in HEK293A cells before and after 100 nM LTB4 stimulation. Scale bars, 25 µm. d Excitation and emission spectra of GEM-LTB4 in the absence (dotted lines) and presence (continuous lines) of 100 nM LTB4. Insert shows ratio of excitation spectra. Each trace is the average of n = 3 independent experiments (arb. units=arbitrary units). e Dose-response measurements of GEM-LTB4 and GEM-LTB4mut, with the corresponding EC50 value. Data shown as mean ± SEM for n = 66 and 218 cells per condition, respectively, from 3 independent experiments. EC50 value was obtained by fitting the data to a four-parameter log-logistic function. f Average ΔF/F0 responses of GEM-LTB4 and GEM-LTB4mut to sequentially added increasing doses of LTB4. Data shown as mean ± SEM for n = 113 and 181 cells, respectively, from 3 independent experiments. g GEM-LTB4 response to 100 nM LTB4 stimulation followed by treatment with 1 µM of the BLT1 inhibitor CP-105,696. Data shown as mean ± SEM for n = 85 cells from 3 independent experiments. h Kinetic analysis from high-speed acquisition of GEM-LTB4 fluorescence in HEK293A cells during 100 nM LTB4 stimulation. All measured normalized data points and the average fitted curve are shown from n = 13 cells from 7 independent experiments. i Maximal ΔF/F0 responses of GEM-LTB4 and GEM-LTB4mut to 100 nM of the indicated eicosanoid compounds. Data shown as mean ± SEM for n = 45 and 88 cells, respectively, from 3 independent experiments. Statistical analysis were performed with One-way ANOVA (F = 761.3, p = 2.0 × 10−181) with Dunnett’s correction (20-OH-LTB4 and LTB4 are different from control for GEM-LTB4). Source data are provided as a Source Data file.
Fig. 2
Fig. 2. Real-time measurements of LTB4 release from neutrophils with GEM-LTB4.
a ELISA measurement of LTB4 secretion by murine neutrophils stimulated with 2 µM fMLP for 28 min. Data shown as mean ± SEM for 3 independent experiments, two-tailed unpaired t-test, **P = 0.0012. b Brightfield microscopy and corresponding ΔF/F0 ratio images of murine neutrophils seeded over HEK293A cells expressing GEM-LTB4 (left) and GEM-LTB4mut (right). Scale bars, 100 µm. Representative images were taken before neutrophil addition (basal), after adding neutrophils and stimulating with 2 µM fMLP (20 min) and followed by 100 nM LTB4 stimulation (35 min). c Average traces of ΔF/F0 responses in GEM-LTB4 and GEM-LTB4mut expressing cells shown in b. Data are presented as mean ± SEM for n = 600 and 465 cells respectively from 3 independent experiments. d Relative surface area of GEM-LTB4 expressing cells shown in b, reacting with over 50% increase in normalized ΔF/F0 as a response to 2 × 106 neutrophils stimulated with 2 µM fMLP in a 1 cm2 chamber. Data shown as mean ± SEM for n = 15-15 fields of view from 3-3 independent experiments with two-tailed unpaired t-test, ***P = 0.001159. e Brightfield microscopy and corresponding ΔF/F0 ratio images of GEM-LTB4 expressing HEK293A with neutrophils seeded over them at a ~ 1/10 density compared to b. Representative ΔF/F0 images taken before neutrophil addition (basal) and at two time points after stimulation with 2 µM fMLP followed by 100 nM LTB4. White asterisk (*) refers to the center of the analysis shown in f. Scale bars, 20 µm. f Representative spatiotemporal traces of pixelwise ΔF/F0 GEM-LTB4 values from e. The spatial origo is the center of the marked neutrophil (*) also shown in the inlay image. Similar results were obtained in n = 3 independent experiments. Source data are provided as a Source Data file.
Fig. 3
Fig. 3. Expression of GEM-LTB4 in zebrafish and exogenous LTB4 penetration detection.
a Representative confocal fluorescence imaging and quantification of ΔF/F0 responses of GEM-LTB4 in Tg(krt4:QF2 x QUAS:GEM-LTB4) (top) and Tg(krt19:QF2 x QUAS:GEM-LTB4) (bottom) zebrafish larvae before and after 1 µM LTB4 stimulation. Enlarged images show the cellular distribution of GEM-LTB4 expression in the respective epithelial layers. Scale bars, 100 µm and data are presented as mean ± SEM for n = 12 and 16 cells from 3 and 4 independent fish, respectively. b Representative ΔF/F0 of time-lapse images of amputated zebrafish larvae Tg(krt4:QF2 x QUAS:GEM-LTB4) after stimulation with 1 µM LTB4. Scale bar, 100 µm. c Averaged spatiotemporal profile plot of GEM-LTB4 ΔF/F0 responses after stimulation of intact tail fins with 1 µM LTB4 in Tg(krt4:QF2 x QUAS:GEM-LTB4) larvae. n = 3 larvae. d Averaged spatiotemporal profile plot of GEM-LTB4 (left) and GEM-LTB4mut (right) ΔF/F0 responses after stimulation of amputated tail fins with 1 µM LTB4 in Tg(krt4:QF2 x QUAS:GEM-LTB4) and Tg(krt4:QF2 x QUAS:GEM-LTB4mut) larvae. The amputation and stimulation were performed under isotonic conditions (see Methods for details). n = 3 larvae. e Measurement of neutrophil movement triggered by control or LTB4 towards amputational tail fin wounds imaged in Tg(mpx:GFP)i114 zebrafish larvae by light transmission and fluorescence microscopy. Top left: scheme of neutrophil movement quantification towards the wound. Left: representative leukocyte tracks capturing all visible cell movements during imaging in control and 1 µM LTB4 treated samples. Right: Time course of average neutrophil movement towards the wound shown in b, in control and in 1 µM LTB4 stimulated larvae. Data are shown as mean ± SEM for n = 25 and 38 cells from 5 and 4 independent experiments, respectively, with a two-tailed unpaired t-test, ****P = 1.6 × 10−9 performed at the endpoint of the measurement. Source data are provided as a Source Data file.
Fig. 4
Fig. 4. Endogenous LTB4 release measured by GEM-LTB4 in zebrafish.
a Schematics of experimental design for measuring endogenous LTB4 release. Larvae were wounded and pre-incubated in isotonic E3 with 20 µM arachidonic acid for 90 min alone or in combination with 20 µM of the 5-lipoxygenase inhibitor zileuton, and then stimulated with 100 µM A23187 after mounting in hypotonic agarose. b Representative pseudo-color of green/red ratio of time-lapse images of zebrafish larvae Tg(krt19:QF2 x QUAS:GEM-LTB4) (top and bottom) and Tg(krt19:QF2 x QUAS:GEM-LTB4mut) (middle) in the basal epithelial cells. Scale bars, 50 µm. c Brightfield images of the corresponding wounded tail fins in b, at 90 min with manually traced leukocyte time lapse tracks shown in color. Scale bars, 50 µm. d Averaged spatiotemporal profile plots of corresponding experiments shown in b. n = 3 larvae each.

Similar articles

Cited by

References

    1. Sarris M, Sixt M. Navigating in tissue mazes: chemoattractant interpretation in complex environments. Current Opinion in Cell Biology. 2015;36:93–102. doi: 10.1016/j.ceb.2015.08.001. - DOI - PubMed
    1. SenGupta S, Parent CA, Bear JE. The principles of directed cell migration. Nat. Rev. Mol. Cell Biol. 2021;22:529–547. doi: 10.1038/s41580-021-00366-6. - DOI - PMC - PubMed
    1. Kolaczkowska E, Kubes P. Neutrophil recruitment and function in health and inflammation. Nat. Rev. Immunol. 2013;13:159–175. doi: 10.1038/nri3399. - DOI - PubMed
    1. Sadik CD, Luster AD. Lipid-cytokine-chemokine cascades orchestrate leukocyte recruitment in inflammation. Journal of Leukocyte Biology. 2012;91:207–215. doi: 10.1189/jlb.0811402. - DOI - PMC - PubMed
    1. Afonso PV, et al. LTB4 Is a Signal-Relay Molecule during Neutrophil Chemotaxis. Developmental Cell. 2012;22:1079–1091. doi: 10.1016/j.devcel.2012.02.003. - DOI - PMC - PubMed

Publication types