. 2023 Aug 1;14(8):490.
doi: 10.1038/s41419-023-06022-5.

Inhibition of autotaxin alleviates pathological features of hepatic encephalopathy at the level of gut-liver-brain axis: an experimental and bioinformatic study

Affiliations

Inhibition of autotaxin alleviates pathological features of hepatic encephalopathy at the level of gut-liver-brain axis: an experimental and bioinformatic study

Ali Sepehrinezhad et al. Cell Death Dis. .

Abstract

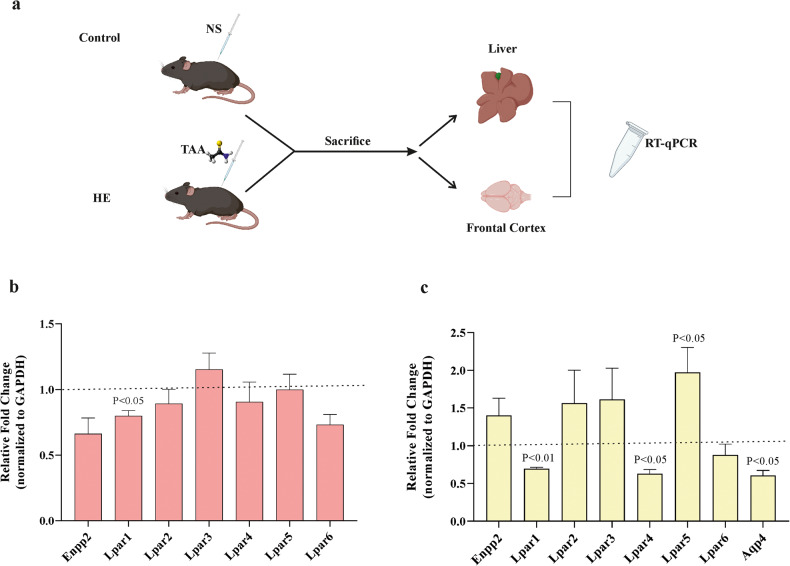
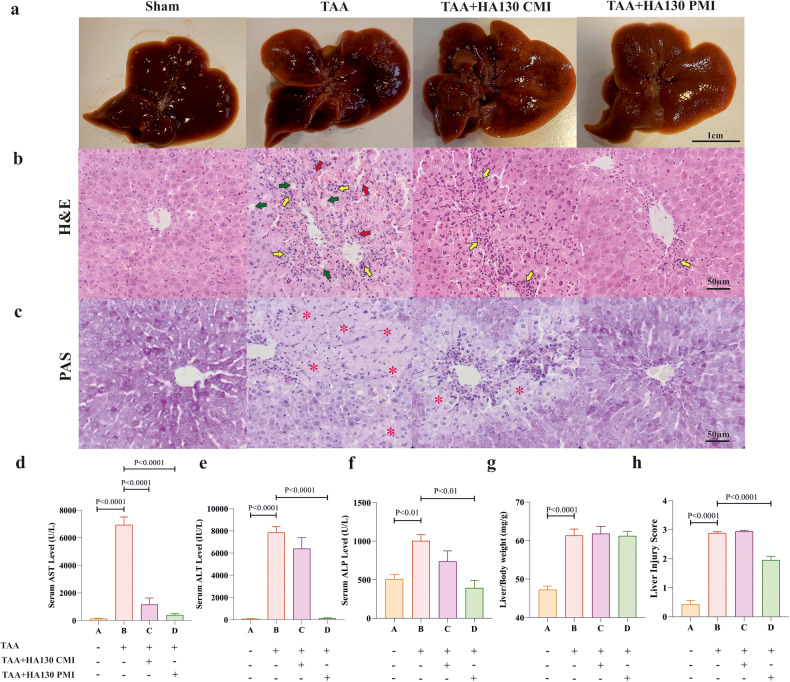
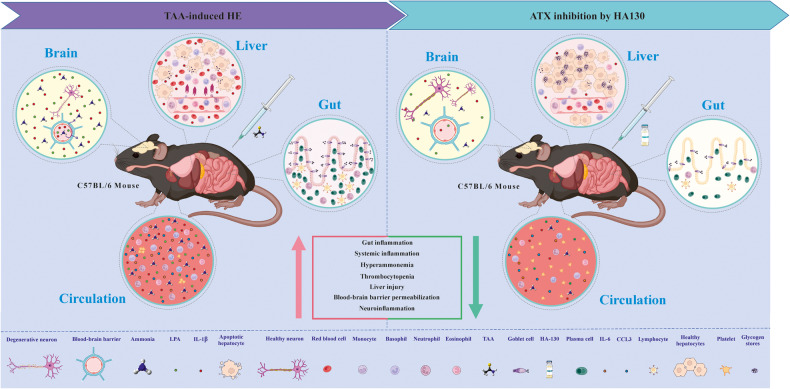
There is accumulating evidence that the circulatory levels of autotaxin (ATX) and lysophosphatidic acid (LPA) are increased in patients with severe liver disease. However, the potential role of the ATX-LPA axis in hepatic encephalopathy (HE) remains unclear. Our study aimed to investigate the role of the ATX-LPA signaling pathway in mice with thioacetamide (TAA) induced acute HE. To show the role of the ATX-LPA axis in the context of HE, we first measured the involvement of ATX-LPA in the pathogenesis of TAA-induced acute HE. Then, we compared the potential effects of ATX inhibitor (HA130) on astrocyte responses at in vitro and gut-liver-brain axis at in vivo levels. The inflammatory chemokine (C-C motif) ligand 3 was significantly increased in the hyperammonemic condition and could be prevented by ATX inhibition in astrocytes at in vitro level. Further statistical tests revealed that plasma and tissue pro-inflammatory cytokines were inhibited by HA130 in mice. Furthermore, the stage of HE was significantly improved by HA130. The most surprising result was that HA130 alleviated immune infiltrating cells in the liver and intestine and decreased mucus-secreting cells in the intestine. Further analysis showed that the levels of liver enzymes in serum were significantly decreased in response to ATX inhibition. Surprisingly, our data indicated that HA130 could recover permeabilization of the blood-brain barrier, neuroinflammation, and recognition memory. Besides that, we found that the changes of Interleukin-1 (IL-1) and aquaporin-4 (AQP4) in HE might have a connection with the glymphatic system based on bioinformatics analyses. Taken together, our data showed that the ATX-LPA axis contributes to the pathogenesis of HE and that inhibition of ATX improves HE.


Conflict of interest statement

The authors declare no competing interests.

Figures

Fig. 1
Fig. 1. The responses of astrocytes in a hyperammonemic condition and treated by ATX inhibition.
a Phase-contrast images of astrocytes in control and NH4Cl groups (n = 5/group) as well as a schematic diagram of the RT-PCR procedure are shown. b The expression of ectonucleotide pyrophosphatase/phosphodiesterase 2 (Enpp2; ATX gene) and lysophosphatidic acid receptors (LPARs) family at mRNA level in ammonia-exposed astrocytes. Fold-change for the control group is shown with a horizontal dotted line that equals one (n = 3/group). c Representative images of the expression of GFAP in different experimental groups are visualized by rabbit GFAP-specific antibody and anti-rabbit FITC antibody (green) using invert microscopy (n = 4/group). Cell nuclei were stained with PI (red). The bar graph indicated the percentage of GFAP-positive cells (n = 4/group). d The percentage of viable cells after exposure of the astrocyte cultures to NH4Cl and NH4Cl + HA130 using MTT assay (n = 5/group). e Flow cytometry measured forward scatter as an indicator of cell volume changes in different experimental groups. The bar graph represented the mean of forward scatter height (FSC-H) for all the experimental groups (n = 6–8/group). f AQP4 mRNA expression in ammonia-exposed astrocytes and treatment group were normalized to an internal reference (actin beta) compared to the control group (n = 3/group). gj Sandwich ELISA method was used to measure the concentration of LPA, IL-1β, IL-6, and CCL3 in supernatants of astrocyte cultures after 24 h exposure with ammonia (5 mM) and ammonia-exposed astrocytes that were treated over 4 h with an autotaxin inhibitor (n = 3–5/group). Unpaired Student’s t-test test was used to compare fold-changes between control and ammonia groups in b and one-way ANOVA and post hoc Tukey’s multiple comparisons were performed to compare among all groups in cj. Data are expressed as mean ± SEM. Aqp4 aquaporin-4, CCL3 chemokine (C–C motif) ligand 3, FSC-H forward scatter height, GFAP glial fibrillary acidic protein, IL-1β interleukin 1 beta, IL-6 interleukin 6, LPA lysophosphatidic acid, SSC-H side scatter height.
Fig. 2
Fig. 2. ATX inhibition decreases infiltration of immune cells and suppresses goblet cell proliferation into the gut in HE mice.
a and e hematoxylin and eosin (H&E) stained sections in different groups represent the distribution of plasma cells (yellow arrowheads), lymphocytes (green arrowheads), and neutrophils (red arrowheads) in the lamina propria of duodenum and colon. Representative bar graphs present the plasma cells (b and f), lymphocytes (c and g), and neutrophils (d and h) in duodenal sections of experimental mice (n = 5–9/group). i and k PAS-stained duodenal sections display the number of goblet cells (green arrows) in duodenal and colon villi (n = 5–7/group). Representative bar graphs present the percentage of goblet cells in duodenal (j) and colon (l) sections of experimental mice (n = 5–9/group). m Schematic illustration shows the Swiss-role technique for microscopic examination of the intestine. Data are presented as mean ± SEM and analyzed one-way ANOVA and post hoc Tukey’s multiple comparisons. CMI concurrent model intervention, H&E hematoxylin and eosin, PAS periodic acid–Schiff, PMI post model intervention, TAA thioacetamide.
Fig. 3
Fig. 3. Hepatic encephalopathy differentially regulates the expression of LPARs in liver tissue and cerebral cortex of mice.
a Schematic illustration of the experimental procedure. Samples were taken from target tissues and processed for mRNA expression. The mRNA expression of Enpp2 and LPARs family in liver (b) as well as AQP4 in cerebral cortex tissues (c) of HE mice, which were normalized to an internal reference (glyceraldehyde 3-phosphate dehydrogenase; GAPDH) compared to the control group (n = 4–5/group). Fold-change for the sham group is considered 1 as shown with horizontal dot lines. Data are expressed as mean ± SEM and analyzed by unpaired Student’s t-test test. HE hepatic encephalopathy, NS normal saline, RT-qPCR reverse transcription quantitative real-time polymerase chain reaction, TAA thioacetamide.
Fig. 4
Fig. 4. ATX inhibition attenuates HE pathogenesis in terms of LPA overproduction, hyperammonemic conditions, and inflammation in HE mice.
The Sandwich ELISA method was used to measure the concentration of LPA (n = 5–9/group) and iPLA2 (n = 67/group) in plasma (a and d), liver (b and e), and frontal cortex (c and f) of experimental groups. The levels of ammonia in plasma (g), liver tissue (h), and frontal cortex (i) were assessed in different groups (n = 6–11/group). The concentration of pro-inflammatory cytokines IL-1β, IL-6, TNF alpha, and CCL3 in serum or plasma (j, m, p, s), liver tissue (k, n, q, t), and frontal cortex (l, o, r, u) in experimental groups (n = 5–9/group). Data are expressed as mean ± SEM and analyzed by one-way ANOVA and post hoc Tukey’s multiple comparisons. CMI concurrent model induction, CCL3 chemokine (C–C motif) ligand 3, CMI concurrent model intervention, IL-1β interleukin 1 beta, IL-6 interleukin 6, LPA lysophosphatidic acid, PMI post model intervention, TAA thioacetamide, TNF alpha tumor necrosis factor-alpha.
Fig. 5
Fig. 5. HA130 improved TAA-induced liver injury in mice.
a Macroscopic view and morphological changes of the liver were seen in experimental groups. b Representative liver sections in H&E staining showed normal appearance in sham mice, leukocyte infiltration (yellow arrows), hepatocyte necrosis (green arrows), and severe hemorrhage (red arrows) in TAA group, only leukocyte infiltration in TAA + HA130 CMI, and almost normal appearance in TAA + HA130 PMI mice (n = 6–10/group). c Severe glycogen depletion in TAA mice in liver tissue was obvious, TAA + HA130 CMI mice showed moderate glycogen depletion, whileTAA+HA130 PMI mice displayed normal appearance in PAS staining liver sections (n = 5/group). The levels of serum-specific liver enzymes including AST (d), ALT (e), and ALP (f) in experimental groups (n = 6–7/group). g Bar graph of relative liver weights that were calculated as liver weights to body weights for experimental groups (n = 10–17/group). h H&E-stained-liver sections were quantitated by the severity of nuclear pyknosis, cytoplasmic hypereosinophilia, hepatocyte necrosis, hemorrhage, and neutrophil infiltration (n = 6–10/group). Data are expressed as mean ± SEM and analyzed by one-way ANOVA and post hoc Tukey’s multiple comparisons. ALP alkaline phosphatase, ALT alanine aminotransferase, AST aspartate aminotransferase, CMI concurrent model intervention, H&E hematoxylin and eosin, PAS periodic acid–Schiff, PMI post model intervention, TAA thioacetamide.
Fig. 6
Fig. 6. ATX inhibition improved HE-induced impaired recognition memory, recovered impaired blood-brain barrier permeability and improved cortical cells injury in HE mice.
a Discrimination index as an indicator for learning and memory calculated based on novel object recognition test in experimental groups (n = 7–11/group). b Schematic illustration of Evans blue dye technique for assessing of the permeability of BBB in experimental groups is shown. c Bar graph indicates BBB permeability as quantified by Evans blue leakage in cortical pieces (n = 6–7/group). d The percentage of brain water content during the time course of the experiment (n = 6/group). e The levels of ammonia in the hippocampus of experimental groups (n = 4–5/group). Representative electron micrographs from the frontal cortex of saline-treated (f, j, n), TAA-treated (g, k, o), TAA + HA130 CMI treated (h, l, p) and TAA + HA130 PMI treated (i, m, q) mice. The black arrow in g points to a dark compacted pyramidal neuron, white arrowheads in k point to endothelial cytoplasmic projections and disrupted tight junctions, and the white arrow in o points to swelled mitochondria in an astrocyte cell in HE mice. White arrows in l point to swelled mitochondria in the astrocyte while green arrow and white arrowhead in p point to an enlarged mitochondrion and a disrupted tight junction of an activated endothelial cell in the TAA + HA130 CMI group. White arrowheads in m point to a normal-looking endothelial cell with intact tight junctions in TAA + HA130 PMI group. r H&E-stained brain sections showed pyknosis and degenerative cells (red arrowheads) in both TAA and TAA + HA130 CMI mice, while displaying normal structure in TAA + HA130 PMI group. s Bar graph has represented the ratio of degenerative cortical cells in experimental groups compared to the saline-treated control group (n = 6–10/group). t Immunohistochemical staining against GFAP as an astrocyte marker was performed. u Bar graph indicates the ratio of GFAP-positive cells (brown cells) in the frontal cortex in different experimental groups (n = 5/group). v PAS staining sections show activated microglia/macrophages in the frontal cortex of different experimental groups. w Bar graph represents the ratio of PAS-positive cells (yellow arrowheads) in the cerebral cortex (n = 7–9). Data are expressed as mean ± SEM and analyzed by one-way ANOVA and post hoc Tukey’s multiple comparisons. Ast astastrocyte, C capillary, CMI concurrent model intervention, EC endothelial cell, GFAP glial fibrillary acidic protein, H&E hematoxylin and eosin, PC pericyte, PMI post model intervention, PN pyramidal neuron, TAA thioacetamide, TCA trichloroacetic acid.
Fig. 7
Fig. 7. Genetic network, GO analysis, enriched Reactome pathway, and microRNAs prediction of both glymphatic system and the BBB associated genes and IL-1β.
a Reconstructed genetic network of genes associated with the glymphatic system (blue nodes), BBB-related genes (green nodes), and IL-1β. Diamond-shaped nodes are common between the two networks. b and c GO biological enrichment analysis of genes associated with glymphatic system+IL-1β (b) and gene related to BBB + IL-1β (c). d and e Reactome pathway analysis for IL-1β along with genes related to the glymphatic system (d) and BBB (e). f Cellular component enrichment analysis of IL-1β along with genes related to the glymphatic system (blue plot) and BBB (orange plot). g Predicted microRNA for genes associated with the glymphatic system and IL-1β. h Enriched microRNA for genes associated with the BBB and IL-1β.
Fig. 8
Fig. 8. Summary of the in vivo effects of HA130 on gut–liver–brain axis in the experimental mice model of HE.
Two consecutive intraperitoneal injections of thioacetamide produced intestinal inflammation, systemic inflammation, liver injury, hyperammonemia and neuroinflammation in mice. Inhibition of autotaxin by HA130 significantly alleviated these pathological conditions in HE mice.

Similar articles

Cited by

References

    1. Ahl B, Weissenborn K, van den Hoff J, Fischer-Wasels D, Köstler H, Hecker H, et al. Regional differences in cerebral blood flow and cerebral ammonia metabolism in patients with cirrhosis. Hepatology. 2004;40:73–9. doi: 10.1002/hep.20290. - DOI - PubMed
    1. Sun X, Lv Y, Huang L, Gao H, Ren C, Li J, et al. Pro-inflammatory cytokines serve as communicating molecules between the liver and brain for hepatic encephalopathy pathogenesis and Lycium barbarum polysaccharides protection. J Ethnopharmacol. 2020;248:112357. doi: 10.1016/j.jep.2019.112357. - DOI - PubMed
    1. Sepehrinezhad A, Zarifkar A, Namvar G, Shahbazi A, Williams R. Astrocyte swelling in hepatic encephalopathy: molecular perspective of cytotoxic edema. Metab Brain Dis. 2020;35:559–78. doi: 10.1007/s11011-020-00549-8. - DOI - PubMed
    1. Trovato FM, Zia R, Artru F, Mujib S, Jerome E, Cavazza A, et al. Lysophosphatidylcholines modulate immunoregulatory checkpoints in peripheral monocytes and are associated with mortality in people with acute liver failure. J Hepatol. 2022;78:558–73. - PubMed
    1. Nie C, Zhang L, Chen X, Li Y, Ha F, Liu H, et al. Autotaxin: an early warning biomarker for acute-on-chronic liver failure. J Clin Transl Hepatol. 2020;8:240. doi: 10.14218/JCTH.2020.00045. - DOI - PMC - PubMed

Publication types