. 2023 Aug 1;14(1):4622.
doi: 10.1038/s41467-023-40216-x.

Genetic inhibition of CARD9 accelerates the development of atherosclerosis in mice through CD36 dependent-defective autophagy

Affiliations

Genetic inhibition of CARD9 accelerates the development of atherosclerosis in mice through CD36 dependent-defective autophagy

Yujiao Zhang et al. Nat Commun. .

Abstract

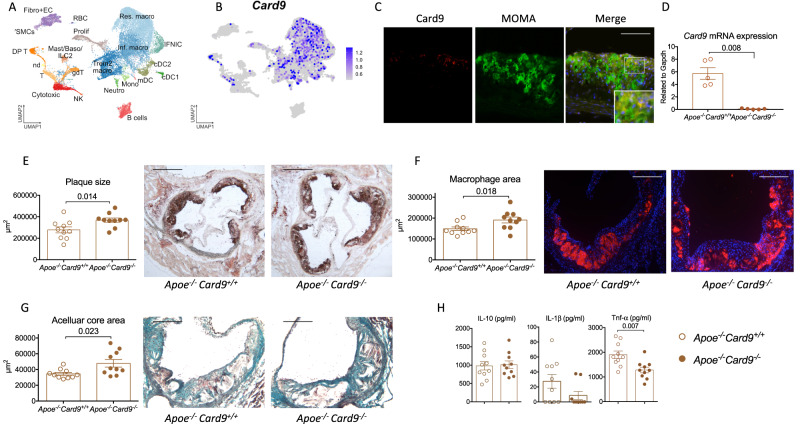
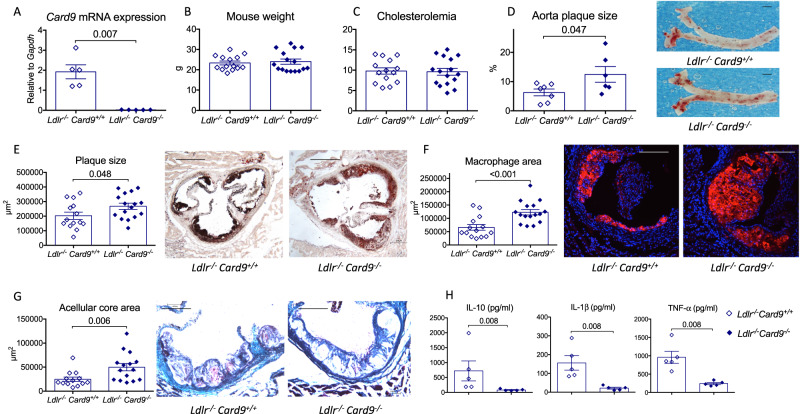
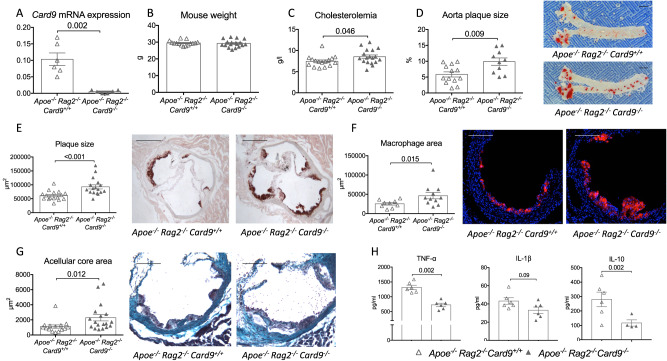
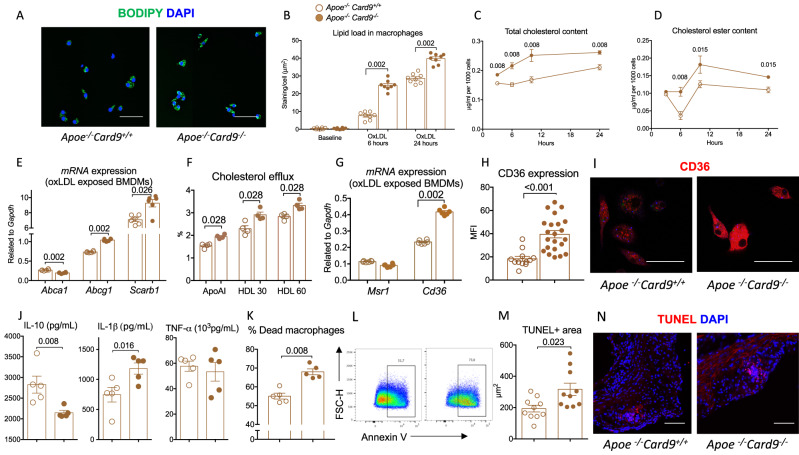
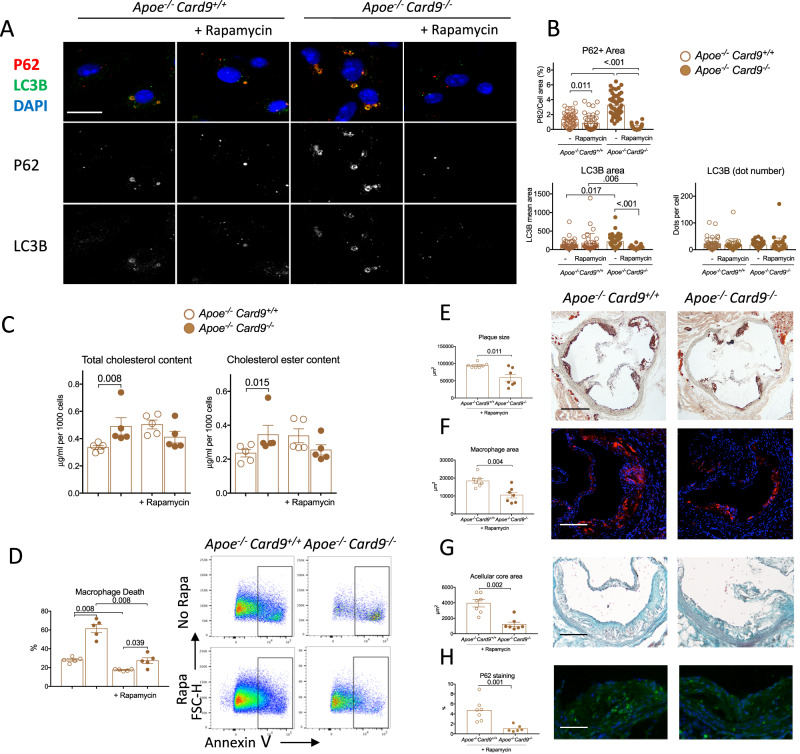
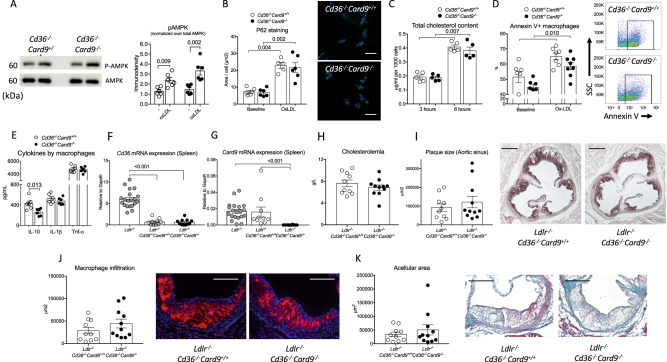
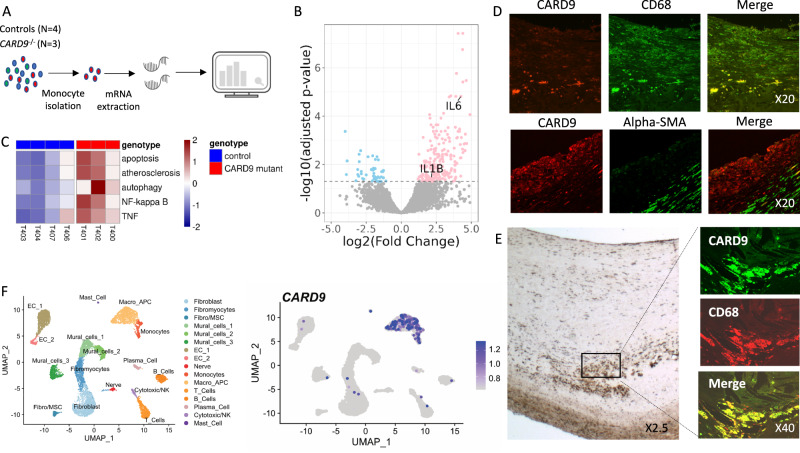
Caspase recruitment-domain containing protein 9 (CARD9) is a key signaling pathway in macrophages but its role in atherosclerosis is still poorly understood. Global deletion of Card9 in Apoe-/- mice as well as hematopoietic deletion in Ldlr-/- mice increases atherosclerosis. The acceleration of atherosclerosis is also observed in Apoe-/-Rag2-/-Card9-/- mice, ruling out a role for the adaptive immune system in the vascular phenotype of Card9 deficient mice. Card9 deficiency alters macrophage phenotype through CD36 overexpression with increased IL-1β production, increased lipid uptake, higher cell death susceptibility and defective autophagy. Rapamycin or metformin, two autophagy inducers, abolish intracellular lipid overload, restore macrophage survival and autophagy flux in vitro and finally abolish the pro-atherogenic effects of Card9 deficiency in vivo. Transcriptomic analysis of human CARD9-deficient monocytes confirms the pathogenic signature identified in murine models. In summary, CARD9 is a key protective pathway in atherosclerosis, modulating macrophage CD36-dependent inflammatory responses, lipid uptake and autophagy.


Conflict of interest statement

The authors declare no competing interests.

Figures

Fig. 1
Fig. 1. Global Card9 deficiency accelerates atherosclerosis in Apoe-/- mice.
scRNA-seq analysis of Card9 transcript expression in murine arteries with 26,910 immune and non immune cells from the aorta of atherosclerotic mice (integrated analysis of 13 datasets). A UMAP representation of single-cell RNA-seq gene expression data and cellular lineage identification. (VSMCs vascular smooth muscle cells, Fibro+EC fibroblasts and endothelial cells, DP T double poisitive T cells, RBC red blood cells, Prolif proliferating cells, Mast/BAso/ILC2 mast cells, basophils and type 2 innate lymphoid cells, T T cells, NK natural killer cells, gdT gammadelta T cells, Neutro neutrophils, Mono monocytes, mDC mature dendritic cells, cDC1 and 2 classical dendritic cells 1 and 2, IFNIC type I interferon inducible cells, Trem2 macro Trem2hi/Foamy macrophages, Inf. Macro inflammatory macrophages, Res. Macro resident macrophages, nd not determined). B Card9 expression in single cells projected onto the UMAP plot. C Card9 (Red) and MOMA-2 (Green) immunofluorescent staining in plaques of 20-week old Apoe-/- mice (Representative of 7 atherosclerotic plaques). Scale bar 50 μm. D Card9 mRNA expression by peritoneal macrophages isolated from Apoe-/-Card9+/+ and Apoe-/-Card9-/- mice (n = 5/group). E representative photomicrographs and quantitative analysis of atherosclerotic lesions in the aortic sinus of male Apoe-/-Card9+/+ and Apoe-/-Card9-/- mice after 6 weeks of fat diet (2 experiments pooled, n = 10/group); Scale bar 200 μm. F representative photomicrographs and quantitative analysis of macrophage accumulation (MOMA staining, red) in atherosclerotic lesions of Apoe-/-Card9+/+ and Apoe-/-Card9-/- mice after 6 weeks of fat diet (2 experiments pooled, n = 10/group); Scale bar 100 μm. G Representative photomicrographs and quantitative analysis of acellular area (Masson’s Trichrome) of Apoe-/-Card9+/+ and Apoe-/-Card9-/- mice after 6 weeks of fat diet (2 experiments pooled, n = 10/group); Scale bar 100 μm. H Cytokine production (ELISA in the supernatant) by Lps/Ifnγ-stimulated splenocytes from Apoe-/-Card9+/+ and Apoe-/-Card9-/- mice (n = 10/group). Data are presented as mean values ±SD. Two-tailed Mann–Whitney test. Source data are provided as a Source Data file.
Fig. 2
Fig. 2. Hematopoietic Card9 deficiency accelerates atherosclerosis in Ldlr-/- mice.
A Card9 mRNA expression by peritoneal macrophages isolated from chimeric Ldlr-/-Card9+/+ and Ldlr-/-Card9-/- mice (n = 5/group). B body weight at sacrifice after 8 weeks of fat diet (n = 14/group). C plasma cholesterol levels at sacrifice after 8 weeks of fat diet (n = 14/group). D representative photomicrographs and quantitative analysis of atherosclerotic lesions on the thoraco-abdominal aortas from chimeric female Ldlr-/-Card9+/+ and Ldlr-/-Card9-/- mice after 8 weeks of fat diet (n = 7 Ldlr-/-Card9+/+ and n = 6 Ldlr-/-Card9-/-); Scale bar 1 mm. E representative photomicrographs and quantitative analysis of atherosclerotic lesions in the aortic sinus of chimeric Ldlr-/-Card9+/+ and Ldlr-/-Card9-/- mice after 8 weeks of fat diet (2 experiments pooled, n = 14/group); Scale bar 200 μm. F representative photomicrographs and quantitative analysis of macrophage accumulation (MOMA staining, red) in atherosclerotic lesions of chimeric Ldlr-/-Card9+/+ and Ldlr-/-Card9-/- mice after 8 weeks of fat diet (2 experiments pooled, n = 14/group); Scale bar 100 μm. G Representative photomicrographs and quantitative analysis of acellular area (Masson’s Trichrome) of chimeric Ldlr-/-Card9+/+ and Ldlr-/-Card9-/- mice after 8 weeks of fat diet (2 experiments pooled, n = 14/group); Scale bar 100 μm. H Cytokine production (ELISA in the supernatant) by Lps/Ifnγ-stimulated splenocytes isolated from chimeric Ldlr-/-Card9+/+ and Ldlr-/-Card9-/- mice (n = 5 Ldlr-/-Card9+/+ and n = 6 Ldlr-/-Card9-/-); Data are presented as mean values ±SD. Two-tailed Mann–Whitney test. Source data are provided as a Source Data file.
Fig. 3
Fig. 3. Card9 deficiency accelerates atherosclerosis in immunodeficient Apoe-/-Rag2-/-mice.
A Card9 mRNA expression by peritoneal macrophages isolated from male Apoe-/-Rag2-/-Card9+/+ and Apoe-/-Rag2-/-Card9-/- mice (n = 6/group). B Weight at sacrifice after 6 weeks of fat diet (3 pooled experiments, n = 16–18/group). C plasma cholesterol levels at sacrifice after 6 weeks of fat diet (3 pooled experiments, n = 14 Apoe-/-Rag2-/-Card9+/+ and n = 16 Apoe-/-Rag2-/-Card9-/-). D representative photomicrographs and quantitative analysis of atherosclerotic lesions on the thoraco-abdominal aorta of of Apoe-/-Rag2-/-Card9+/+ and Apoe-/-Rag2-/-Card9-/- mice after 6 weeks of fat diet (n = 6 Apoe-/-Rag2-/-Card9+/+ and n = 7 Apoe-/-Rag2-/-Card9-/-); E representative photomicrographs and quantitative analysis of atherosclerotic lesions in the aortic sinus of Apoe-/-Rag2-/-Card9+/+ and Apoe-/-Rag2-/-Card9-/- mice after 6 weeks of fat diet (3 experiments pooled, n = 14 Apoe-/-Rag2-/-Card9+/+ and n = 16 Apoe-/-Rag2-/-Card9-/-); Scale bar 200 μm. F representative photomicrographs and quantitative analysis of macrophage accumulation (MOMA staining, red) in atherosclerotic lesions of Apoe-/-Rag2-/-Card9+/+ and Apoe-/-Rag2-/-Card9-/- mice after 6 weeks of fat diet (3 experiments pooled, n = 14 Apoe-/-Rag2-/-Card9+/+ and n = 16 Apoe-/-Rag2-/-Card9-/-); Scale bar 100 μm. G Representative photomicrographs and quantitative analysis of acellular area (Masson’s Trichrome) of Apoe-/-Rag2-/-Card9+/+ and Apoe-/-Rag2-/-Card9-/- mice after 6 weeks of fat diet (3 experiments pooled, n = 14 Apoe-/-Rag2-/-Card9+/+ and n = 16 Apoe-/-Rag2-/-Card9-/-); Scale bar 100 μm. H Cytokine production (ELISA) by Lps/Ifnγ-stimulated splenocytes isolated from Apoe-/-Rag2-/-Card9+/+ and Apoe-/-Rag2-/-Card9-/- mice (n = 6/group). Data are presented as mean values ±SD. Two-tailed Mann–Whitney test. Source data are provided as a Source Data file.
Fig. 4
Fig. 4. Card9 deficiency increased CD36 expression in macrophages and promotes lipid uptake and foam cell formation.
A Representative photomicrographs and quantitative analysis (B) of Bodipy+ foam cells after incubation of BMDMs from Apoe-/-Card9+/+ and Apoe-/-Card9-/- mice with oxLDL during 6 and 24 h (2 pooled experiments, n = 8/group/timepoints), Scale bar 10 μm. C quantification of intracellular cholesterol content of BMDMs from Apoe-/-Card9+/+ and Apoe-/-Card9-/- mice after exposure to ox-LDL (n = 6/group/timepoint). D Quantification of intracellular cholesterol ester of BMDMs from Apoe-/-Card9+/+ and Apoe-/-Card9-/- mice after exposure to ox-LDL at 3, 6, 12, and 24 h (n = 6/group/timepoint). E Quantification of Abca1 and Abcg1 and Scarb1 mRNA expression in BMDMs from Apoe-/-Card9+/+ and Apoe-/-Card9-/- mice after stimulation with oxLDL (n = 6/group). F Quantification of cholesterol efflux in presence of ApoAI or HDL (n = 4/group). G Quantification of Mrs1 and Cd36 mRNAs in BMDMs from Apoe-/-Card9+/+ and Apoe-/-Card9-/- mice after stimulation with oxLDL (n = 6/group). H, I representative immunostaining and quantification of Cd36 expression by BMDMs from Apoe-/-Card9+/+ and Apoe-/-Card9-/- mice after 24-h stimulation with ox-LDL (n = 12 Apoe-/-Card9+/+ and n = 22 Apoe-/-Card9-/-), Scale bar 10 μm. J cytokine production by BMDMs from Apoe-/-Card9+/+ and Apoe-/-Card9-/- mice after stimulation (ELISA in the supernatant, n = 5/group) and oxLDL exposure. K, L Flow cytometry quantification of AnnexinV+ BMDMs from Apoe-/-Card9+/+ and Apoe-/-Card9-/- mice after 24-h stimulation with oxLDL (100 μmol/l; n = 5/group). M, N representative photomicrographs and quantification of TUNEL+ cells in plaques from Apoe-/-Card9+/+ and Apoe-/-Card9-/- mice (n = 10/group). Scale bar 20 μm. Data are presented as mean values ±SD. Two-tailed Mann–Whitney test. Source data are provided as a Source Data file.
Fig. 5
Fig. 5. Pro-atherogenic effects of Card9 deficiency are mediated by impaired autophagy.
A Quantitation of AMPK phosphorylation and p62 content in macrophages from from Apoe-/-Card9+/+ (n = 5) and Apoe-/-Card9-/- mice (n = 8) after exposure to oxLDL (western blot). B representative photomicrographs and quantitative analysis and of p62 (Red), LC3B (Green) content in macrophages from Apoe-/-Card9+/+ and Apoe-/-Card9-/- mice at baseline and after exposure to oxLDL (n = 48 for p62 and n = 40 for LC3B). C Quantitative analysis and representative photomicrographs of p62 accumulation (Red) in MOMA-2+ macrophages (Green) in atherosclerotic lesions of Apoe-/-Card9+/+ (n = 10) and Apoe-/-Card9-/- mice (n = 12) after 6 weeks of fat diet (2 experiments pooled); Scale bar 200 μm. D representative photomicrographs and quantitative analysis and of p62 (Red), LC3B (Green) content in ox-LDL exposed macrophages from Apoe-/-Card9+/+ and Apoe-/-Card9-/- mice treated or not with metformin (n = 48 for p62 and n = 40 for LC3B). EH characterization of atherosclerotic lesions in the aortic sinus of male Apoe-/-Card9+/+ (n = 8) and Apoe-/-Card9-/- mice (n = 7) after 6 weeks of fat diet and treated by metformin. E representative photomicrographs and quantitative analysis of atherosclerotic lesions in the aortic sinus of Apoe-/-Card9+/+ and Apoe-/-Card9-/- mice after 6 weeks of fat diet and treated by metformin; Scale bar 200 μm. F representative photomicrographs and quantitative analysis of macrophage accumulation (MOMA staining, red) in atherosclerotic lesions of Apoe-/-Card9+/+ and Apoe-/-Card9-/- mice after 6 weeks of fat diet and treated by metformin; Scale bar 100 μm. G representative photomicrographs and quantitative analysis of acellular area (Masson’s Trichrome) of Apoe-/-Card9+/+ and Apoe-/-Card9-/- mice after 6 weeks of fat diet and treated by metformin; Scale bar 100 μm. H representative photomicrographs and quantitative analysis of p62 content (Green) in plaques of Apoe-/-Card9+/+ and Apoe-/-Card9-/- mice after 6 weeks of fat diet and treated by metformin; Scale bar 100 μm. Data are presented as mean values ±SD. Two-tailed Mann–Whitney test. Source data are provided as a Source Data file.
Fig. 6
Fig. 6. Protective effects of rapamycin in vitro and in vivo.
A, B representative photomicrographs and quantitative analysis of p62 (Red), LC3B (Green) content in oxLDL-exposed macrophages from male Apoe-/-Card9+/+ and Apoe-/-Card9-/- mice treated or not with rapamycin (200 mMol) (n = 48 for p62 and n = 40 for LC3B). C quantification of intracellular cholesterol (total and ester) of BMDMs from Apoe-/-Card9+/+ and Apoe-/-Card9-/- mice after exposure to oxLDL with or without rapamycin (200 mMol) (n = 5/group). D Flow cytometry quantification of necrosis (7AAD+ Annexin V+) susceptibility of macrophages from Apoe-/-Card9+/+ and Apoe-/-Card9-/- mice after 24-h stimulation with high concentration of oxLDL (100 μmol/l) without and with rapamycin (200 mMol; n = 5/group). E representative photomicrographs and quantitative analysis of atherosclerotic lesions in the aortic sinus of Apoe-/-Card9+/+ and Apoe-/-Card9-/- mice after 6 weeks of fat diet and treated by rapamycin (n = 7/group); Scale bar 200 μm. F representative photomicrographs and quantitative analysis of macrophage accumulation (MOMA staining, red) in atherosclerotic lesions of Apoe-/-Card9+/+ and Apoe-/-Card9-/- mice after 6 weeks of fat diet and treated by rapamycin (n = 7/group; Scale bar 100 μm). G representative photomicrographs and quantitative analysis of acellular area (Masson’s Trichrome) of Apoe-/-Card9+/+ and Apoe-/-Card9-/- mice after 6 weeks of fat diet and treated by rapamycin (n = 7/group; Scale bar 100 μm). H representative photomicrographs and quantitative analysis of p62 content (green) in plaques of Apoe-/-Card9+/+ and Apoe-/-Card9-/- mice after 6 weeks of fat diet and treated by rapamycin (n = 7/group; Scale bar 100 μm.). Data are presented as mean values ±SD. Two-tailed Mann–Whitney test. Source data are provided as a Source Data file.
Fig. 7
Fig. 7. Pro-atherogenic effect of hematopoietic Card9 deficiency was abolished in the absence of Cd36.
A representative blots and quantification of AMPK phosphorylation on BM-derived macrophages from Cd36-/-Card9+/+ and Cd36-/-Card9-/- macrophages after exposure to oxLDL (n = 6/group/condition). B Quantitative analysis and representative photomicrographs of P62 accumulation in macrophages from Cd36-/-Card9+/+ and Cd36-/-Card9-/- macrophages after 8-h exposure to oxLDL, Scale bar 100 μm (n = 6/group/condition). C quantification of intracellular Cholesterol of BM-derived macrophages from Cd36-/-Card9+/+ and Cd36-/-Card9-/- mice after 3 and 6 h exposure to ox-LDL (n = 5/group/timepoint). D Flow cytometry quantification of Annexin V+ apoptotic BM-derived macrophages from Cd36-/-Card9+/+ and Cd36-/-Card9-/- mice after 24-h stimulation with high concentration of oxLDL (50 μmol/l; Baseline n = 6/group, OxLDL n = 7 Cd36-/-Card9+/+ and n = 8 Cd36-/-Card9-/-). E Cytokine production by BMDMs from Cd36-/-Card9+/+ and Cd36-/-Card9-/- mice after stimulation (ELISA in the supernatant, n = 6/group). F Cd36 mRNA expression in the spleen from Ldlr-/- mice and chimeric Ldlr-/-Cd36-/-Card9+/+ and Ldlr-/-Cd36-/-Card9-/- mice (n = 20/10/10). G Card9 mRNA expression in the spleen from Ldlr-/- mice and chimeric Ldlr-/-Cd36-/-Card9+/+ and Ldlr-/-Cd36-/-Card9-/- mice (n = 20/10/10). HK characterization of chimeric male Ldlr-/-Cd36-/-Card9+/+ (n = 10) and Ldlr-/-Cd36-/-Card9-/- mice (n = 11). H cholesterolemia in chimeric mice at sacrifice. I representative photomicrographs and quantitative analysis of atherosclerotic lesions in the aortic sinus of chimeric Ldlr-/-Cd36-/-Card9+/+ and Ldlr-/-Cd36-/-Card9-/- mice after 8 weeks of fat diet; Scale bar 200 μm. J representative photomicrographs and quantitative analysis of macrophage accumulation (MOMA staining, red) in atherosclerotic lesions of chimeric Ldlr-/-Cd36-/-Card9+/+ and Ldlr-/-Cd36-/-Card9-/- mice after 8 weeks of fat diet; Scale bar 100 μm. K Representative photomicrographs and quantitative analysis of acellular area (Masson’s Trichrome) of chimeric Ldlr-/-Cd36-/-Card9+/+ and Ldlr-/-Cd36-/-Card9-/- mice after 8 weeks of fat diet; Scale bar 100 μm. Data are presented as mean values ±SD. Two-tailed Mann–Whitney test. Source data are provided as a Source Data file.
Fig. 8
Fig. 8. CARD9 related pathways in human.
A protocol to obtain transcripts after isolation of monocytes from controls and CARD9-deficient patients. B Volcano-plot of the differentially expressed genes between monocytes from patients with CARD9 mutation and control patients. Red dots represent up-regulated genes and blue dots down-regulated genes (adjusted p-value < 0.05). C Heatmap of mean expression in each patient of the leading edge genes contributing to the enrichment of indicated pathways in the GSEA. Immunofluorescent micrograph of human healthy (D) and atherosclerotic (E) carotid artery sections stained for CARD9 (green), α-actin + smooth muscle (red) or CD68 (red) showing that CARD9 was strongly expressed by cells that engulf lipids and cholesterol crystals and of giant lipid-laden foam cells but not by smooth muscle cells. Magnitude X20 (D), X2.5 (E), X40 (E) (2 Pooled experiments, n = 6/staining). F CARD9 expression in 10,934 total human atherosclerotic coronary artery cells from 4 patients (data from Wirka et al.) with UMAP representation of single-cell RNA-seq gene expression data (left) and cellular lineage identification (right) where CARD9 expression in single cells projected onto the UMAP plot. (For clarity, expression cutoff have been applied and cells with detectable Card9/CARD9 transcripts were brought to the front of the plot).

Similar articles

Cited by

References

    1. Moore KJ, Tabas I. Macrophages in the pathogenesis of atherosclerosis. Cell. 2011;145:341–355. doi: 10.1016/j.cell.2011.04.005. - DOI - PMC - PubMed
    1. Potteaux S, Ait-Oufella H, Mallat Z. Role of splenic monocytes in atherosclerosis. Curr. Opin. Lipidol. 2015;26:457–463. doi: 10.1097/MOL.0000000000000223. - DOI - PubMed
    1. Libby P. Inflammation in atherosclerosis. Nature. 2002;420:868–874. doi: 10.1038/nature01323. - DOI - PubMed
    1. Ait-Oufella H, Taleb S, Mallat Z, Tedgui A. Recent advances on the role of cytokines in atherosclerosis. Arterioscler. Thromb. Vasc. Biol. 2011;31:969–979. doi: 10.1161/ATVBAHA.110.207415. - DOI - PubMed
    1. Robbins CS, et al. Local proliferation dominates lesional macrophage accumulation in atherosclerosis. Nat. Med. 2013;19:1166–1172. doi: 10.1038/nm.3258. - DOI - PMC - PubMed

Publication types

Supplementary concepts