. 2023 Aug 1;14(1):4619.
doi: 10.1038/s41467-023-40357-z.

Sequential roles for red blood cell binding proteins enable phased commitment to invasion for malaria parasites

Affiliations

Sequential roles for red blood cell binding proteins enable phased commitment to invasion for malaria parasites

Melissa N Hart et al. Nat Commun. .

Abstract

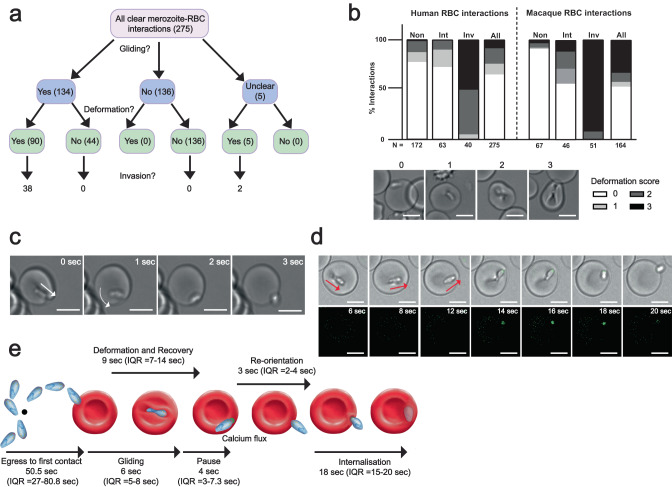
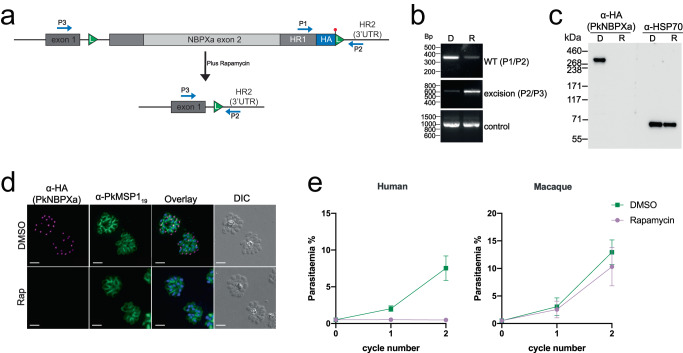
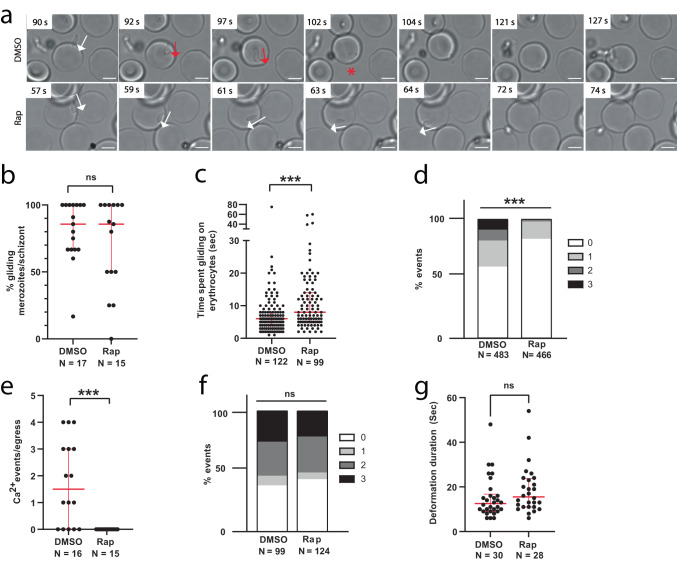
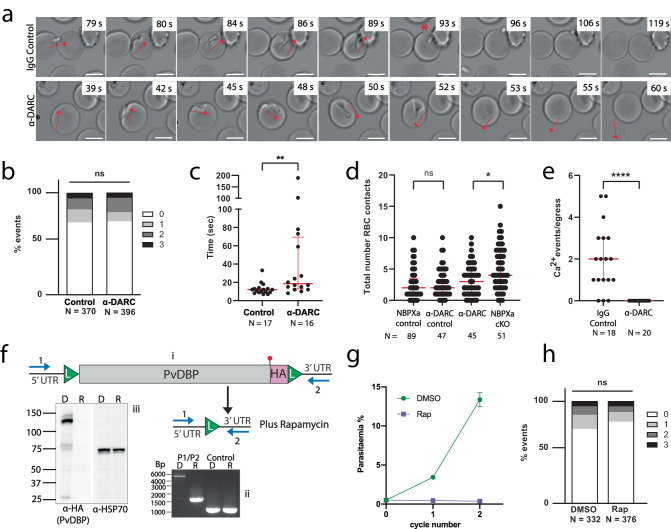
Invasion of red blood cells (RBCs) by Plasmodium merozoites is critical to their continued survival within the host. Two major protein families, the Duffy binding-like proteins (DBPs/EBAs) and the reticulocyte binding like proteins (RBLs/RHs) have been studied extensively in P. falciparum and are hypothesized to have overlapping, but critical roles just prior to host cell entry. The zoonotic malaria parasite, P. knowlesi, has larger invasive merozoites and contains a smaller, less redundant, DBP and RBL repertoire than P. falciparum. One DBP (DBPα) and one RBL, normocyte binding protein Xa (NBPXa) are essential for invasion of human RBCs. Taking advantage of the unique biological features of P. knowlesi and iterative CRISPR-Cas9 genome editing, we determine the precise order of key invasion milestones and demonstrate distinct roles for each family. These distinct roles support a mechanism for phased commitment to invasion and can be targeted synergistically with invasion inhibitory antibodies.


Conflict of interest statement

The authors declare no competing interests.

Figures

Fig. 1
Fig. 1. P. knowlesi as a model to delineate steps of RBC invasion.
a Flow chart shows outcomes of all merozoite-human RBC interactions from 20 schizonts, 0–200 s post egress. ‘Interaction’ = RBC contact lasting ≥2 s. Gliding interaction = forward movement across RBC surface ≥5 s. Events per category indicated in parentheses. b RBC deformation scores for human (left) or macaque (right) interactions based on extent of merozoite indentation/wrapping. 0 = no deformation; 1 = shallow indentation/membrane pinching; 2 = deeper indentation to the side of RBC/intermediate level of host cell membrane pinching around parasite; 3 = full host cell wrapping around merozoite. Bar chart indicates a breakdown of deformation scores for interactions from merozoites which never invade (non), intermediate interactions from merozoites that will invade on subsequent contacts (‘Int’), interactions leading directly to invasion (Inv), and all merozoite-RBC interaction (all). c Supplementary movie 1 stills. Panel 1 shows RBC recovering from deformation and merozoite’s apical end firmly attached to the RBC membrane. White arrow tip indicates merozoite apex. Panels 2-4 show the merozoite pivoting on apical end (white curved arrow), until re-orientation is complete. d Supplementary movie 3 stills. Pk merozoite displays a fluorescent signal between apex and Fluo-4-AM loaded RBC as gliding (red arrows = direction) comes to a pause (panel 4), but before re-orientation begins (panel 6). e Summary schematic depicting order and timings of each step of invasion. For all images, scale bars = 5 μm. Source data for (b) and (e) are provided as a Source Data file.
Fig. 2
Fig. 2. Efficient Rapamycin-induced excision of floxed NBPXa.
a Schematic depicting excision of 8.5kbp fragment between LoxP sites (L) upon Rapamycin (Rap) treatment of NBPXa cKO parasites. Diagnostic primer positions noted in blue (P1, P2, P3). b Diagnostic PCRs showing outcome of DMSO (D) or Rap (R) treatment of NBPXa cKO parasites. Primers P1/P2 identified non-excised parasites, P2/P3 detected successful excision and control bands amplify an unrelated locus. c Western blot showing loss of ~325 kDa HA tagged NBPXa in Rap treated parasites. Anti-PfHSP70 used as a loading control. d IFAs showing ablation of NBPXa expression for Rap treated parasites. Parasites labelled with a rat anti-HA and rabbit anti-MSP119 as a marker for mature, segmented schizonts. Scale bars = 5 μm. e Growth of NBPXa cKO parasites in human (left) or macaque (right) RBCs measured at 24 and 48 h after treatment with Rap or DMSO. Data shown are the mean of 5 independent experiments for human and 2 experiments for macaque cells. Error bars +/- SEM. Source data for (b) and (c) and (e) are provided as a Source Data file.
Fig. 3
Fig. 3. NBPXa is required for human RBC deformation.
a Live stills from Supplementary movie 5 showing DMSO vs. Rap treated NBPXa cKO merozoites interacting with human RBCs. White arrows indicate gliding motility without deformation. Red arrows indicate gliding motility with deformation. Red * = merozoite re-orientating for host cell entry. Scale bars = 2.5 μm. Interactions of DMSO vs. Rap treated NBPXa cKO merozoites with human RBCs were observed to compare (b) the % gliding merozoites per schizont (two-tailed Mann-Whitney U-test; p = 0.53). For DMSO, median = 86% and IQR = 33%; for Rap median = 86% and IQR = 50%. c The length of gliding interactions (two-tailed Mann-Whitney U-test; p < 0.0001) between DMSO (median = 6 s and IQR = 4 s) and Rap (median = 8 s and IQR = 9 s) treated parasites (d) the proportion of strength 0-3 merozoite/RBC interaction events (chi-squared test; p < 0.0001) and (e) the number of Ca2+ events seen per egress when merozoites interact with Fluo-4-AM loaded RBCs (two-tailed Mann-Whitney U-test; p < 0.0001). For DMSO, median = 1.5 events/egress and IQR = 3 events/egress. For Rap, median and IQR = 0 events/egress. Invasion dynamics of the same lines with macaque RBCs were observed to compare (f) the proportion of strength 0-3 merozoite/RBC interaction events (chi-squared test; p = 0.72) and (g) length of time merozoites spent deforming RBCs prior to internalisation (two-tailed Mann-Whitney U-test; p = 0.10). For DMSO, median = 12.5 s and IQR = 7.75 s. For Rap, median = 15.5 s and IQR = 12.75 s). For all graphs, number of events (N) indicated underneath. For all graphs, thick red bars indicate the medians and thinner red bars indicate interquartile ranges. ns = non-significant. Source data for (bg) are provided as a Source Data file.
Fig. 4
Fig. 4. DBPα is required downstream of deformation.
a Panels from Supplementary movie 6 showing merozoite-RBC interactions with 5 µg/ml IgG control (top) or anti-DARC (bottom). Red arrows indicate direction of gliding and deformation. Red * indicates onset of re-orientation and invasion. Scale bars = 5 μm. Invasion dynamics of merozoites with human RBCs in presence of IgG control or anti-DARC were quantified to compare (b) the proportion of strength 0-3 merozoite/RBC interaction events (chi-squared test; p = 0.19) and (c) duration of each score 3 deformation event (two-tailed Mann-Whitney U-test; p = 0.003). DMSO median = 12 s and IQR = 4.5 s; Rap median = 18.5 s and IQR = 56.75 s. d Comparison of total number of RBC contacts made by NBPXa null vs anti-DARC blocked merozoites and controls over 2 min window post egress (two-tailed Mann-Whitney U-test; p = 0.016 for anti-DARC vs NBPXa null. P = 0.22 for NBPXa control vs anti-DARC control. NBPXa control median = 2 s and IQR = 2.5 s; NBPXa null median = 4 s and IQR = 6 s; anti-DARC control median = 2 s and IQR = 3 s; anti-DARC median = 3 s and IQR = 4 s. e Number of Ca2+ events (per egress) seen when merozoites interact with Fluo-4-AM loaded RBCs with α-DARC (median and IQR = 0 events) vs IgG control (median = 2 events and IQR = 2 events) (two-tailed Mann-Whitney U-test; p < 0.0001). f Schematic (i) shows excision of PvDBP flanked by LoxP sites (L) upon Rap treatment of PvDBP cKO parasites. Diagnostic primer positions noted in blue (P1, P2) produce band shift of 4950 bp (non-excised parasites) to 1670 bp in PCRs (ii), with no change in unrelated control locus. Western blots (iii) probed with HA antibody detect ~120 kDa PvDBP-HA in DMSO (D) but not Rap (R) treated parasites. Loading control = anti-PfHSP70. g Growth of PvDBP cKO parasites in human RBCs measured at 24 and 48 h after treatment with either Rap or DMSO. Data mean of 3 independent experiments; error bars +/- SEM. h Comparison of strength 0-3 merozoite-RBC interaction events between Rap vs DMSO treated PvDBP cKO parasites (chi-squared test; p = 0.11). For all graphs red bars indicated median + IQR, ns = non-significant. Number of events analysed (N) indicated under each graph. Source data for (bh) are provided as a Source Data file.
Fig. 5
Fig. 5. NBPXa and DBPα are closely localised prior to egress but exhibit distinct localisations upon secretion.
a Image of mNeonGreen (mNG) tagged NBPXa and DBPα schizonts. Scale bars = 5 μm. b Immunofluorescence assay showing HA tagged NBPXa, AMA-1, and RON2 (red), detected in schizonts using an anti-HA antibody. DBPα-mNG detected in same parasites (green) with an anti-mNG antibody. White boxes depict regions enlarged for ‘inset’ panels. c Extended depth of focus images of NBPXa-mNG and DBPα-mNG in post egress merozoites. Scale bars for (b) and (c) = 2 μm.
Fig. 6
Fig. 6. NBPXa and DBPα are secreted gradually and continuously post egress.
Live stills depicting NBPXa (a) or DBPα (b) secretion over a period of 3 min post egress. Secretion monitored by comparing the peak fluorescence intensity of the merozoite’s apical end, to the peak intensity at any point along its body (FR). Merozoite cartoons depict fluorescence pattern of each. NBPXa-mNG (c) or DBPα-mNG (d) FR values plotted over time +/- RBCs present. e NBPXa-mNG secretion with RBCs +/- anti-DARC antibody (f) DBPα-mNG secretion with RBCs and +/- NBPXa. For C-F, measurements were recorded every 30 s after egress (±5 s either side) for all merozoites from a given schizont that were in focus at each timepoint. Each dot represents the average FR value/schizont at a given timepoint. Error bars indicate ±SEM. FR values were fitted using non-linear regression and comparisons between curves were made using an extra sum-of-squares F-test; p values and number of schizonts (n) analysed for each group noted on graphs. Scale bars for (a) and (b) = 2 μm. Source data for (cf) are provided as a Source Data file.
Fig. 7
Fig. 7. NBPXa acts prior to moving junction formation and can be synergistically targeted with DBP.
a IFAs of Pk merozoites stalled mid-invasion with cyto D. Top panels depict AMA1-mNG + NBPXa-HA. Bottom panels depict DBPα-mNG + AMA1-HA. Overlays stained with wheatgerm agglutinin (Magenta). Scale bars = 2 μm. b Processed NBPXa is detected by western blot in culture supernatants (S) when egressing merozoites are allowed to re-invade fresh RBCs and (c) when invasion is blocked with anti-DARC (α-D). Cont = control IgG. For all blots, NBPXa was detected with rat anti-HA (targeting C-term) and/or rabbit anti-NBPXa raised against the NBPXa N-terminus (amino acids 151-467). Anti-PfHSP70 used as loading control. P = pellet fraction. Green region in schematic shows transmembrane domain, * indicates putative ROM4 cleavage site. d Clustal alignment of several predicted RBL/DBP transmembrane domains. All contain a conserved alanine residue (red box), followed by putative helix destabilising motifs underlined in blue, which may serve as ROM4 recognition sites. All sequences apart from NBPXa from Baker et al. & O’Donnell et al.. The experimentally determined PfEBA-175 cleavage position is indicated with black arrow. (O’Donnell et al.). Parasite growth inhibition activity of anti-NBPXa (e) and anti-DB10 (f) was assessed individually and in combination (e) using fixed DB10 concentration with increasing anti-NBPXa concentrations Results calculated from two independent experiments. Error bars indicate ±SEM. Source data for (b), (c), (e) and (f) are provided as a Source Data file.
Fig. 8
Fig. 8. A model of how RBL and DBP ligands mediate phased commitment to invasion.
Both in the absence of NBPXa and when host cells lack appropriate RBL receptor(s), Pk merozoites contact a greater number of RBCs overall, increasing their chances of interacting with a suitable RBC. In contrast, DBP null merozoites, or WT parasites contacting Duffy negative host cells, form semi-committed interactions, thereby reducing their chances of contacting a suitable host cell.

References

    1. Ansari HR, et al. Genome-scale comparison of expanded gene families in Plasmodium ovale wallikeri and Plasmodium ovale curtisi with Plasmodium malariae and with other Plasmodium species. Int J. Parasitol. 2016;46:685–696. - PubMed
    1. Dvorak JA, Miller LH, Whitehouse WC, Shiroishi T. Invasion of erythrocytes by malaria merozoites. Science. 1975;187:748–750. - PubMed
    1. Gilson PR, Crabb BS. Morphology and kinetics of the three distinct phases of red blood cell invasion by Plasmodium falciparum merozoites. Int J. Parasitol. 2009;39:91–96. - PubMed
    1. Weiss GE, et al. Revealing the Sequence and Resulting Cellular Morphology of Receptor-Ligand Interactions during Plasmodium falciparum Invasion of Erythrocytes. PLoS Pathog. 2015;11:1–25. - PMC - PubMed
    1. Perrin AJ, et al. The actinomyosin motor drives malaria parasite red blood cell invasion but not egress. MBio. 2018;9:1–13. - PMC - PubMed

Publication types