

Impact of climate extreme events and their causality on maize yield in South Africa
- PMID: 37528122
- PMCID: PMC10393995
- DOI: 10.1038/s41598-023-38921-0
Impact of climate extreme events and their causality on maize yield in South Africa
Abstract
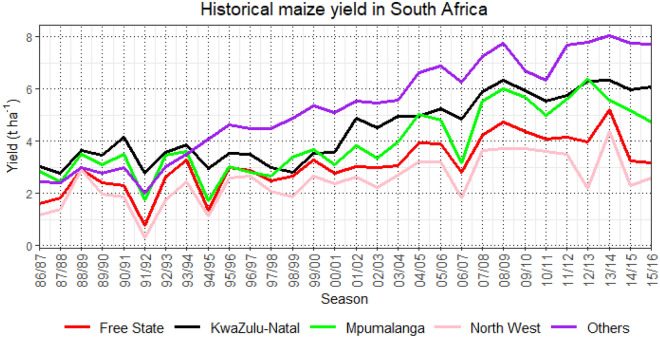
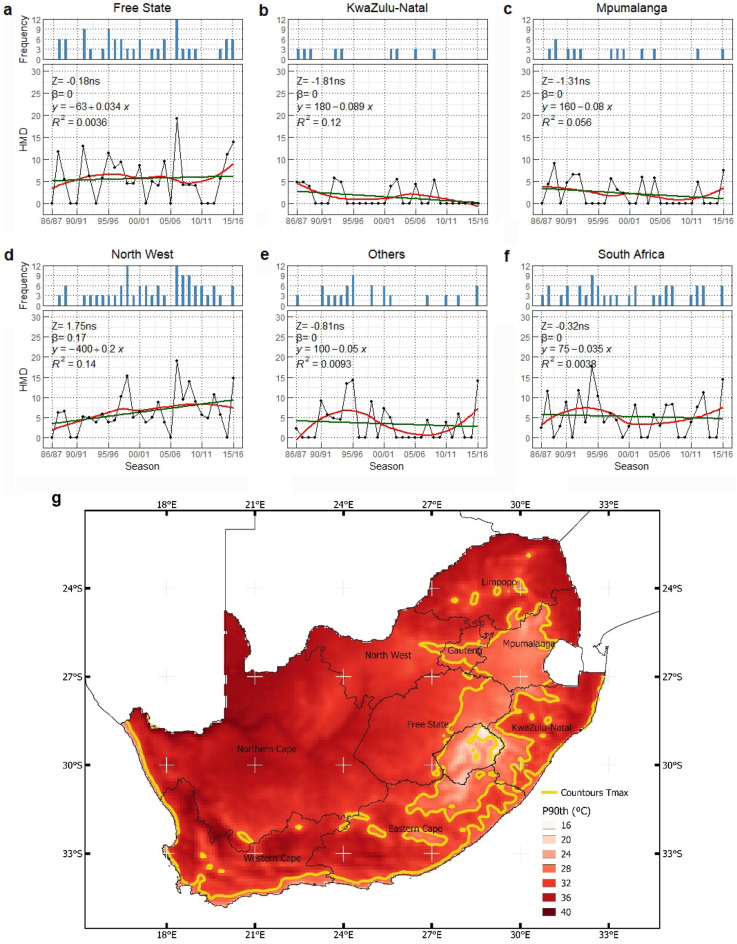
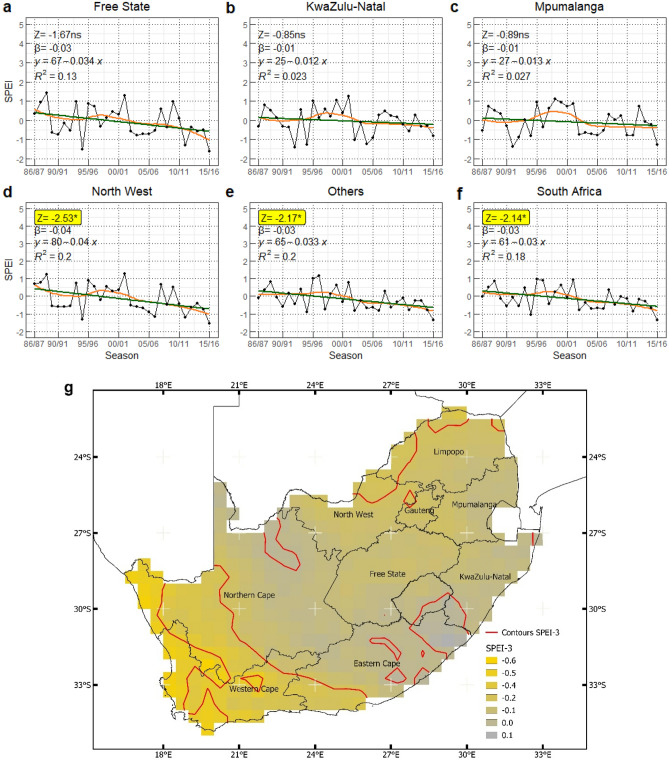
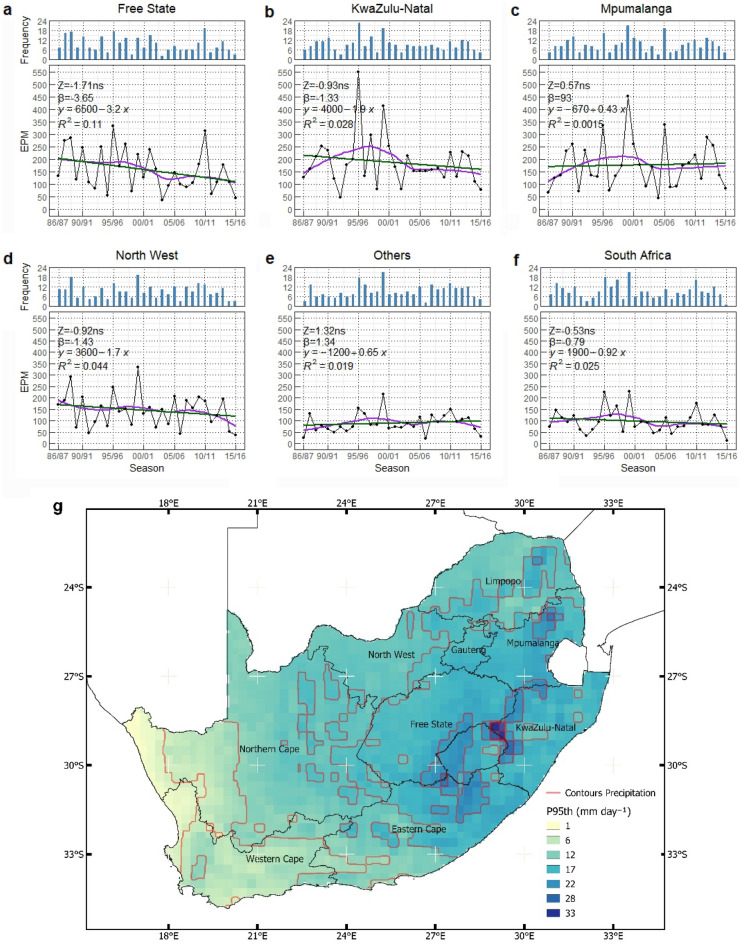
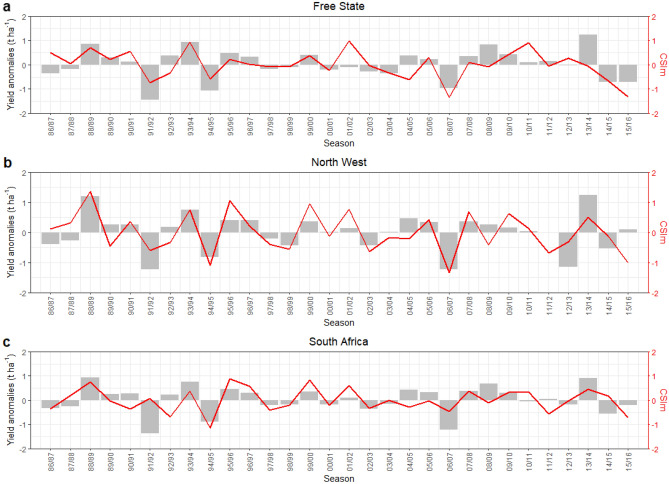
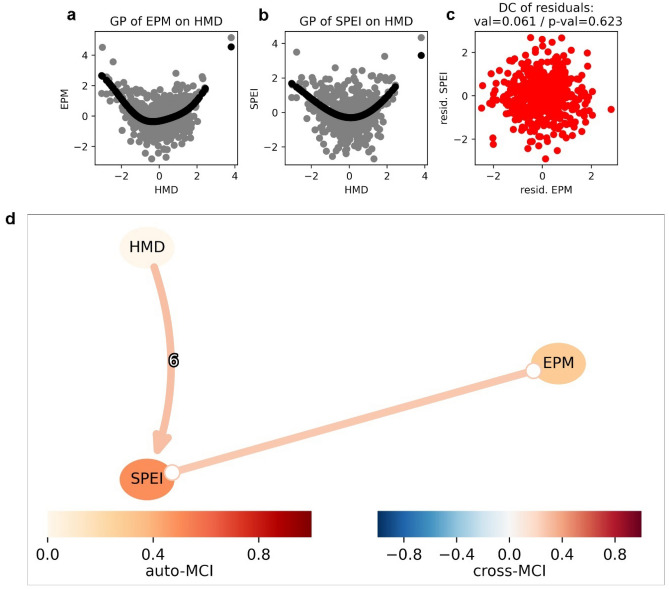
Extreme climate events can have a significant negative impact on maize productivity, resulting in food scarcity and socioeconomic losses. Thus, quantifying their effect is needed for developing future adaptation and mitigation strategies, especially for countries relying on maize as a staple crop, such as South Africa. While several studies have analyzed the impact of climate extremes on maize yields in South Africa, little is known on the quantitative contribution of combined extreme events to maize yield variability and the causality link of extreme events. This study uses existing stress indices to investigate temporal and spatial patterns of heatwaves, drought, and extreme precipitation during maize growing season between 1986/87 and 2015/16 for South Africa provinces and at national level and quantifies their contribution to yield variability. A causal discovery algorithm was applied to investigate the causal relationship among extreme events. At the province and national levels, heatwaves and extreme precipitation showed no significant trend. However, drought severity increased in several provinces. The modified Combined Stress Index (CSIm) model showed that the maize yield nationwide was associated with drought events (explaining 25% of maize yield variability). Heatwaves has significant influence on maize yield variability (35%) in Free State. In North West province, the maize yield variability (46%) was sensitive to the combination of drought and extreme precipitation. The causal analysis suggests that the occurrence of heatwaves intensified drought, while a causal link between heatwaves and extreme precipitation was not detected. The presented findings provide a deeper insight into the sensitivity of yield data to climate extremes and serve as a basis for future studies on maize yield anomalies.
© 2023. The Author(s).
Conflict of interest statement
The authors declare no competing interests.
Figures
References
-
- IPCC . Managing the Risks of Extreme Events and Disasters to Advance Climate Change Adaptation: Special Report of the Intergovernmental Panel on Climate Change. Cambridge University Press; 2012. - PubMed
-
- UN. How Certain are the United Nations Global Population Projections? (United Nations Department of Economic and Social Affairs, 2019).
-
- Shiferaw B, Prasanna BM, Hellin J, Bänziger M. Crops that feed the world 6. Past successes and future challenges to the role played by maize in global food security. Food Security. 2011;3:307. doi: 10.1007/s12571-011-0140-5. - DOI
-
- FAOSTAT statistical database (FAO, 1997).
-
- Erenstein O, Chamberlin J, Sonder K. Estimating the global number and distribution of maize and wheat farms. Glob. Food Security. 2021;30:100558. doi: 10.1016/j.gfs.2021.100558. - DOI
Publication types
MeSH terms
LinkOut - more resources
Full Text Sources
Medical
