. 2023 Aug 1;13(1):12494.
doi: 10.1038/s41598-023-39784-1.

Identification of INHBA as a potential biomarker for gastric cancer through a comprehensive analysis

Affiliations

Identification of INHBA as a potential biomarker for gastric cancer through a comprehensive analysis

Fang Liu et al. Sci Rep. .

Abstract

Inhibin subunit beta A (INHBA) is a member of the transforming growth factor-beta (TGF-β) superfamily that plays a fundamental role in various cancers. However, a systematic analysis of the exact role of INHBA in patients with gastric cancer (GC) has not yet been conducted. We evaluated the expression levels of INHBA and the correlation between INHBA and GC prognosis in GC. The relationship between INHBA expression, immune infiltration levels, and type markers of immune cells in GC was also explored. In addition, we studied INHBA mutations, promoter methylation, and functional enrichment analysis. Besides, high expression levels of INHBA in GC were significantly related to unfavorable prognosis. INHBA was negatively correlated with B cell infiltration, but positively correlated with macrophage and most anticancer immunity steps. INHBA expression was positively correlated with the type markers of CD8+ T cells, neutrophils, macrophages, and dendritic cells. INHBA has a weak significant methylation level change between tumor and normal tissues and mainly enriched in cancer-related signaling pathways. The present study implies that INHBA may serve as a potential biomarker for predicting the prognosis of patients with GC. INHBA is a promising predictor of immunotherapy response, with higher levels of INHBA indicating greater sensitivity.


Conflict of interest statement

The authors declare no competing interests.

Figures
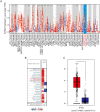
Figure 1
Figure 1
INHBA expression levels in different human cancers. (A) The Diff Exp module was used to analyze the expression of INHBA in all tumor samples and normal tissues in TIMER database. https://cistrome.shinyapps.io/timer/. (B) Change in INHBA expression levels in datasets of different cancers, as compared to those in normal tissues, as determined using Oncomine database. (C) The expression level of INHBA in GC tumor tissues and paired normal tissues, as determined using GEPIA database. *P < 0.05; **P < 0.01; ***P < 0.001, and NS: P > 0.05. http://gepia2.cancer-pku.cn/#general.
Figure 2
Figure 2
Relative expression levels of INHBA in the GC tissues, as compared to those in non-cancerous tissues, in ten cohorts, as determined using Oncomine and GEO databases. *P < 0.05; **P < 0.01, and ***P < 0.001. (AG) Oncomine database. (HJ) GEO database. https://www.ncbi.nlm.nih.gov/geo/tools/profileGraph.cgi?ID=GDS1210:X57579_s_at.
Figure 3
Figure 3
UALCAN database was used to evaluate the expression of INHBA in different tumor subgroups. Boxplot showed the relative expression level of INHBA in the subgroup of patients with gastric cancer (UALCAN). https://ualcan.path.uab.edu/cgi-bin/Pan-cancer-CPTAC.pl?genenam=INHBA (A) Comparison of the transcriptional expression level of INHBA between gastric cancer (GC) tissues and non-cancerous tissues. https://ualcan.path.uab.edu/cgi-bin/Pan-cancer-CPTAC.pl?genenam=INHBA (BJ) Boxplot showing correlation of tumor stage, grade, nodal metastasis status, gender, TP53 mutation status, race, age, historical subtype, and HPV status with INHBA expression in GC. (N0: No regional lymph node metastasis; N1: metastases in 1 to 3 axillary lymph nodes; N2: metastases in 4 to 9 axillary lymph nodes; N3: metastases in 10 or more axillary lymph nodes. *P < 0.05; **P < 0.01; ***P < 0.001, and NS: P > 0.05.
Figure 4
Figure 4
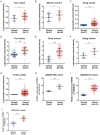
The Oncomine database was used to determine protein and mRNA expression in pairs of gastric and normal gastric tissues. (AC) Comparison of INHBA protein expression in 62 paired normal gastric tissues and gastric cancer tissues. (D) Relative mRNA expression of INHBA in 65 paired normal gastric tissues and cancer tissues. ***P < 0.001.
Figure 5
Figure 5
Based on the data of Cho GC, DErrico GC, Deng GC, Cui GC, Chen GC, TCGA GC, Wang GC, GSE81948 https://www.ncbi.nlm.nih.gov/geo/query/acc.cgi?acc=GSE81948, GSE54129 https://www.ncbi.nlm.nih.gov/geo/query/acc.cgi?acc=GSE54129, GSE13911 https://www.ncbi.nlm.nih.gov/geo/query/acc.cgi?acc=GSE13911 data sets, using the pROC package in R software, ROC curves of INHBA were drawn to distinguish GC patients from healthy individuals.
Figure 6
Figure 6
Correlation of INHBA expression with survival analysis in gastric cancer. Kaplan–Meier plotter was applied to evaluate the prognostic value of INHBA. Survival analysis in patients within gender, HER2 status, and Lauren classification subgroups. (AF) Correlation of INHBA expression with overall survival (OS), first progression survival (FPS), and post-progression survival (PPS). (GI) In terms of sex subtypes, the correlation of INHBA expression with OS, FPS and PPS. (JL) In terms of HER2 status subtypes, the correlation of INHBA expression with OS, FPS and PPS. (MO) In terms of Lauren classification subtypes, the correlation of INHBA expression with OS, FPS and PPS. https://kmplot.com/analysis/index.php?p=service.
Figure 7
Figure 7
Correlation between immune infiltrates and INHBA expression in B cells, CD4+ T cells, CD8+ T cells, neutrophils, macrophages, and dendritic cells of GC (TIMER). (A) Correlation between INHBA expression and abundance of immune infiltrates. (B) Clinical outcomes and abundance of immune infiltrates of INHBA expression. (C) Correlation between abundance of immune infiltrates and somatic copy number alterations of INHBA in GC. *P < 0.05; **P < 0.01, and ***P < 0.001. https://cistrome.shinyapps.io/timer/.
Figure 8
Figure 8
Comparison of Kaplan–Meier curves for high and low expression of INHBA in GC, based on immune cells subgroup. https://kmplot.com/analysis/index.php?p=service (AD) Relationship between INHBA expression of different immune cell subgroups and overall survival in STAD. (EH) Relationship between INHBA expression of different immune cell subgroups and relapse-free survival in STAD. *P < 0.05; **P < 0.01, and NS: P > 0.05.
Figure 9
Figure 9
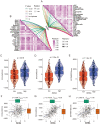
Correlation between INHBA expression and the TME in GC. (A) Correlation of INHBA expression and tumor-infiltrating immune cells. (B) Correlation of INHBA expression and the steps of the cancer immunity cycle. (CE) Comparison of ImmuneScore, StromalScore, and ESTIMATEScore between high and low INHBA groups. (FH) Correlation of INHBA expression and ImmuneScore, StromalScore, and ESTIMATEScore.
Figure 10
Figure 10
Potential therapeutic drugs for GC patients with high INHBA expression. (AB) Results for Spearman’s correlation and differential drug-response analyses of four CTRP-obtained compounds. (CD) Results for Spearman’s correlation and differential drug-response analyses of six PRISM-obtained compounds. Note: Lower estimated AUC indicates greater drug sensitivity. *P < 0.05; **P < 0.01, and ***P < 0.001.
Figure 11
Figure 11
Visual summary of INHBA alterations in gastric cancer (Cbioportal databases and TCGA). (A) OncoPrint of INHBA genetic alterations in GC. (B) The genetic alteration type and frequency of INHBA were studied in various GC samples. (C) Kaplan–Meier analysis of the effect of INHBA disorder on overall survival. (D) Kaplan–Meier analysis of the effect of INHBA disorder on progression-free survival.
Figure 12
Figure 12
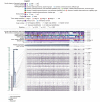
Visualization of the TCGA data for INHBA in gastric cancer using MEXPRESS database; the samples were arranged in order of their expression value. The view shows the correlation between INHBA expression and promoter region, clinical features, and CNVs, with the Pearson correlation coefficients on the right side. The height of the dark green line represents the INHBA expression value (normalized RNASeqV2 in TCGA) and the beta value for the Infinium 450 k probes.
Figure 13
Figure 13
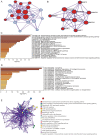
Protein–protein interaction network and functional enrichment analyses for INHBA (Metascape database). https://metascape.org/gp/index.html#/reportfinal/tyqpswf7z (AB) Protein–protein interaction network and MCODE components identified in the gene lists. (CD) Bar graph of enriched terms, colored based on P-values. (E) Network of enriched terms, colored by cluster ID, where nodes that share the same cluster ID are typically close to each other.
Figure 14
Figure 14
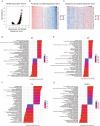
Genes differentially expressed with respect to INHBA in gastric cancer and the corresponding functional enrichment analysis (LinkedOmics database). https://gdac.broadinstitute.org/runs/stddata__2016_01_28/data/STAD/20160128/. (A) Volcano plot of correlation between INHBA and genes differentially expressed in GC, as assessed using T-test. (BC) Heatmaps showing genes positively and negatively correlated with respect to INHBA in GC. Positively correlated genes have been indicated in red, while negatively correlated genes have been indicated in blue. (D) Biological processes. (E) Molecular function. (F) Cellular components. (G) KEGG pathway analysis. http://www.kegg.jp/kegg/kegg1.html.
Figure 15
Figure 15
Single-cell data analysis based on 26 gastric cancer patients from GSE183904. (A) All cells from gastric cancer tissue were classified into 26 clusters. (B) The cell types were identified by tissue type-specific canonical markers defined in the literature. (C) The violin plot shows that INHBA is more highly expressed in fibroblast and pericyte than in other cell clusters.
Figure 16
Figure 16
shINHBA inhibits migration and proliferation abilities of GC cells. (A) The expression level of GC MGC-823 after transfection with INHBA was determined by PCR. (B) CCK 8 growth curve to evaluate GC MGC-823 proliferation in the blank, control and transfection groups. (C) Migration distance of GC MGC-823 transfected with INHBA. (D) Images of cell migration in each group tested by scratch test.

Similar articles

Cited by

References

    1. Cavatorta O, et al. Epidemiology of gastric cancer and risk factors. Acta Biomed. 2018;89:82–87. doi: 10.23750/abm.v89i8-S.7966. - DOI - PMC - PubMed
    1. Bray F, et al. Global cancer statistics 2018: GLOBOCAN estimates of incidence and mortality worldwide for 36 cancers in 185 countries. CA Cancer J. Clin. 2018;68:394–424. doi: 10.3322/caac.21492. - DOI - PubMed
    1. Tan, P. & Yeoh, K. G. Genetics and molecular pathogenesis of gastric adenocarcinoma. Gastroenterology149, 1153–1162e1153. 10.1053/j.gastro.2015.05.059 (2015). - PubMed
    1. Kohzadi S, et al. Evaluation of trace element concentration in cancerous and non-cancerous tissues of human stomach. Chemosphere. 2017;184:747–752. doi: 10.1016/j.chemosphere.2017.06.071. - DOI - PubMed
    1. Dong XZ, et al. LncRNA COL1A1-014 is involved in the progression of gastric cancer via regulating CXCL12-CXCR4 axis. Gastr. Cancer. 2019 doi: 10.1007/s10120-019-01011-0. - DOI - PubMed

Publication types

Substances