. 2023 Aug 1;14(1):28.
doi: 10.1186/s13229-023-00557-2.

Shank3 deletion in PV neurons is associated with abnormal behaviors and neuronal functions that are rescued by increasing GABAergic signaling

Affiliations

Shank3 deletion in PV neurons is associated with abnormal behaviors and neuronal functions that are rescued by increasing GABAergic signaling

Jessica Pagano et al. Mol Autism. .

Abstract

Background: Phelan-McDermid syndrome (PMS) is a neurodevelopmental disorder characterized by developmental delay, intellectual disability, and autistic-like behaviors and is primarily caused by haploinsufficiency of SHANK3 gene. Currently, there is no specific treatment for PMS, highlighting the need for a better understanding of SHANK3 functions and the underlying pathophysiological mechanisms in the brain. We hypothesize that SHANK3 haploinsufficiency may lead to alterations in the inhibitory system, which could be linked to the excitatory/inhibitory imbalance observed in models of autism spectrum disorder (ASD). Investigation of these neuropathological features may shed light on the pathogenesis of PMS and potential therapeutic interventions.

Methods: We recorded local field potentials and visual evoked responses in the visual cortex of Shank3∆11-/- mice. Then, to understand the impact of Shank3 in inhibitory neurons, we generated Pv-cre+/- Shank3Fl/Wt conditional mice, in which Shank3 was deleted in parvalbumin-positive neurons. We characterized the phenotype of this murine model and we compared this phenotype before and after ganaxolone administration.

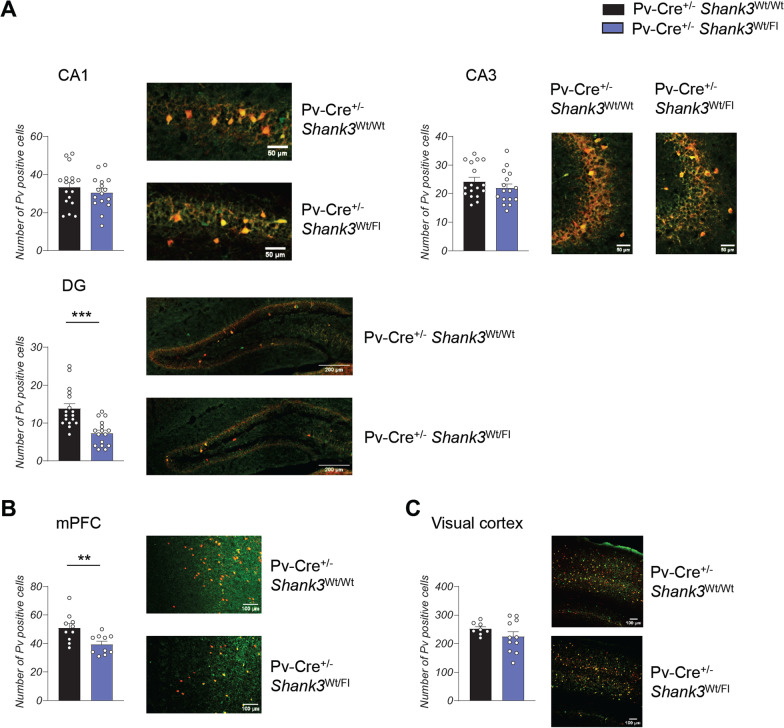
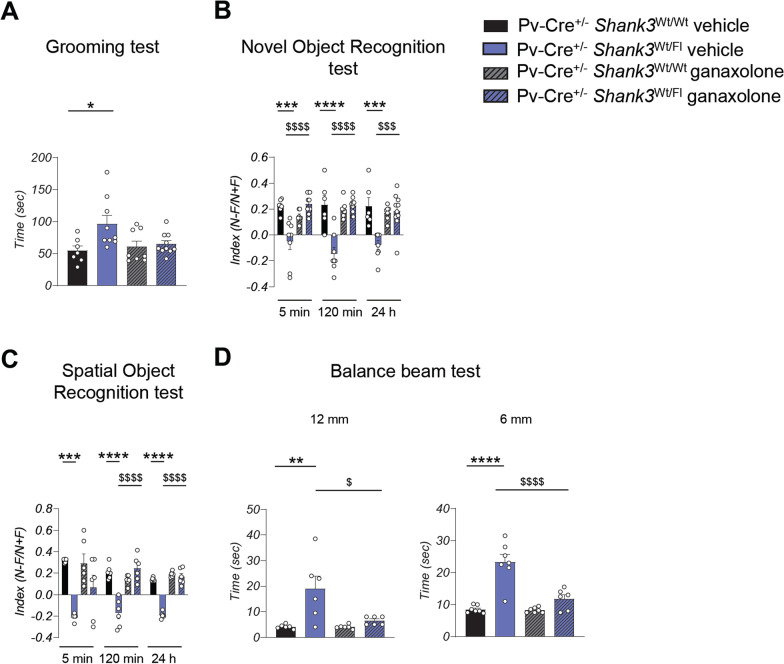
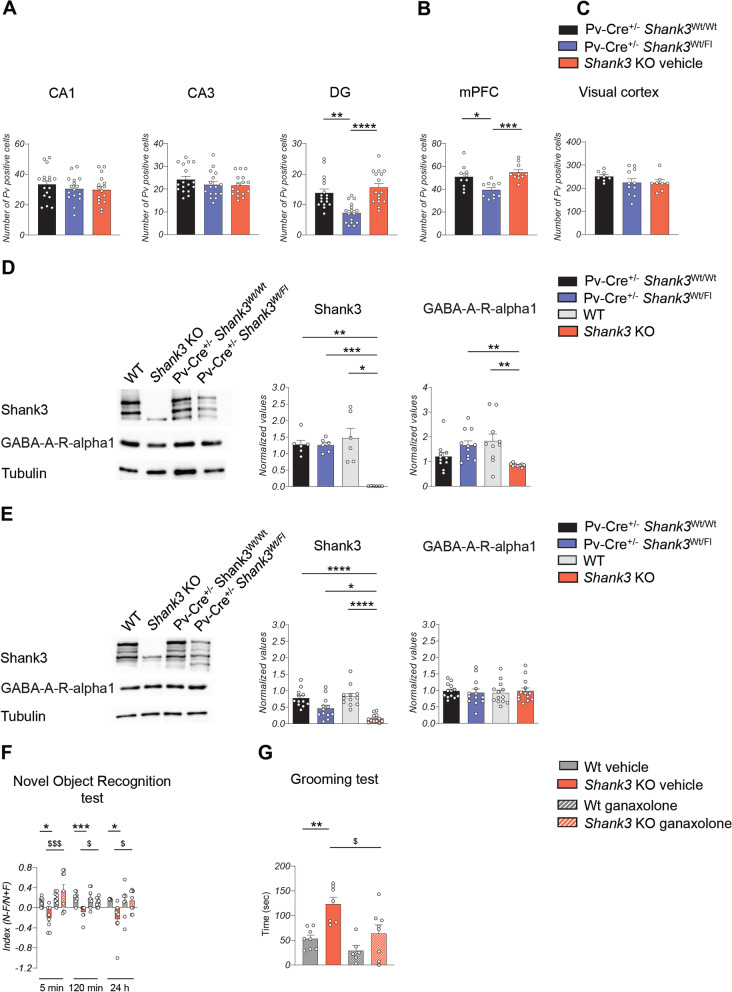
Results: We found, in the primary visual cortex, an alteration of the gain control of Shank3 KO compared with Wt mice, indicating a deficit of inhibition on pyramidal neurons. This alteration was rescued after the potentiation of GABAA receptor activity by Midazolam. Behavioral analysis showed an impairment in grooming, memory, and motor coordination of Pv-cre+/- Shank3Fl/Wt compared with Pv-cre+/- Shank3Wt/Wt mice. These deficits were rescued with ganaxolone, a positive modulator of GABAA receptors. Furthermore, we demonstrated that treatment with ganaxolone also ameliorated evocative memory deficits and repetitive behavior of Shank3 KO mice.

Limitations: Despite the significant findings of our study, some limitations remain. Firstly, the neurobiological mechanisms underlying the link between Shank3 deletion in PV neurons and behavioral alterations need further investigation. Additionally, the impact of Shank3 on other classes of inhibitory neurons requires further exploration. Finally, the pharmacological activity of ganaxolone needs further characterization to improve our understanding of its potential therapeutic effects.

Conclusions: Our study provides evidence that Shank3 deletion leads to an alteration in inhibitory feedback on cortical pyramidal neurons, resulting in cortical hyperexcitability and ASD-like behavioral problems. Specifically, cell type-specific deletion of Shank3 in PV neurons was associated with these behavioral deficits. Our findings suggest that ganaxolone may be a potential pharmacological approach for treating PMS, as it was able to rescue the behavioral deficits in Shank3 KO mice. Overall, our study highlights the importance of investigating the role of inhibitory neurons and potential therapeutic interventions in neurodevelopmental disorders such as PMS.

Keywords: Autism; GABAA receptor; Ganaxolone; Hyperexcitability.


Conflict of interest statement

The authors declare no competing financial interest.

Figures

Fig. 1
Fig. 1
Shank3 KO mice are hyperexcitable and show an altered gain control. A left: Representative electrophysiological traces of up and down states in Wt (black, top) and Shank3 KO (red, bottom) anesthetized mice with the respective spectrograms. USs are indicated with a bar. Scale bar 0.2 mV, 0.5 s. Color map for spectrograms: -80, -20 dB. Middle: Analysis of slow-wave activity in the same experimental groups shows increased duration of USs in Shank3 KO mice (Wt, N = 14 mice, n = 40 traces; Shank3 KO, N = 11 mice, n = 31 traces; Mann–Whitney Test, *p < 0.05), where up and down states were identified automatically by selecting power in gamma band. Right: US 25-80 Hz RMS Power is significantly different (Mann–Whitney Test, *p < 0.05). B top: Mean power spectra of LFP in anesthetized mice. Lines indicate the mean power spectra and the shaded areas indicate the SEM (N = 14 Wt, N = 11 Shank3 KO). Bottom, difference between Shank3 KO and Wt average power spectra. Shank3 KO mice are not openly epileptic; however, spectral analysis of the resting state under urethane anesthesia shows increased spectral power at all frequencies between a few Hz to about 100 Hz; in particular, there is a diffused increase in the beta (10–25 Hz) and gamma frequency band (25-80 Hz) (Mann–Whitney rank test over frequency window from 10-20 Hz to 90-100 Hz; ***p < 0.001). The two spectral distributions are not different below 2 Hz. C Experimental paradigm and exemplificative VEPs to alternating checkerboards. Dotted lines indicate the checkerboard reversal. D Contrast sensitivity curve is significantly different in Shank3 KO (N = 17) versus Wt mice (N = 17) (two-way ANOVA, Holm-Sidak test; ***p < 0.001), with Shank3 KO mice showing fast saturation of the response curve at lower contrast value. The continuous lines here and in panel F are Michaelis–Menten fits to the data. E Exemplificative waveforms of responses to alternating checkerboards (red, Shank3 KO; magenta, Shank3 KO after midazolam superfusion over the cortex). Scale bars: 0.1 mV, 0.5 s. F Contrast sensitivity curve is significantly different in Shank3 KO treated with vehicle (N = 6) versus Shank3 KO + Midazolam mice (N = 6) and it is evident a rescue to control situation after superfusion with Midazolam (Wt, N = 17; 5 mg/ml; two-way ANOVA; **p = 0.003). G Analysis of contrast sensitivity curves, as quantified by the Michaelis–Menten fittings (Wilcoxon Signed Ranks Test; * p = 0.035)
Fig. 2
Fig. 2
Generation of mouse model and analysis of Parvalbumin expression. A Right, schematic strategy for the generation of Pv-Cre+/− TdTomatoFl/− Shank3Fl/Wt mice that express the gene reporter TdTomato specifically in PV-positive cells. Left, representative images of PCR genotype analysis. B Hippocampal fluorescence images of Pv-Cre+/− TdTomatoFl/− Shank3Wt/Wt mice at different ages. Parvalbumin expression (red) begins from 14 days after birth. C Representative images of Pv (green) and TdTomato (red) colocalization in hippocampal slice. D Quantification (left) and representative images (right) of Shank3 expression (green) in PV-positive neurons in CA1 stratum radiatum and visual cortex of Pv-Cre +/− Shank3Wt/Wt and Pv-Cre +/− Shank3Wt/Fl mice. Experiment in the CA1 stratum radiatum was analyzed by unpaired, two-tailed Student’s t-test; Visual cortex was analyzed by unpaired, two-tailed Student’s t-test with Welch’s correction; n = 5 Pv-Cre +/− Shank3Wt/Wt, n = 5 Pv-Cre +/− Shank3Fl/Wt; *p < 0.05; ****p < 0.0001. CA1 = Cornu Ammonis-1. Scale bar = 10 µm
Fig. 3
Fig. 3
Shank3 haploinsufficiency specifically in inhibitory PV neurons is sufficient to induce behavioral deficits. A Increased repetitive grooming behavior in Pv-Cre+/− Shank3Fl/Wt compared to Pv-Cre+/− Shank3Wt/Wt mice. Grooming time was analyzed by unpaired, two-tailed Student’s t-test; n = 9 for each group; **p < 0.01. B Pv-Cre+/− Shank3Fl/Wt mice show an impairment in the novel object recognition test. Novel object recognition at 5 min was analyzed by unpaired, two-tailed Student’s t-test; novel object recognition at 120 min was analyzed by two-tailed Mann–Whitney test; Novel object recognition at 24 h was analyzed by unpaired, two-tailed Student’s t-test; n = 7 Pv-Cre+/− Shank3Wt/Wt, n = 8 Pv-Cre+/− Shank3Fl/Wt; **p < 0.01; ***p < 0.001. C Spatial memory was evaluated by determining a discrimination index in the spatial object recognition test. Pv-Cre+/− Shank3Fl/Wt mice have an impairment in the discrimination index in all the time point evaluated. Spatial object recognition at 5 min, 120 min and 24 h were analyzed by unpaired, two-tailed Student’s t-test; n = 7 for each group; **p < 0.01; ***p < 0.001. D Pv-Cre+/− Shank3Fl/Wt mice show impaired motor coordination in the balance beam test. Time to cross the 12 mm width beam was evaluated by unpaired, two-tailed Student’s t-test; time to cross the 6 mm width beam was analyzed by two-tailed Mann–Whitney test; n = 6 for each group; *p < 0.05. E Pv-Cre+/− Shank3Fl/Wt are impaired in the rotarod test. Unpaired, two-tailed Student’s t-test with Welch’s correction was used for the statistical analysis; n = 16 Pv-Cre+/− Shank3Wt/Wt, n = 17 Pv-Cre+/− Shank3Fl/Wt; *p < 0.05. F Pole test analysis show no alteration in Pv-Cre+/− Shank3Fl/Wt mice. Data were analyzed by unpaired, two-tailed Student’s t-test; n = 6 for each group. G Pv-Cre+/− Shank3Fl/Wt mice show normal muscle strength. Wire hanging test was evaluated by unpaired, two-tailed Student’s t-test; n = 6 for each group. H Social interaction was evaluated by the three-chamber assays. Unpaired, two-tailed Student’s t-test was used for statistical analysis; n = 11 Pv-Cre+/− Shank3Wt/Wt, n = 14 Pv-Cre+/− Shank3Fl/Wt
Fig. 4
Fig. 4
E/I balance is altered toward excitation when Shank3 is selectively disrupted in PV neurons even if in heterozygosis. A Spectral power analysis of Pv-Cre+/− Shank3Wt/Wt (N = 14 mice), Shank3 KO (N = 11 mice) and Pv-Cre+/− Shank3Fl/Wt mice (N = 10 mice). Spectral differences between Shank3 KO and Pv-Cre+/− Shank3Wt/Wt (indicated as KO-Wt in light red), and Pv-Cre+/− Shank3Fl/Wt and Pv-Cre+/− Shank3Wt/Wt (indicated as Pv-Wt in light blue) show a distinct E/I behavior in the two models, even in the direction of a more epileptic phenotype. B, C Graphs show an alteration of the spectral power for power less than 0.5 Hz (B) or frequencies larger than 100 Hz (C) (one-way ANOVA; *p < 0.05). D Exemplificative waveforms of slow-wave activity in control (black), Shank3 KO (red) and Pv-Cre+/− Shank3Fl/Wt (blue) anesthetized mice in which it appears evident the difference in US and DS modulation. * indicates a large transient suggestive of hypersynchronicity. Scale bar 0.4 mV, 1 s. E, F Shank3 mutation in PV neurons activity doesn’t affect US duration or frequency. G–I Shank3 mutation in PV neurons activity specifically affects US amplitude (G) and US power in HF band (I); one-way ANOVA, *p < 0.05), while doesn’t not affect US 25-80 Hz gamma power differently from what happens in Shank3 KO mice (see Fig. 1A)
Fig. 5
Fig. 5
Decrease of inhibitory interneurons in Pv-Cre+/− Shank3Fl/Wt mice. A Quantification and representative images of the number of PV neurons in the hippocampus. Pv-Cre+/− Shank3Fl/Wt mice show a reduction of Parvalbumin interneurons in the dentate gyrus of the hippocampus. Data from the CA1 were analyzed by unpaired, two-tailed Student’s t-test; quantification of the CA3 and DG were analyzed by two-tailed Mann–Whitney test; n = 17 Pv-Cre+/− Shank3Wt/Wt, n = 16 Pv-Cre+/− Shank3Fl/Wt; *** p < 0.001; n = number of bilateral slides analyzed; 3 animals used for each group. CA1 = Cornu Ammonis-1; CA3 = Cornu Ammonis-3; DG = dentate gyrus. B Quantification and representative images of the number of PV neurons in the medial prefrontal cortex. Data were analyzed by unpaired, two-tailed Student’s t-test; n = 9 Pv-Cre+/− Shank3Wt/Wt, n = 8 Pv-Cre+/− Shank3Fl/Wt; ** p < 0.01; n = number of bilateral slides analyzed; 3 animals used for each group. C Quantification and representative images of the number of PV neurons in the visual cortex. Data were analyzed by unpaired, two-tailed Student’s t-test with Welch’s correction; n = 8 Pv-Cre ± Shank3Wt/Wt, n = 11 Pv-Cre ± Shank3Fl/Wt; n = number of bilateral slides analyzed; 3 animals used for each group
Fig. 6
Fig. 6
Ganaxolone pharmacological treatment rescues the behavioral alteration in Pv-Cre+/− Shank3 Fl/Wt mice. A Repetitive behavior was evaluated as the time spent doing grooming. Grooming was analyzed by two-way ANOVA; n = 7 Pv-Cre+/− Shank3Wt/Wt vehicle, n = 8 Pv-Cre+/− Shank3Wt/Wt ganaxolone, n = 9 Pv-Cre+/− Shank3Fl/Wt vehicle, n = 10 Pv-Cre+/− Shank3Fl/Wt ganaxolone; * p < 0.05 Pv-Cre+/− Shank3Wt/Wt vehicle compared with Pv-Cre+/− Shank3Fl/Wt vehicle. B Ganaxolone treatment rescues the novel object recognition memory of Pv-Cre+/− Shank3Fl/Wt mice. Novel object was analyzed by two-way ANOVA; n = 6 Pv-Cre+/− Shank3Wt/Wt vehicle, n = 7 Pv-Cre+/− Shank3Wt/Wt ganaxolone, n = 8 Pv-Cre+/− Shank3Fl/Wt vehicle, n = 10 Pv-Cre+/− Shank3Fl/Wt ganaxolone; *** p < 0.001, **** p < 0.0001 Pv-Cre+/− Shank3Wt/Wt vehicle compared with Pv-Cre+/− Shank3Fl/Wt vehicle; $$$ p < 0.001; $$$$ p < 0.0001 Pv-Cre+/− Shank3Fl/Wt vehicle compared with Pv-Cre+/− Shank3Fl/Wt ganaxolone. C Spatial memory was evaluated by determining a discrimination index in the spatial object recognition test. Data were analyzed by two-way ANOVA; n = 6 for each group; *** p < 0.001, **** p < 0.0001 Pv-Cre+/− Shank3Wt/Wt vehicle compared with Pv-Cre+/− Shank3Fl/Wt vehicle; $$$$ p < 0.0001 Pv-Cre+/− Shank3Fl/Wt vehicle compared with Pv-Cre+/− Shank3Fl/Wt ganaxolone. D Motor coordination was evaluated as the time spent to cross the beam with a flat surface of 12 or 6 mm width. All p-values were derived using two-way ANOVA; n = 6 for each group in the 12 mm test; n = 7 Pv-Cre+/− Shank3Wt/Wt vehicle, n = 7 Pv-Cre+/− Shank3Wt/Wt ganaxolone, n = 7 Pv-Cre+/− Shank3Fl/Wt vehicle, n = 6 Pv-Cre+/− Shank3Fl/Wt ganaxolone in the 6 mm balance test; ** p < 0.01, **** p < 0.0001 Pv-Cre+/− Shank3Wt/Wt vehicle compared with Pv-Cre+/− Shank3Fl/Wt vehicle; $ p < 0.05; $$$$ p < 0.0001 Pv-Cre+/− Shank3Fl/Wt vehicle compared with Pv-Cre+/− Shank3Fl/Wt ganaxolone
Fig. 7
Fig. 7
Effect of ganaxolone on Shank3 KO mice. A Quantification of the number of PV neurons in the hippocampus. Shank3 KO mice did not present alteration in the number of Parvalbumin interneurons. Data from the CA1 were analyzed by one-way ANOVA; quantification of the CA3 and DG was analyzed by Kruskal–Wallis test; n = 17 Pv-Cre+/− Shank3Wt/Wt, n = 16 Pv-Cre+/− Shank3Fl/Wt, n = 16 Shank3 KO; ** p < 0.01; *** p < 0.001; n = number of bilateral slides analyzed; 3 animals used for each group; CA1 = Cornu Ammonis-1; CA3 = Cornu Ammonis-3; DG = dentate gyrus. B Quantification of the number of PV neurons in the medial prefrontal cortex were analyzed by one-way ANOVA; n = 10 Pv-Cre+/− Shank3Wt/Wt, n = 10 Pv-Cre+/− Shank3Fl/Wt, n = 10 Shank3 KO; n = number of bilateral slides analyzed; 3 animals used for each group. C Quantification of the number of PV neurons in the visual cortex were analyzed by one-way ANOVA; n = 8 Pv-Cre ± Shank3Wt/Wt, n = 11 Pv-Cre ± Shank3Fl/Wt, n = 8 Shank3 KO. n = number of bilateral slides analyzed. D Representative western blots and relative protein quantification from hippocampal PSD-enriched fraction derived from adult mice. Data obtained from the quantification of Shank3 were analyzed by Brown-Forsythe and Welch ANOVA; GABA-A-R-alpha1 was analyzed by Kruskal–Wallis test. Shank3 n = 6 for each group; GABA-A-R-alpha1 n = 11 Pv-Cre+/− Shank3Wt/Wt and Pv-Cre+/− Shank3Fl/Wt, n = 10 Shank3 WT, n = 9 Shank3 KO. * p < 0.05; ** p < 0.01; *** p < 0.001. E Representative western blots and relative protein quantification from cortical PSD-enriched fraction derived from adult mice. Data obtained from the quantification of Shank3 was analyzed by Brown-Forsythe and Welch ANOVA. GABA-A-R-alpha1 protein quantification was analyzed by Kruskal–Wallis test. Shank3 n = 12 for each group; GABA-A-R-alpha1 n = 13 for each group. * p < 0.05; **** p < 0.0001. F Evaluation of evocative memory in Wt and Shank3 KO mice after ganaxolone treatment was evaluated by calculating a discrimination index in the novel object recognition test. Data were analyzed by two-way ANOVA; n = 8 Wt vehicle, n = 8 Wt ganaxolone, n = 8 Shank3 KO vehicle, n = 9 Shank3 KO ganaxolone; * p < 0.5; *** p < 0.001 Wt vehicle compared with Shank3 KO vehicle; $ p < 0.05; $$$ p < 0.001 Shank3 KO vehicle compared with Shank3 KO ganaxolone. G Repetitive grooming behavior was analyzed by two-way ANOVA; n = 8 Wt vehicle, n = 6 Wt ganaxolone, n = 7 Shank3 KO vehicle, n = 8 Shank3 KO ganaxolone; ** p < 0.01 Shank3 Wt vehicle compared with Shank3 KO vehicle; $ p < 0.05 Shank3 KO vehicle compared with Shank3 KO ganaxolone

References

    1. Bonaglia MC, Giorda R, Borgatti R, Felisari G, Gagliardi C, Selicorni A, et al. Disruption of the ProSAP2 gene in a t(12;22)(q24.1;q13.3) is associated with the 22q133 deletion syndrome. Am J Hum Genet. 2001;69(2):261–268. doi: 10.1086/321293. - DOI - PMC - PubMed
    1. Phelan K, Boccuto L, Powell CM, Boeckers TM, van Ravenswaaij-Arts C, Rogers RC, et al. Phelan-McDermid syndrome: a classification system after 30 years of experience. Orphanet J Rare Dis. 2022;17(1):27. doi: 10.1186/s13023-022-02180-5. - DOI - PMC - PubMed
    1. Phelan K, McDermid HE. The 22q13.3 deletion syndrome (Phelan-McDermid syndrome) Mol Syndromol. 2012;2(3–5):186–201. - PMC - PubMed
    1. Phelan MC, Rogers RC, Saul RA, Stapleton GA, Sweet K, McDermid H, et al. 22q13 deletion syndrome. Am J Med Genet. 2001;101(2):91–99. doi: 10.1002/1096-8628(20010615)101:2<91::AID-AJMG1340>3.0.CO;2-C. - DOI - PubMed
    1. Sarasua SM, Dwivedi A, Boccuto L, Chen CF, Sharp JL, Rollins JD, et al. 22q13.2q13.32 genomic regions associated with severity of speech delay, developmental delay, and physical features in Phelan-McDermid syndrome. Genet Med. 2014;16(4):318–328. doi: 10.1038/gim.2013.144. - DOI - PubMed

Publication types

Supplementary concepts