. 2023 Sep;601(17):3789-3812.
doi: 10.1113/JP284391. Epub 2023 Aug 1.

A multiscale predictive digital twin for neurocardiac modulation

Affiliations

A multiscale predictive digital twin for neurocardiac modulation

Pei-Chi Yang et al. J Physiol. 2023 Sep.

Abstract

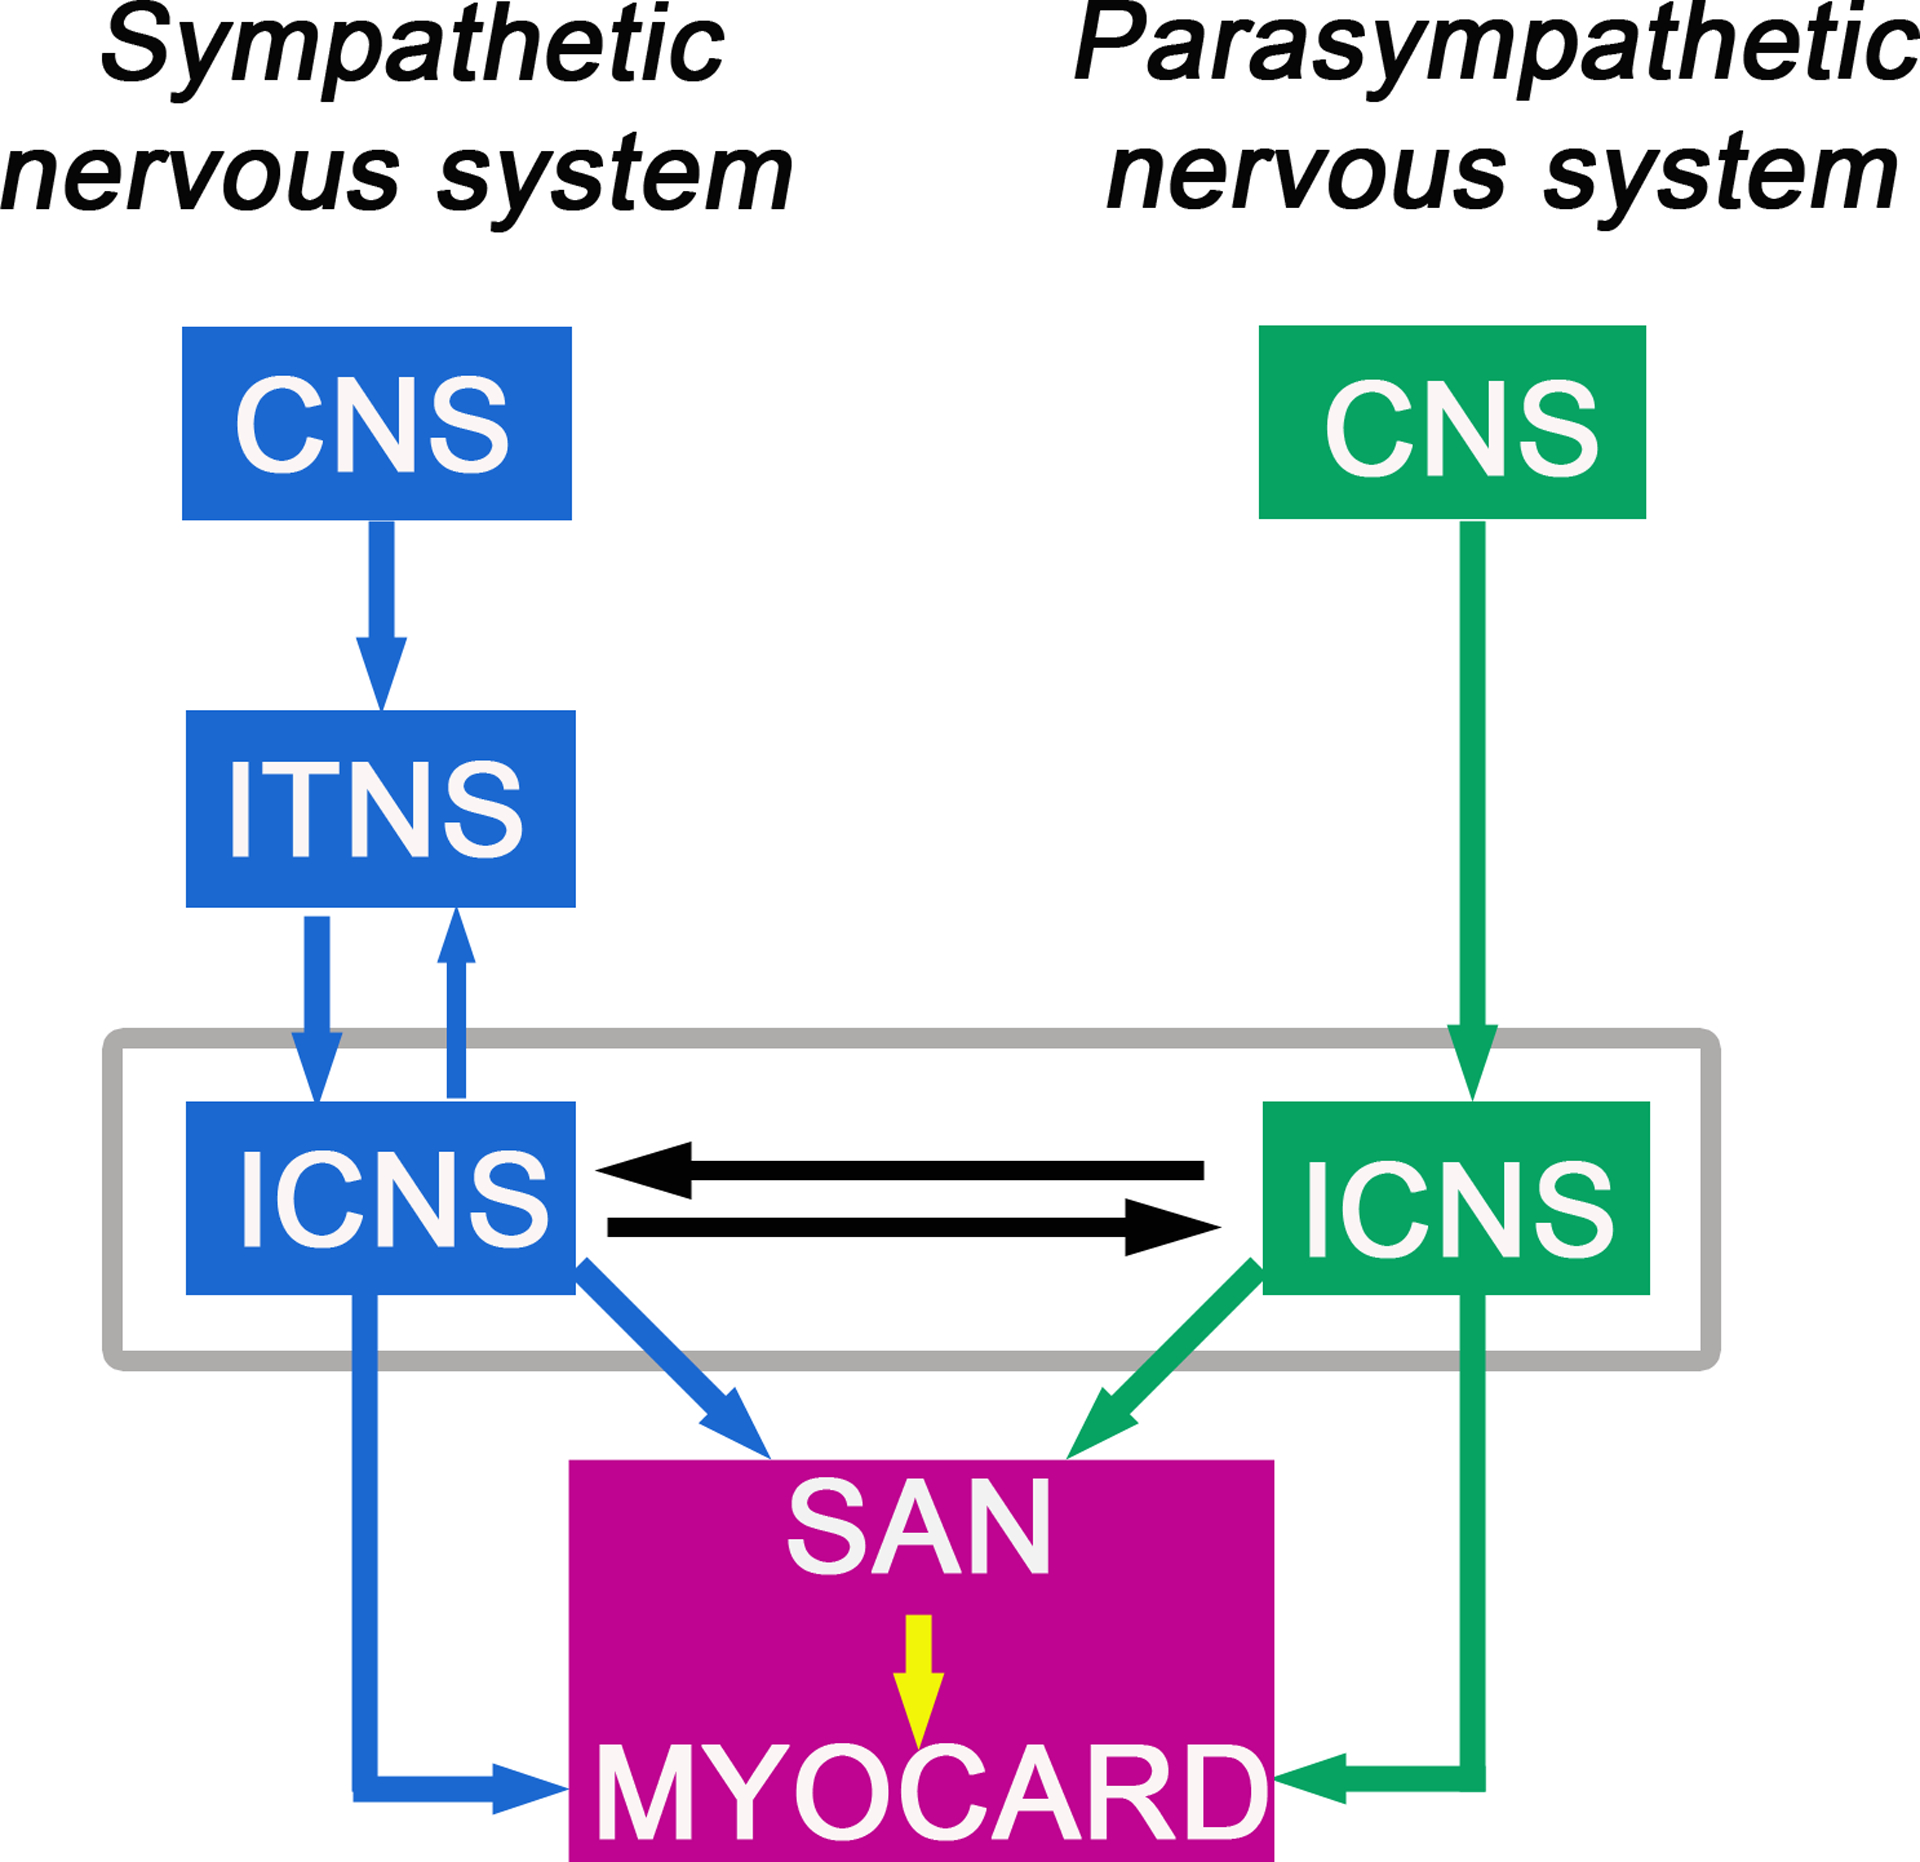
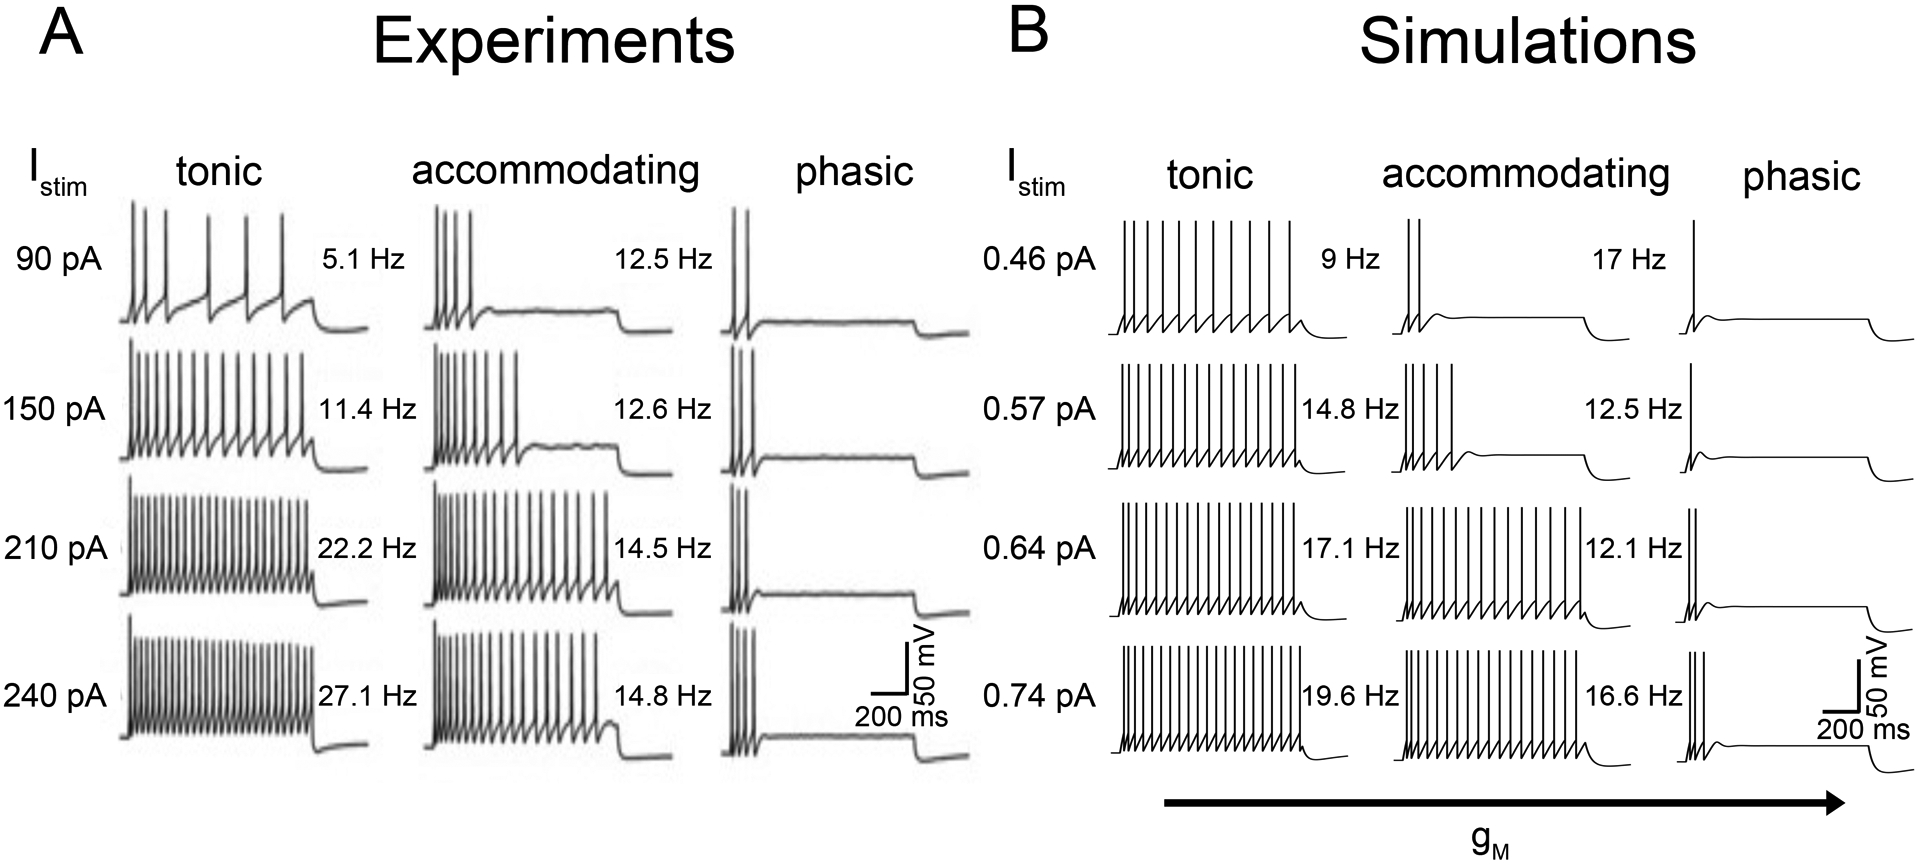
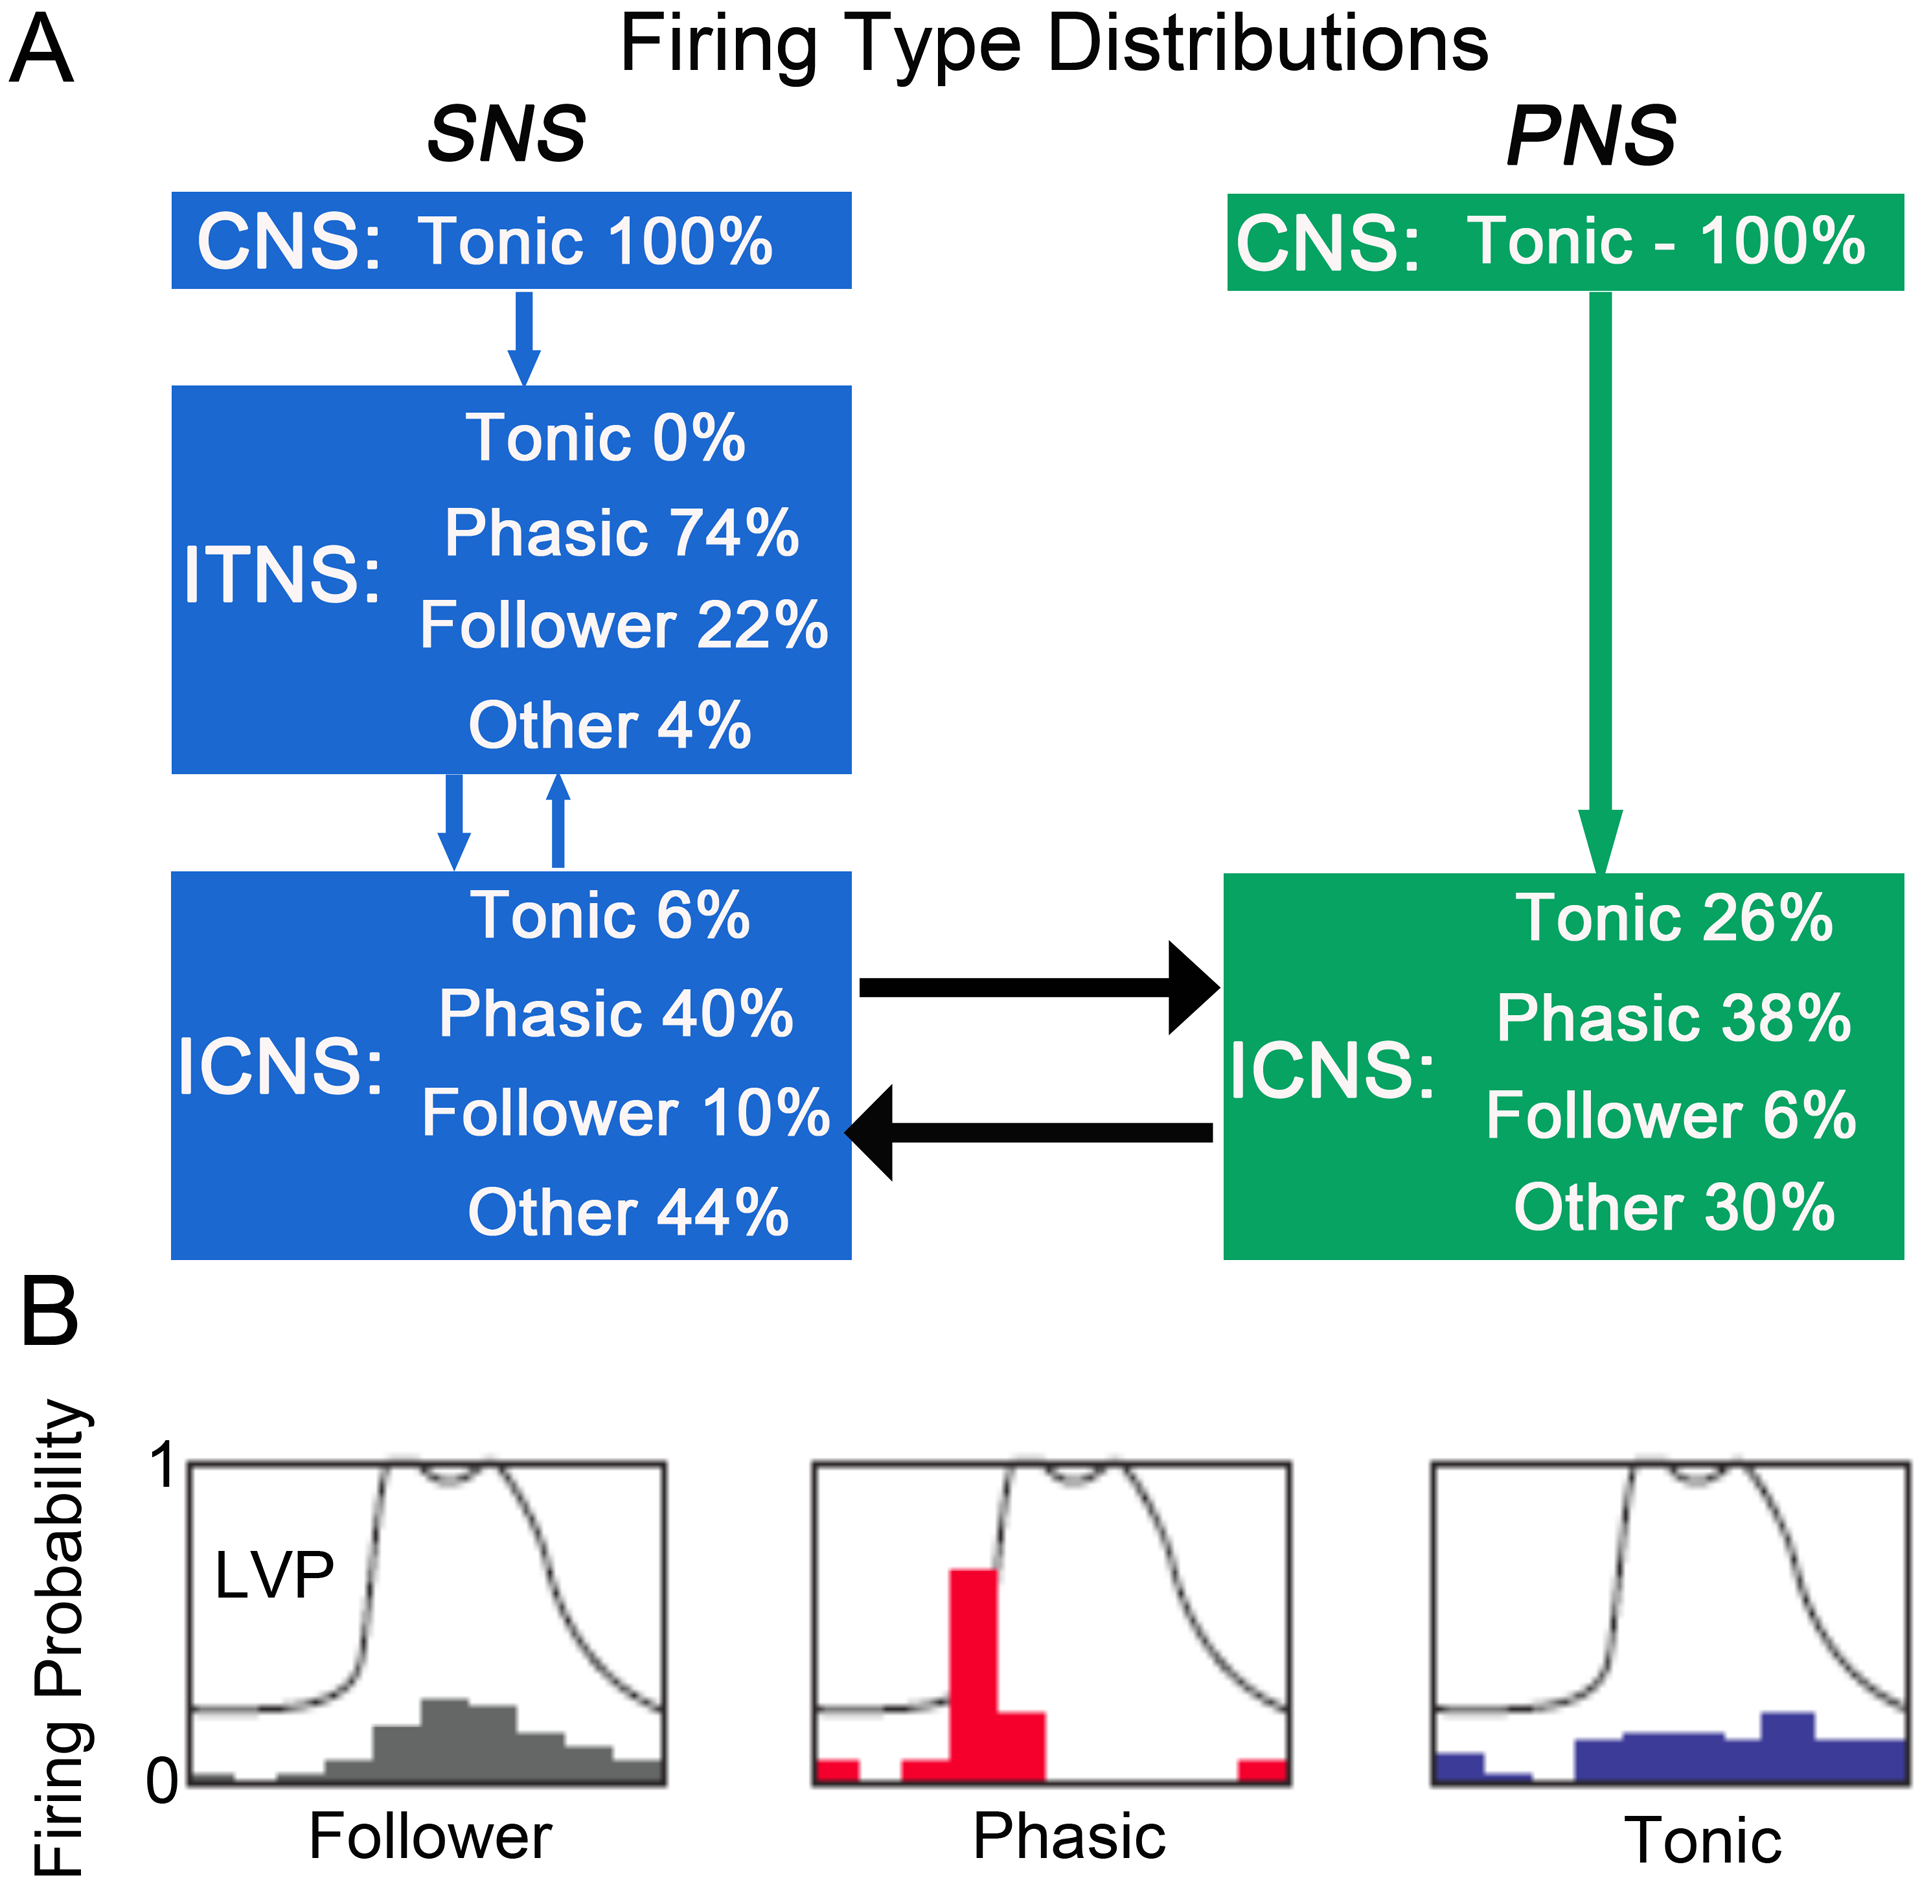
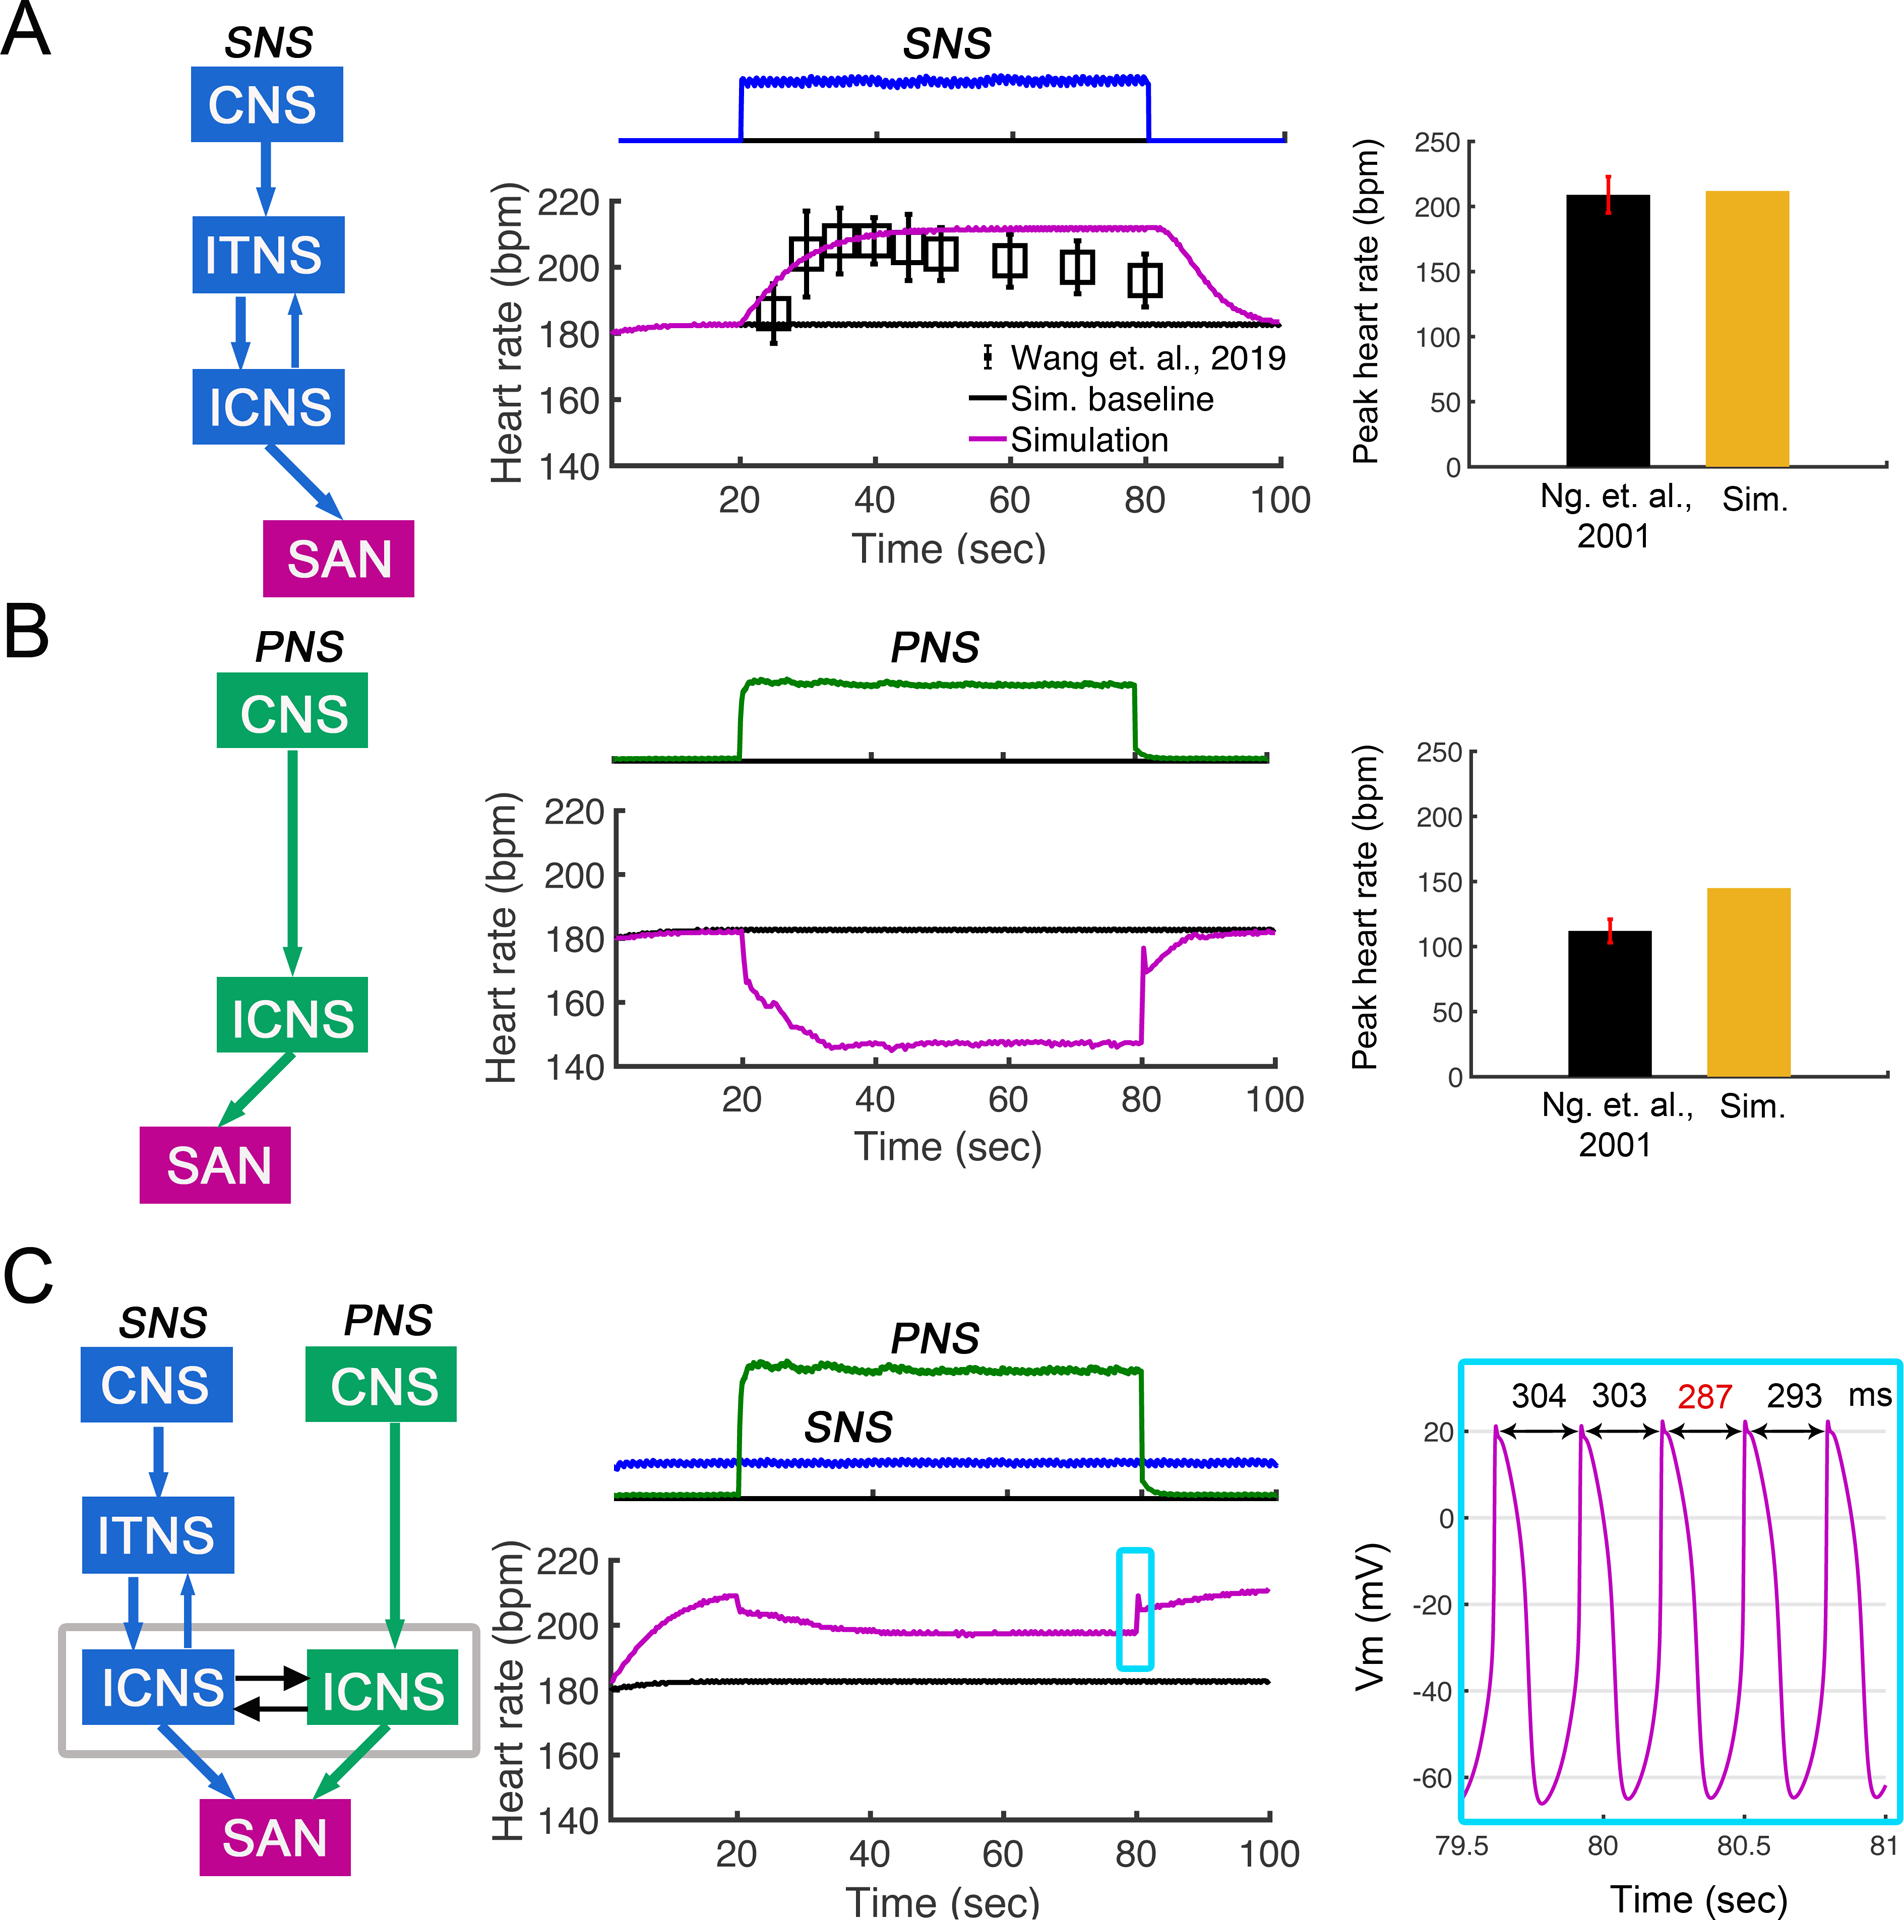
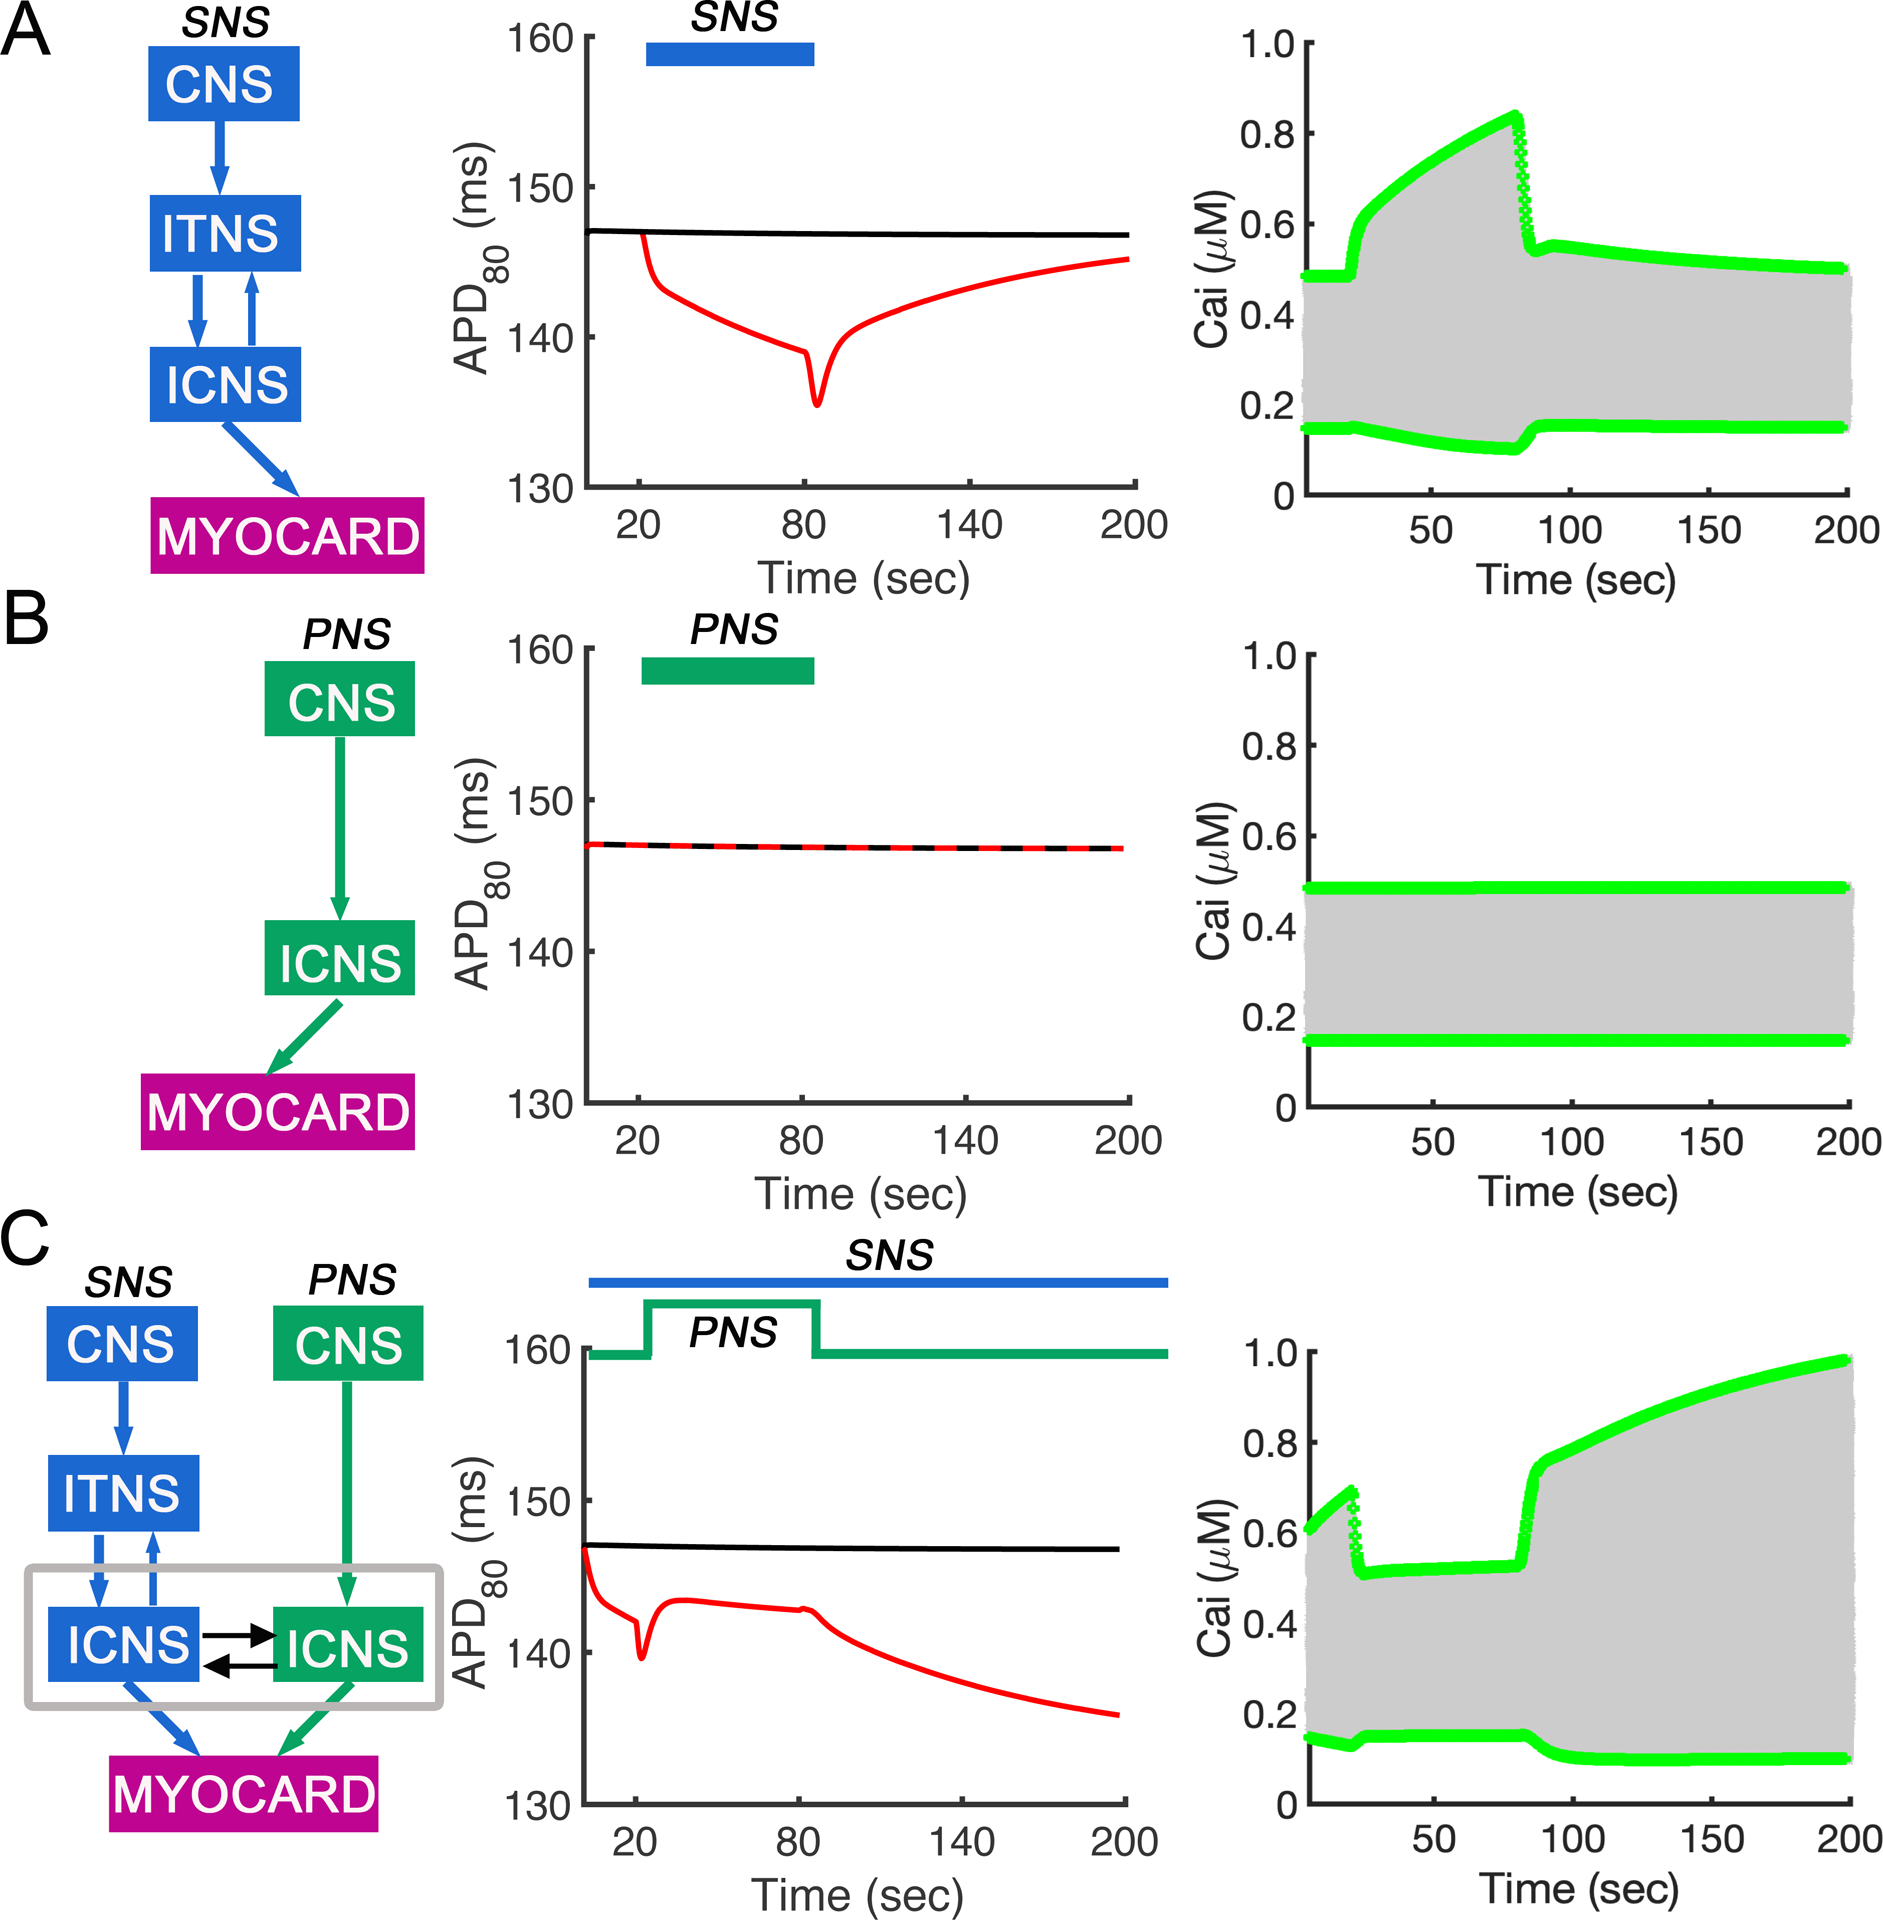
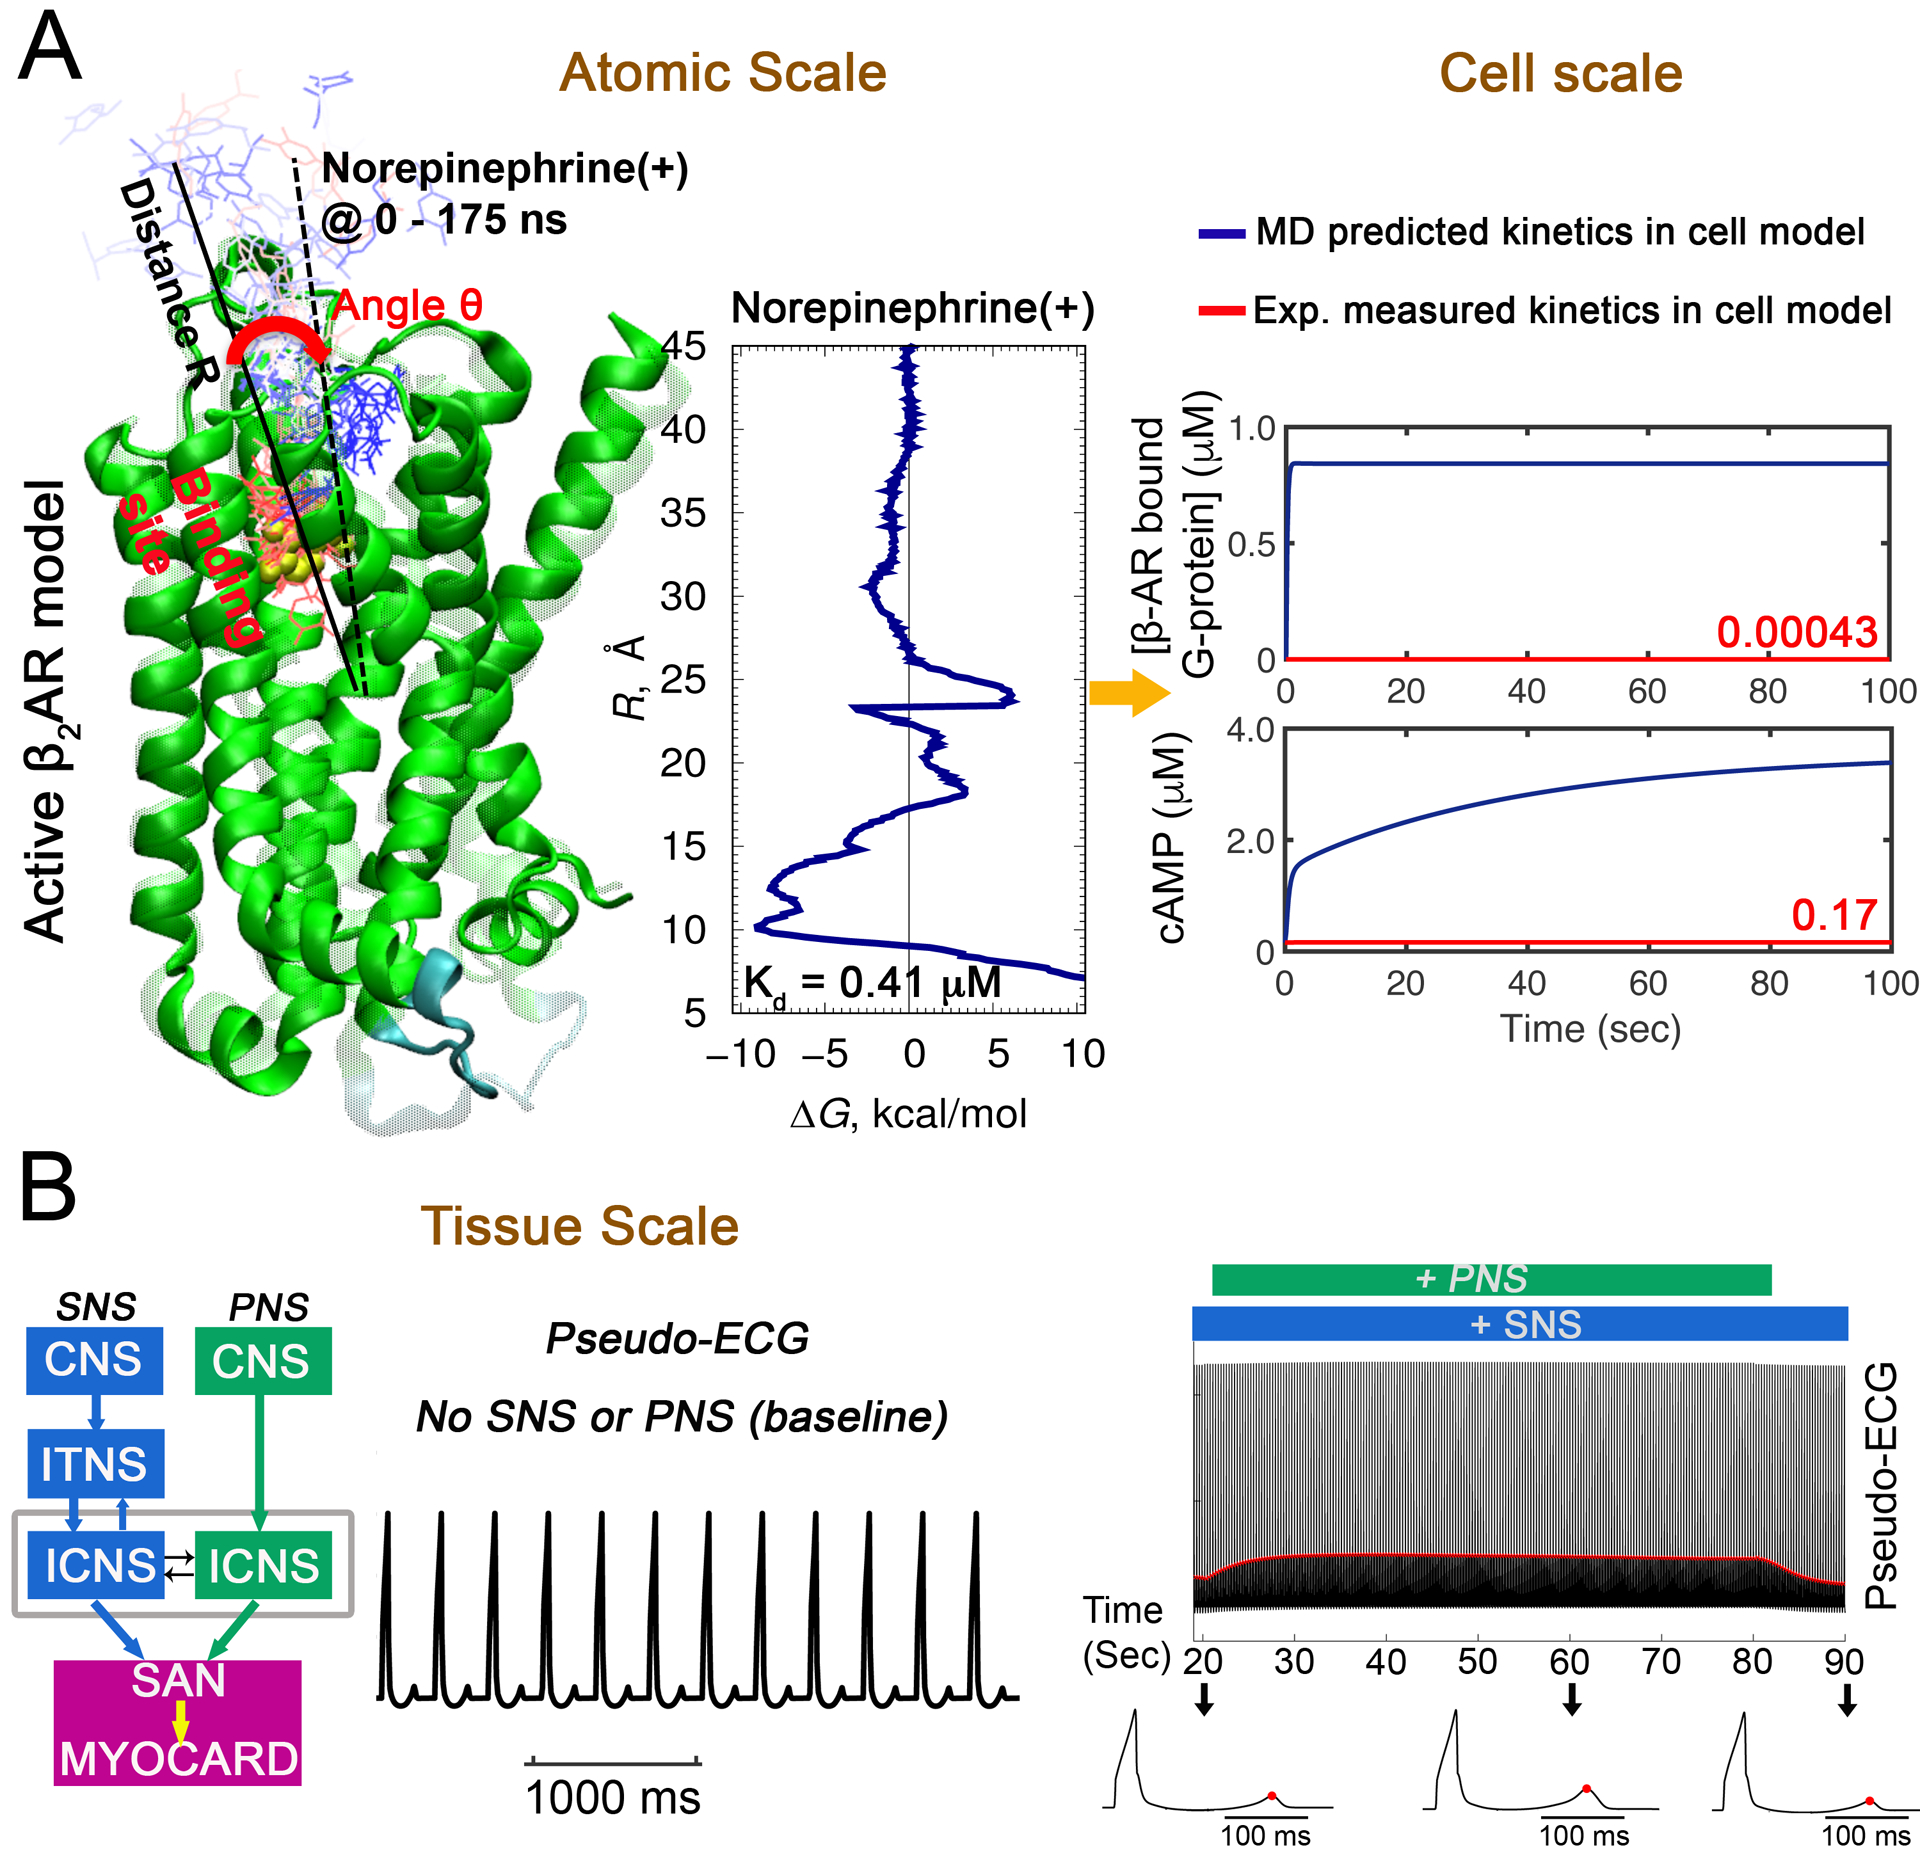
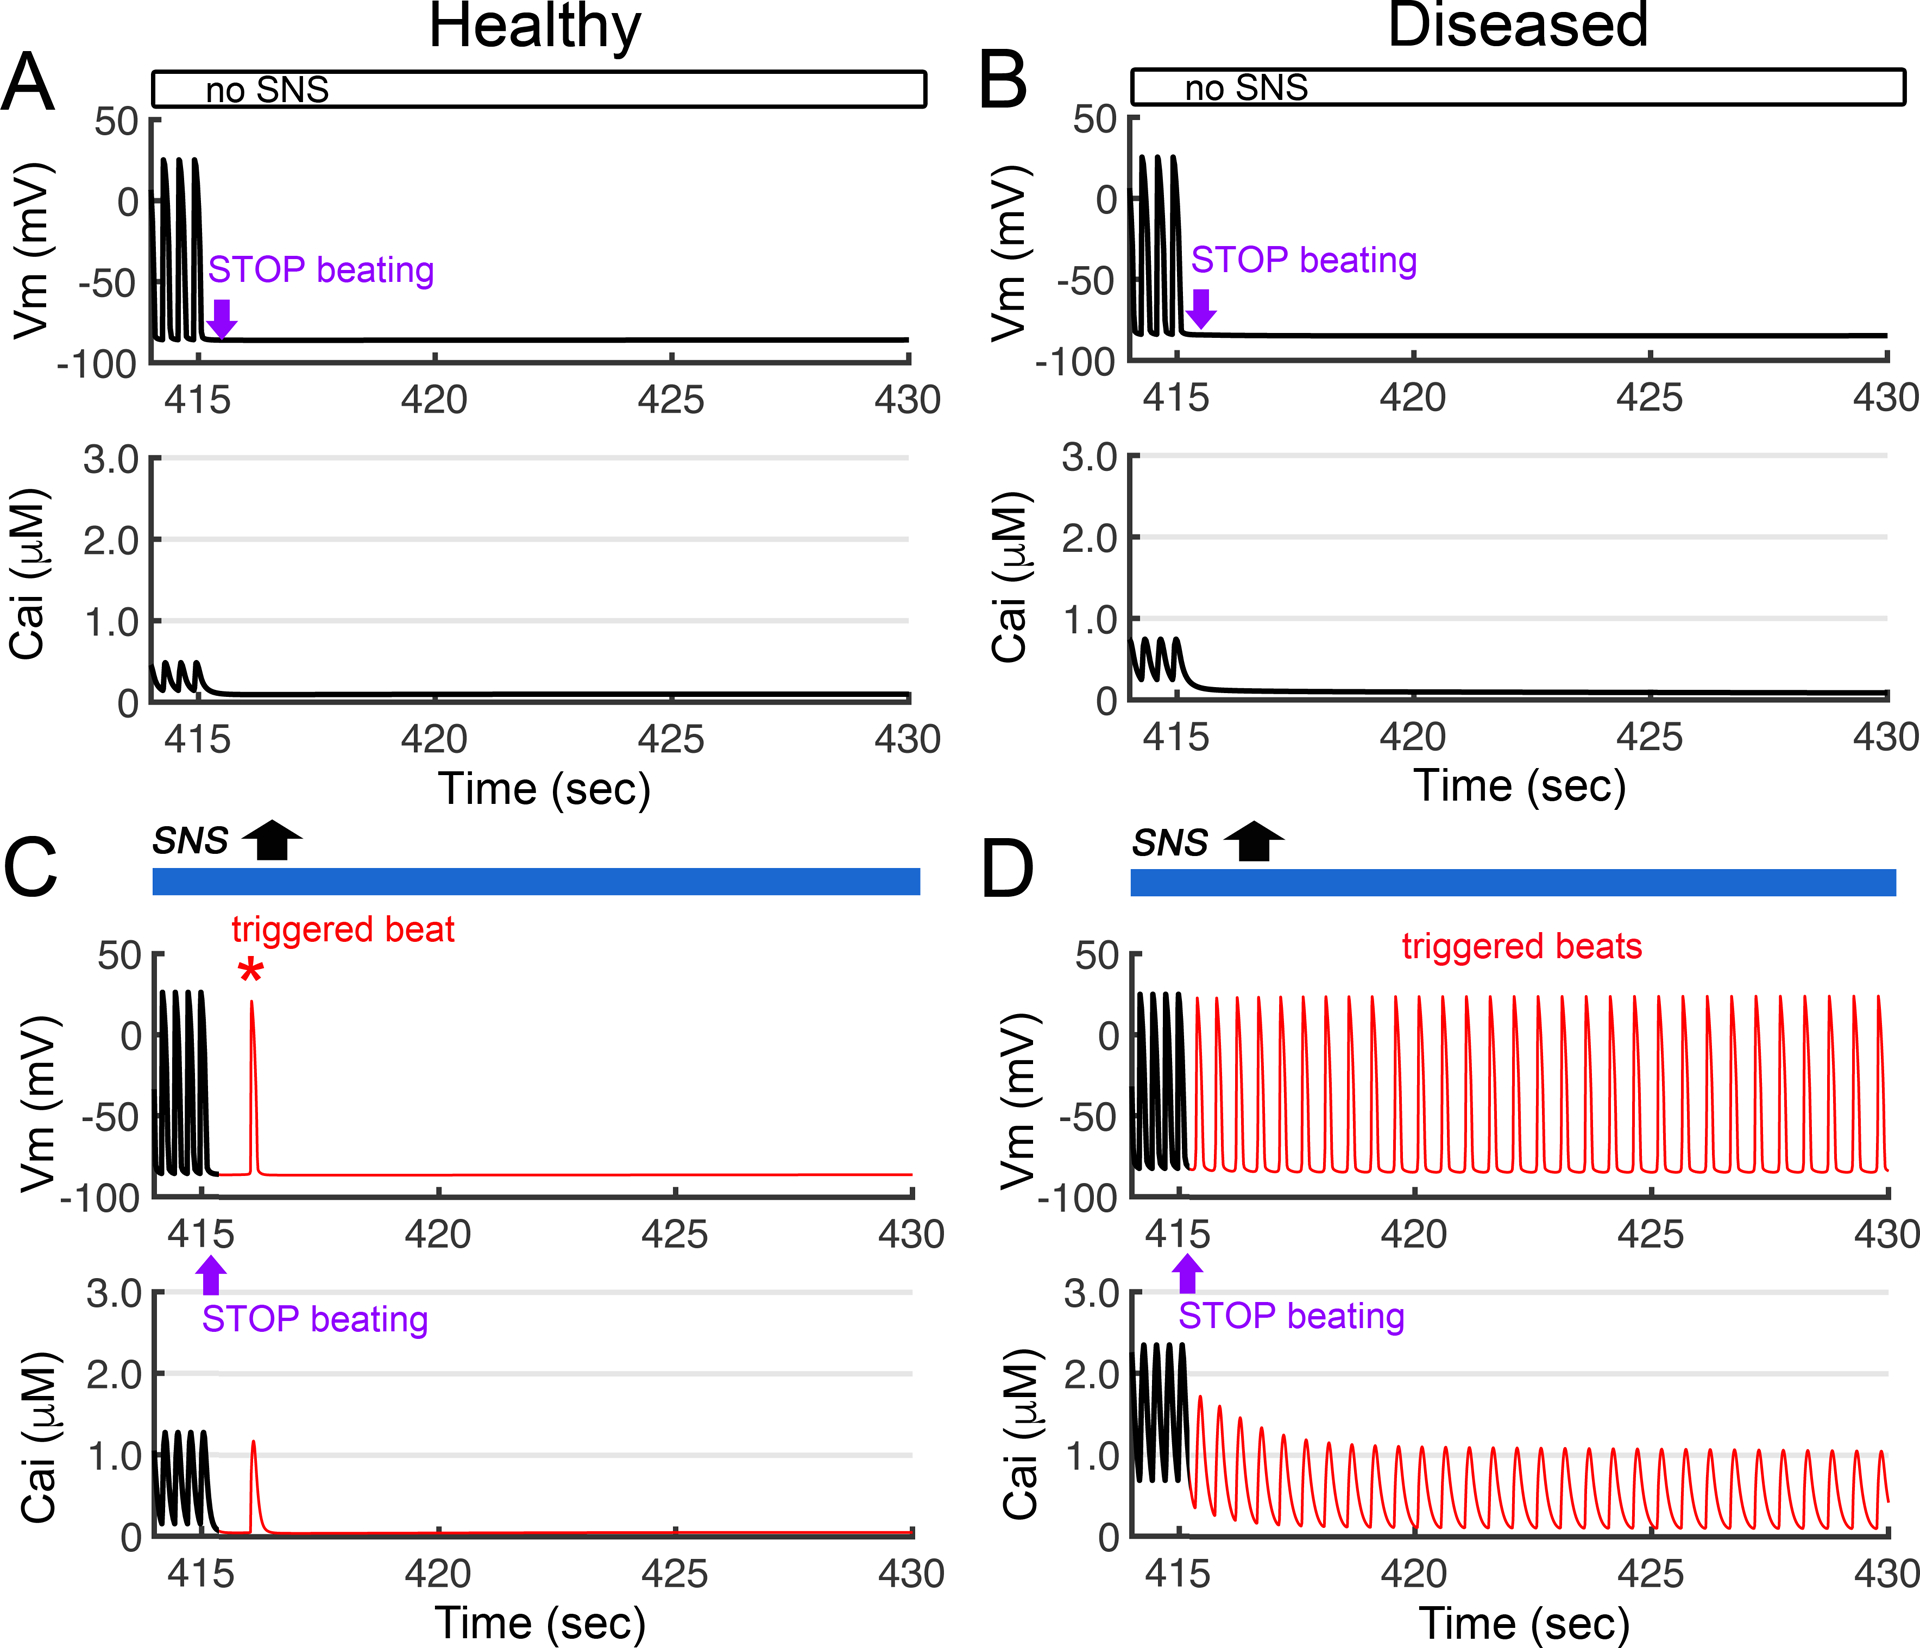
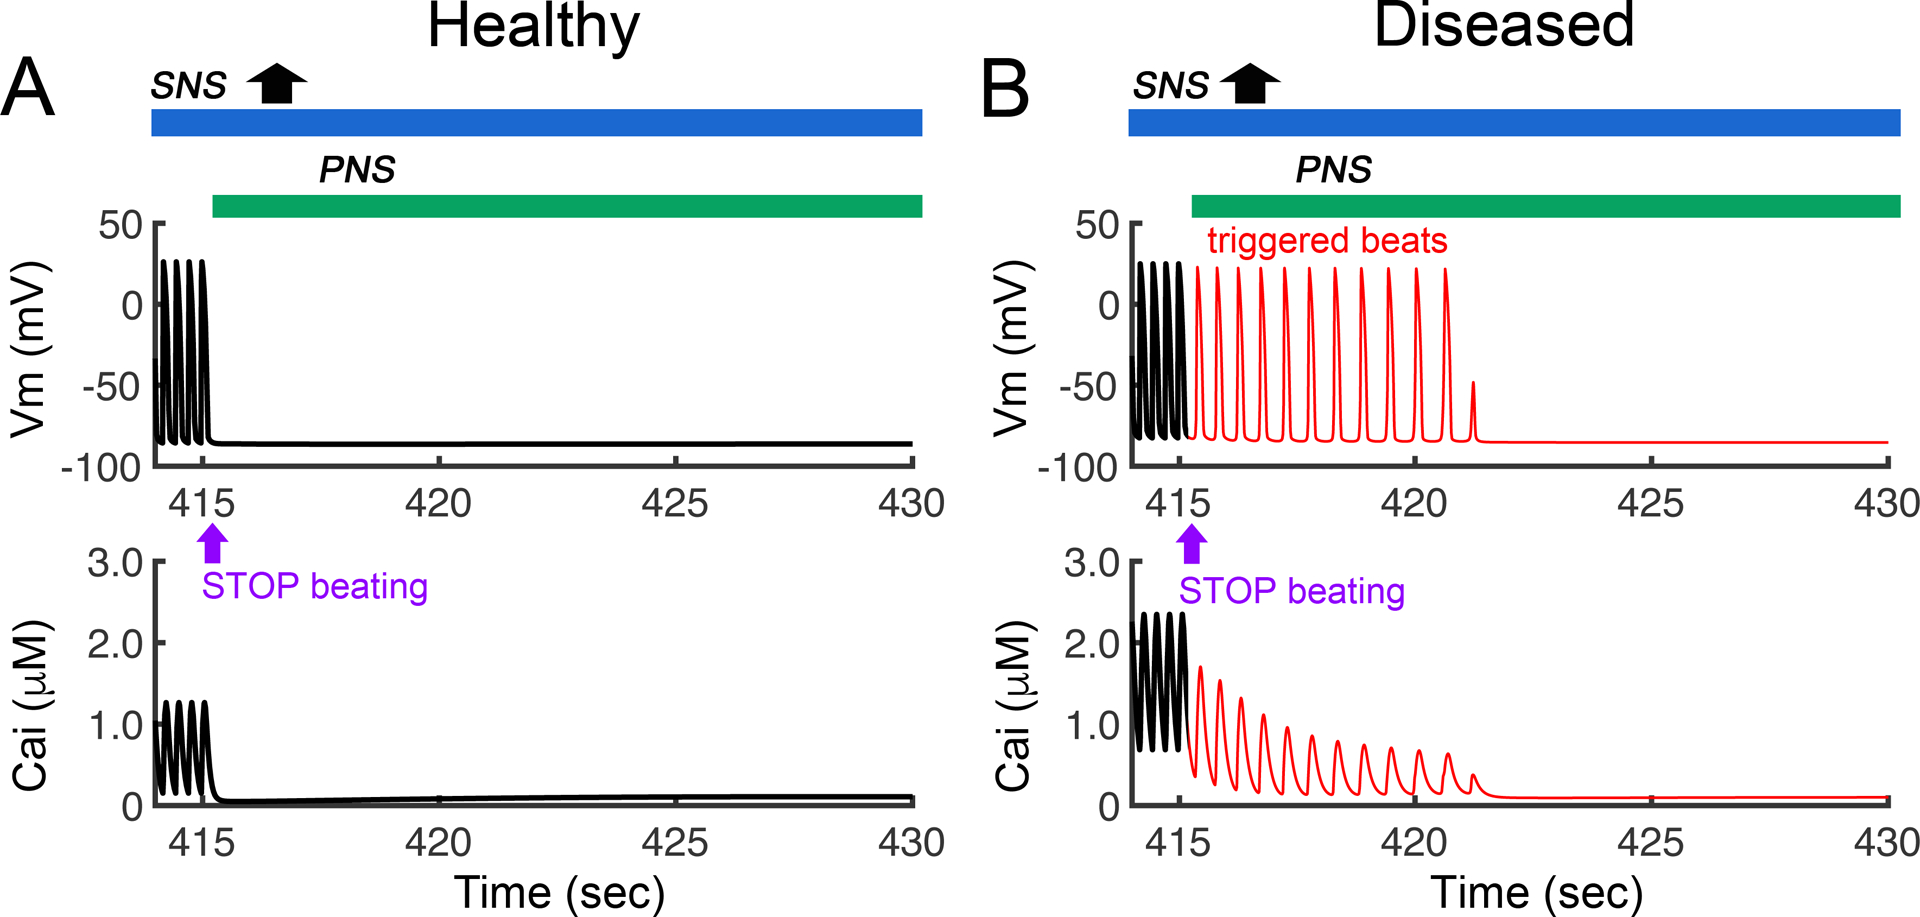
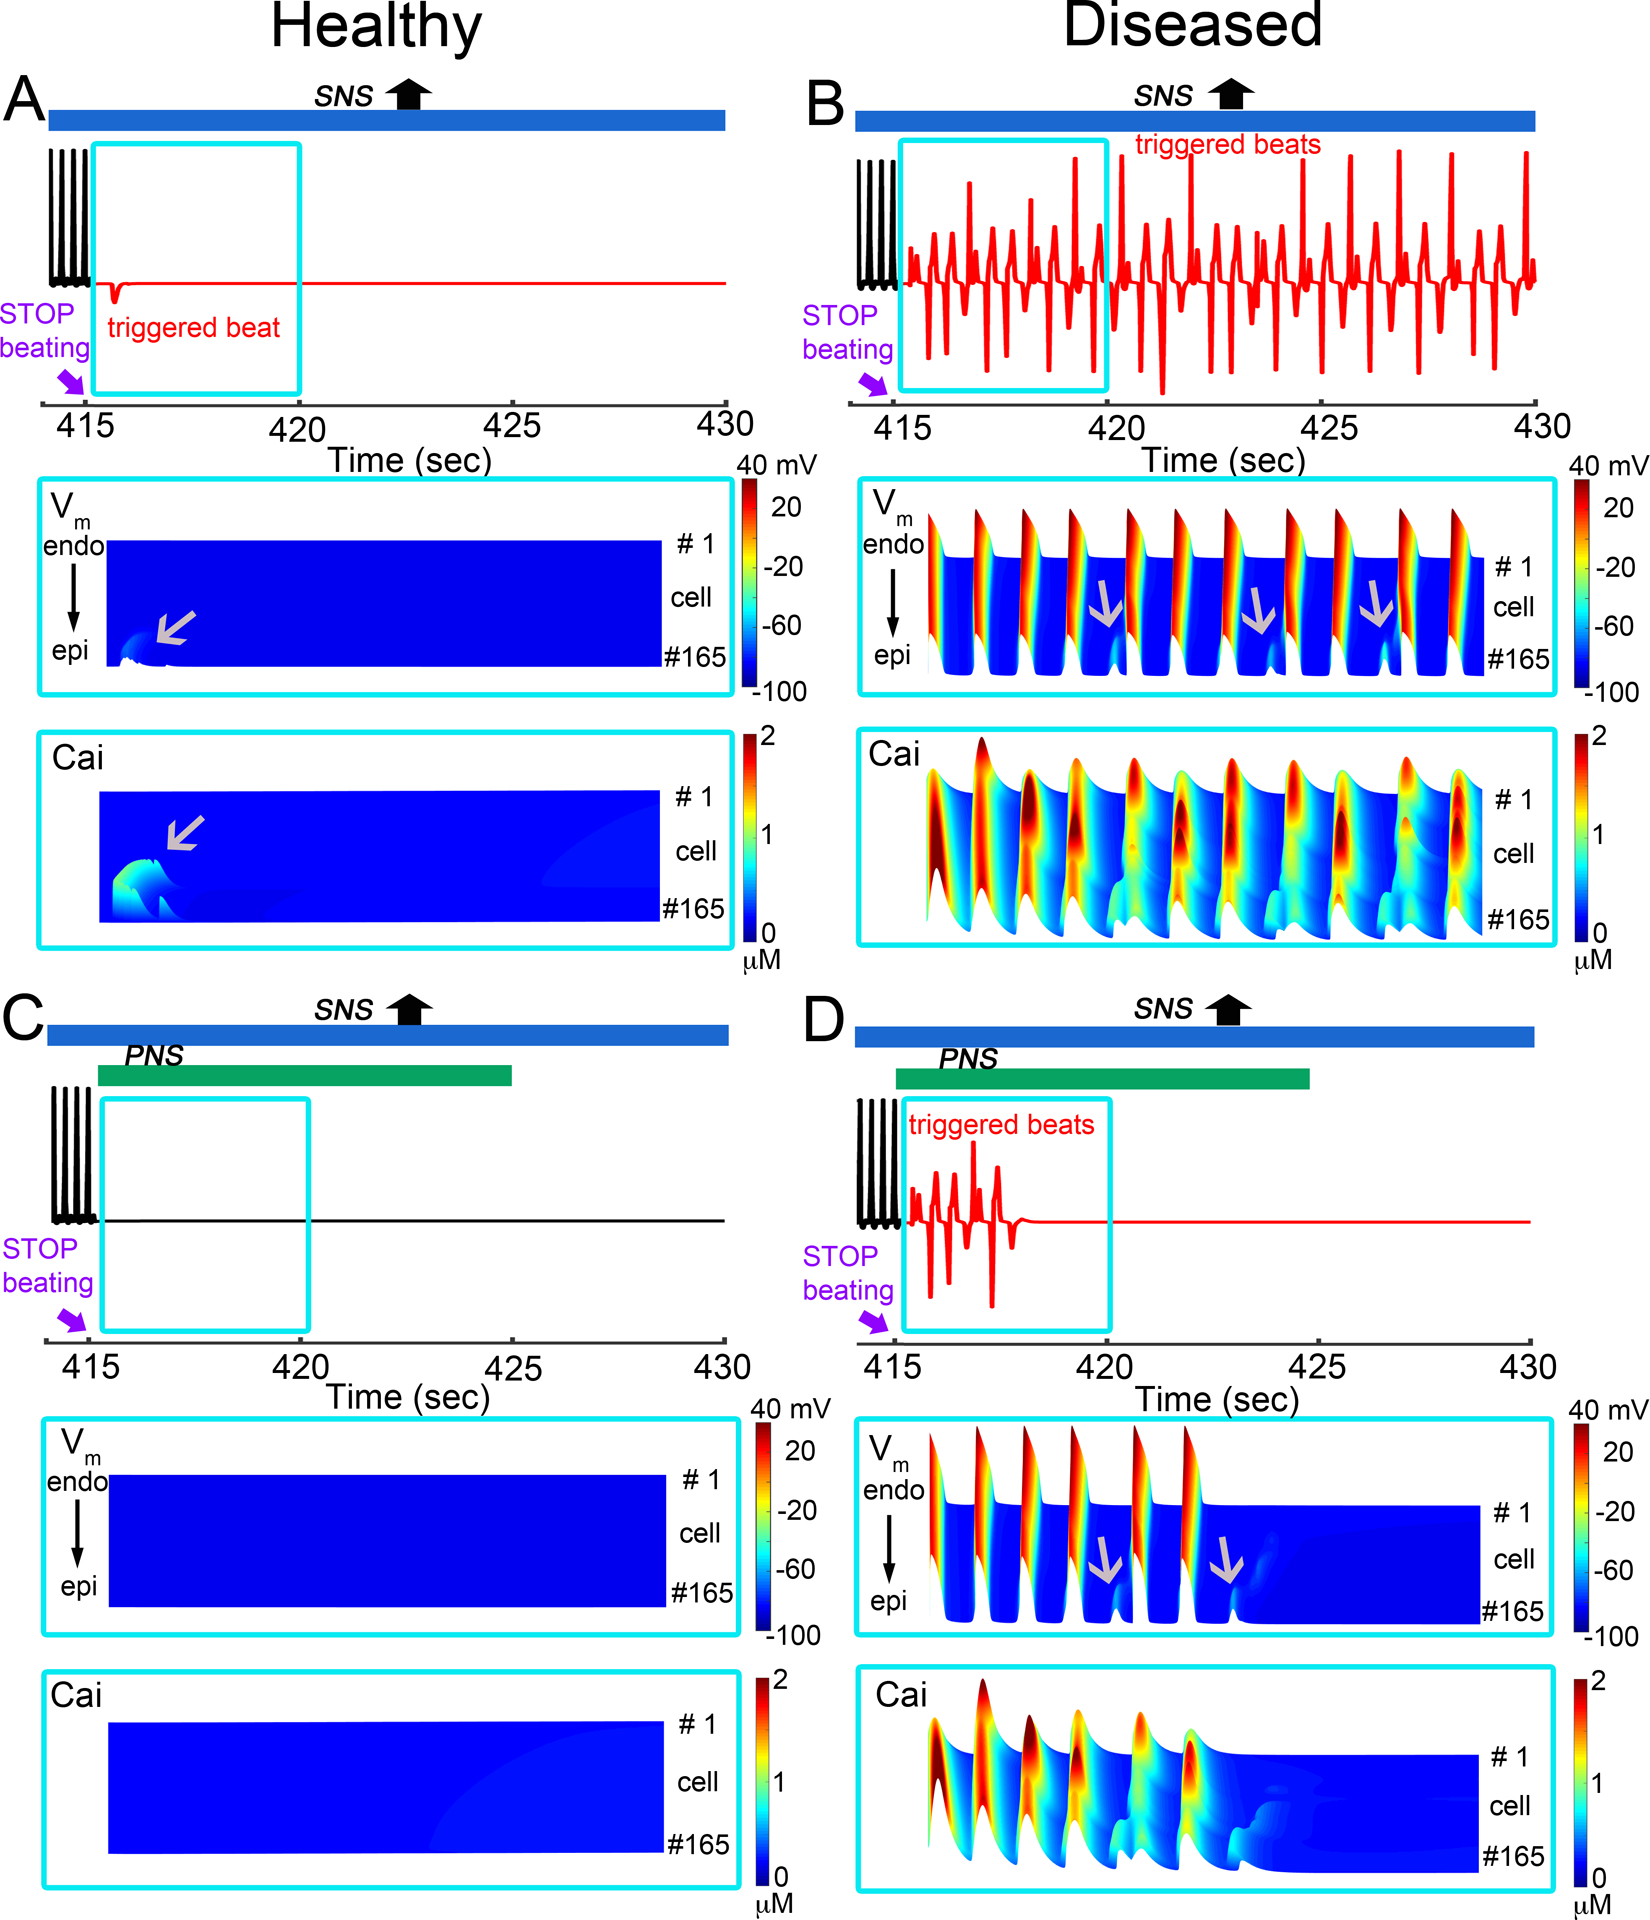
Cardiac function is tightly regulated by the autonomic nervous system (ANS). Activation of the sympathetic nervous system increases cardiac output by increasing heart rate and stroke volume, while parasympathetic nerve stimulation instantly slows heart rate. Importantly, imbalance in autonomic control of the heart has been implicated in the development of arrhythmias and heart failure. Understanding of the mechanisms and effects of autonomic stimulation is a major challenge because synapses in different regions of the heart result in multiple changes to heart function. For example, nerve synapses on the sinoatrial node (SAN) impact pacemaking, while synapses on contractile cells alter contraction and arrhythmia vulnerability. Here, we present a multiscale neurocardiac modelling and simulator tool that predicts the effect of efferent stimulation of the sympathetic and parasympathetic branches of the ANS on the cardiac SAN and ventricular myocardium. The model includes a layered representation of the ANS and reproduces firing properties measured experimentally. Model parameters are derived from experiments and atomistic simulations. The model is a first prototype of a digital twin that is applied to make predictions across all system scales, from subcellular signalling to pacemaker frequency to tissue level responses. We predict conditions under which autonomic imbalance induces proarrhythmia and can be modified to prevent or inhibit arrhythmia. In summary, the multiscale model constitutes a predictive digital twin framework to test and guide high-throughput prediction of novel neuromodulatory therapy. KEY POINTS: A multi-layered model representation of the autonomic nervous system that includes sympathetic and parasympathetic branches, each with sparse random intralayer connectivity, synaptic dynamics and conductance based integrate-and-fire neurons generates firing patterns in close agreement with experiment. A key feature of the neurocardiac computational model is the connection between the autonomic nervous system and both pacemaker and contractile cells, where modification to pacemaker frequency drives initiation of electrical signals in the contractile cells. We utilized atomic-scale molecular dynamics simulations to predict the association and dissociation rates of noradrenaline with the β-adrenergic receptor. Multiscale predictions demonstrate how autonomic imbalance may increase proclivity to arrhythmias or be used to terminate arrhythmias. The model serves as a first step towards a digital twin for predicting neuromodulation to prevent or reduce disease.

Keywords: arrhythmia; autonomic nervous system; cardiac electrophysiology; computational model; digital twins; parasympathetic; sympathetic nervous system.


Conflict of interest statement

Competing Interests

The authors declare no competing interests.

Figures

Figure 1:
Figure 1:
Schematic representation of the connection of sympathetic and parasympathetic nervous system branches to sinoatrial nodal cell representations and ventricular myocyte computational cells. The modular workflow consists of a network layer representation for the sympathetic branch (blue) and the parasympathetic branch (green) of the autonomic nervous system (ANS) that both synapse onto the cardiac sinoatrial node (SAN) as well as on cardiac ventricular myocardium (purple box). The model allows for prediction of efferent sympathetic and parasympathetic signaling and target-organ responses. The model drives spontaneous pacemaker action potentials modulated by the ANS that determine the cardiac ventricular pacing frequency (indicated by the yellow arrow).
Figure 2:
Figure 2:
Model generation of three distinct types of neuronal firing dynamics. Shown are examples of A) experimentally recorded current-voltage relationships of neurons in the superior cervical ganglion of adult male rats (Springer et al., 2015) and B) model predicted neuronal firing recorded by using a 1s stimulus with differing stimulus current input amplitude. (A) Experimental recordings indicate that neurons generate at least three types of firing patterns: tonic, accommodating, and phasic. Tonic neurons fired repetitively at frequencies proportional to strength of stimulus. Accommodating neurons adapted and ceased firing at lower stimulus levels. Phasic neurons fired one to four spikes and ceased firing. (B) Model neurons displayed tonic, accommodating, and phasic firing dynamics. Variations in maximal M-current conductance (gM) elicited a change in firing dynamics observed in experiments and indicate a plausible mechanism to explain the firing dynamics in panel A.
Figure 3:
Figure 3:
Predicted distribution of firing types in the ANS Layered Network Model. (A) Schematic of the autonomic nervous system layered network model. Each rectangle (CNS, ITNS, ICNS) represents a random network of model generated integrate-and-fire neurons with delayed rectifier potassium, leak, M-type potassium, and synaptic currents. Synaptic currents generate the intra- and inter-network connections. Inter-network connections are represented by arrows. Temporal correlation to left ventricular pressure is used to classify firing types as follower, phasic, or tonic. Distribution of firing types within each network were predicted at steady-state, averaged over seven 60-s simulations. Model generated neuronal firing patters that did not clearly fit into one classification were labeled as “other”. (B) Examples of neural firing relative to cardiac phase in ICNS neurons measured in canine (Beaumont et al., 2013). Probability density of ICNS neuronal firing (i.e., ICNS firing histograms) as a function of the timing within the left ventricular pressure (LVP) cycle (represented as a phase between 0 and 2π). The LVP is indicated by the gray curve.
Figure 4:
Figure 4:
Effects of sympathetic and parasympathetic stimulation on heart rate in the rabbit sinoatrial node (SAN) computational model from Behar et al. (Behar et al., 2016). (A) SNS stimulation (top panel) increased heart rate over 60 seconds of stimulation. Shown in middle panel, change in time of simulated heart rates shows agreement with experimental data from (Wang et al., 2019) (n = 4). Right panel shows simulated peak heart rate during SNS stimulation agrees with experimental data from Ng et. al., 2001. (B) PNS stimulation (top panel) was applied for 60 seconds, and heart rate was predicted to decrease to ~140 bpm. Simulated minimum heart rate during PNS stimulation comparable to experimental data from (Ng et al., 2001) (right panel). (C) Simulation shows effect on heart rate when SNS stimulation was applied continuously and PNS stimulation was applied transiently for 60 s (top panel in C). Heart rate was reduced to ~200 bpm during PNS and then recovered following removal of PNS. AP firing dynamics during removal of PNS are shown in the right panel.
Figure 5:
Figure 5:
Simulated effects of sympathetic and parasympathetic stimulation on action potential duration (APD80) and Ca2+ transient (CaT) in the rabbit ventricular computational myocyte model during periodic constant pacing. Maximum and minimum amplitude (green lines in right panels) of calcium transients during the whole stimulation range are shown for each case. (A) SNS stimulation was applied at cycle length of 320 ms, and APD80 was decreased. (B) PNS stimulation was applied at cycle length of 320 ms. APD80 was unchanged from baseline. (C) Simulated SNS stimulation was applied throughout the simulation, while PNS stimulation was transiently applied after 20s. The model was paced at cycle length of 320ms. APD80 first decreased due to application of SNS stimulation and then increased after addition of PNS stimulation.
Figure 6:
Figure 6:
Simulated effects of sympathetic and parasympathetic stimulation on the full coupled cardiac system that includes the autonomic nervous system and sinoatrial node (SAN) cell model coupled to the rabbit ventricular cell model. Pacing frequency was determined by the rate generated by the SAN model. (A) In response to simulated SNS stimulation in the coupled model, predicted effects (red line) on ventricular APD80 agrees with experimental data from Wang et. al., 2019 (black open circle symbols) (n = 4). (B) Simulated PNS stimulation for 60s resulted in a model prediction showing APD80 slightly increased compared to baseline. (C) Shown are predictions where SNS stimulation was applied through the whole simulation, and PNS stimulation was transiently applied between 20 s and 80 s. Model predictions indicate that APD80 was decreased following SNS, and then partially recovered with PNS stimulation. (D) ICaL, IKs and IKr currents during the whole stimulation range for panel C. Maximum and minimum amplitude (green lines) of calcium transients during the whole stimulation range are shown in the right panels for each case.
Figure 7:
Figure 7:
Prediction from atom to the rhythm: A multiscale model to predict effects of sympathetic nerve stimulation (SNS) on sinoatrial node (SAN) cells and the coupled rabbit ventricular cell model. (A) All-atom enhanced sampling molecular dynamics (MD) simulations were used to study cationic norepinephrine (NE) binding (NE progression shown by red to blue thin molecules and their position over time as the molecule moves from binding site) to βAR (green ribbons) to compute the free energy profile as shown on the left of panel A. Predicted affinities and rates of βAR-NE interaction obtained from atomistic MD) simulations were used as parameters in the cell signaling cascade in the SAN and ventricular computational model. Comparison of kinetics from MD (kon = 6.7 μM−1s−1 and koff = 2.7 s−1) and experimental data (kon = 0.0034 μM−1s−1 and koff = 0.0012 s−1, (Xu et al., 2021) for bound βAR and cAMP concentration in cells are shown on right panel. (B) Pacing frequency was set to the rate generated by Behar-Yaniv SAN model. One-dimensional tissue (1.65 cm) simulations in baseline (no SNS or PNS stimulation) for 334 beats. A pseudo-ECG generated from the tissue simulation are shown in the left panel. The right panel shows predictions where SNS stimulation was applied through the whole simulation (100 seconds) along with transient simulated PNS stimulation between 20 s and 80 s. T-wave peaks are indicated by red dots. Three model generated electrograms from 20 s, 60 s and 90 s are shown in the bottom panel.
Figure 8:
Figure 8:
The electrical effects of simulation of transient exposure to a surge of SNS activity in both healthy (non-diseased) and diseased heart tissue models. The prediction shown was made in the ventricular cell model containing the combined Iancu-Soltis-Saucerman model. Pacing frequency was set to heart rate generated by Behar-Yaniv sinoatrial node (SAN) model. The dynamics of the action potential (Vm) are shown in the top panels, and calcium transient (Cai) profiles are shown in the bottom panels. Simulation showing electrical activity in non-diseased (A) and diseased ventricular cells (B) with no SNS stimulation and cessation of beating at 415 seconds. (C) A single spontaneous AP (red peak in middle) is triggered by delayed afterdepolarizations in a non-diseased heart, following SNS surge and cessation of beating at 415 seconds. (D) Simulations in a diseased heart (simulated heart failure) with the same protocol as in panel A result in prediction of emergence of multiple triggered afterdepolarizations.
Figure 9:
Figure 9:
Stimulation of the parasympathetic nervous system stimulation blocks the proarrhythmic effects of sympathetic surge (shown in Figure 8). Shown in a simulation of SNS surge in healthy versus diseased ventricular myocytes in response to SNS surge, but now with the addition of PNS stimulation at = 415 s. (A) PNS stimulation was predicted by the model to eliminate the triggered beat in a non-diseased heart. (B) Simulation of the PNS in a diseased heart (simulated heart failure) with the same protocol as in panel A resulted in suppression of triggered activity at 422 s.
Figure 10:
Figure 10:
Effects of transient exposure to PNS and SNS surge in simulated healthy (non-diseased) and diseased (simulated heart failure) one-dimensional cardiac tissues using a multiscale model that includes autonomic nerve stimulation on rabbit sinoatrial node (SAN) and ventricular cell models. Pacing frequency was set to heart rate generated by Behar-Yaniv SAN model, and we used predicted rates of βAR – NE interactions obtained from atomic simulations in the functional scale models. One-dimensional tissue (1.65 cm) with SNS was simulated for 1529 beats. For each set of panels, pseudo-ECGs is on top, voltage timecourse and calcium transient between t = 415 s and 420 s are on middle and bottom in blue. (A) Top: In the setting of overly active SNS in a healthy heart model, we ceased application of pacing stimuli at 415 seconds (the 1529th beat). We observed a spontaneous beat (red) that was triggered after cessation of pacing at t = 415 s (top panel). (B) Following the same protocol as in panel A, for diseased heart model, the extensive triggered activity was initiated. (C) With addition of PNS stimulation applied in the non-diseased model after t = 415 s, the triggered beat was suppressed (lower panel in A). (D) With addition of PNS stimulation (bottom panel in B), the triggered activity (red) terminated around 418 seconds in diseased model. Gray arrows indicate triggered action potentials, and Ca2+ transients on space-time representations of one-dimensional tissues.

Comment in

Similar articles

Cited by

References

    1. Aghasafari P, Yang P-C, Kernik DC, Sakamoto K, Kanda Y, Kurokawa J, Vorobyov I & Clancy CE. (2021). A deep learning algorithm to translate and classify cardiac electrophysiology. Elife 10, e68335. - PMC - PubMed
    1. Armour JA. (2004). Cardiac neuronal hierarchy in health and disease. Am J Physiol Regul Integr Comp Physiol 287, R262–271. - PubMed
    1. Barducci A, Bussi G & Parrinello M. (2008). Well-Tempered Metadynamics: A Smoothly Converging and Tunable Free-Energy Method. Physical Review Letters 100, 020603. - PubMed
    1. Beaumont E, Salavatian S, Southerland EM, Vinet A, Jacquemet V, Armour JA & Ardell JL. (2013). Network interactions within the canine intrinsic cardiac nervous system: implications for reflex control of regional cardiac function. J Physiol 591, 4515–4533. - PMC - PubMed
    1. Behar J, Ganesan A, Zhang J & Yaniv Y. (2016). The Autonomic Nervous System Regulates the Heart Rate through cAMP-PKA Dependent and Independent Coupled-Clock Pacemaker Cell Mechanisms. Front Physiol 7, 419. - PMC - PubMed

Publication types