. 2023 Jul 17:17:1232541.
doi: 10.3389/fncel.2023.1232541. eCollection 2023.

Variance analysis as a method to predict the locus of plasticity at populations of non-uniform synapses

Affiliations

Variance analysis as a method to predict the locus of plasticity at populations of non-uniform synapses

Lucas B Lumeij et al. Front Cell Neurosci. .

Abstract

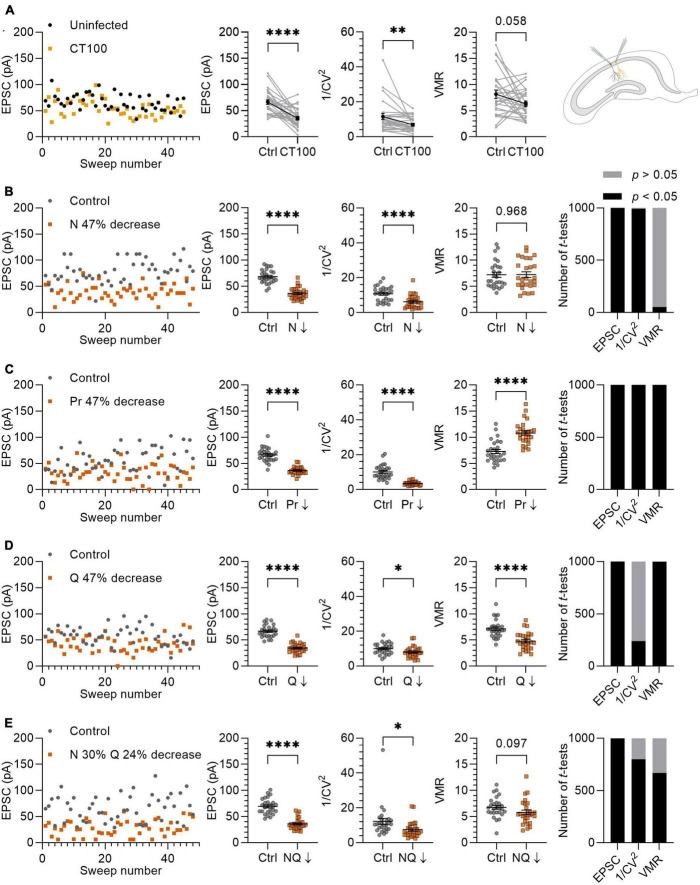
Our knowledge on synaptic transmission in the central nervous system has often been obtained by evoking synaptic responses to populations of synapses. Analysis of the variance in synaptic responses can be applied as a method to predict whether a change in synaptic responses is a consequence of altered presynaptic neurotransmitter release or postsynaptic receptors. However, variance analysis is based on binomial statistics, which assumes that synapses are uniform. In reality, synapses are far from uniform, which questions the reliability of variance analysis when applying this method to populations of synapses. To address this, we used an in silico model for evoked synaptic responses and compared variance analysis outcomes between populations of uniform versus non-uniform synapses. This simulation revealed that variance analysis produces similar results irrespectively of the grade of uniformity of synapses. We put this variance analysis to the test with an electrophysiology experiment using a model system for which the loci of plasticity are well established: the effect of amyloid-β on synapses. Variance analysis correctly predicted that postsynaptically produced amyloid-β triggered predominantly a loss of synapses and a minor reduction of postsynaptic currents in remaining synapses with little effect on presynaptic release probability. We propose that variance analysis can be reliably used to predict the locus of synaptic changes for populations of non-uniform synapses.

Keywords: amyloid–beta; excitatory postsynaptic current (EPSC); hippocampus; synapse; uniformity; variance.


Conflict of interest statement

The authors declare that the research was conducted in the absence of any commercial or financial relationships that could be construed as a potential conflict of interest.

Figures

FIGURE 1
FIGURE 1
Non-uniform in silico populations of synapses do not affect variance analysis outcomes. (A–D) Left panel: example traces of summated EPSC amplitudes of 15 stimulated synapses per sweep of one in silico neuron. Right panels: average EPSC, 1/CV2 and VMR (n = 27 neurons). (A) Both Pr (0.3 ± 0) and Q (15 ± 0 pA) uniform across synapses (grey). (B) Pr (0.3 ± 0.15) non-uniform and Q uniform (15 ± 0 pA) across synapses (yellow). (C) Pr (0.3 ± 0) uniform and Q (15 ± 4.5 pA) non-uniform across synapses (orange). (D) Both Pr (0.3 ± 0.15) and Q (15 ± 4.5 pA) non-uniform across synapses (red). (E) Log2 values of 1/CV2 and VMR for all four conditions normalized to their expected values. Statistics: normalized values were compared to 0 using multiple t-tests with a Holm-Šídák correction and to each other by one-way ANOVAs. Error bars indicate SEM.
FIGURE 2
FIGURE 2
Changes in N lead to similar variance analysis outcomes in both uniform and non-uniform in silico populations of synapses. (A–C) Left panels: effects of changes in number of synapses (N) on average EPSC (A), 1/CV2 (B), and VMR (C) in uniform (grey circles) and non-uniform (red squares) populations. Right panel: average log2 values of EPSC (A), 1/CV2 (B), and VMR (C) normalized to expected values of uniform (grey circles) and non-uniform populations (red squares). For uniform populations Pr = 0.3 ± 0 and Q = 15 ± 0 pA; for non-uniform populations Pr = 0.3 ± 0.15 and Q = 15 ± 4.5 pA (n = 27). Statistics: effect of number of synapses on average EPSC, 1/CV2 and VMR values (left panels) were tested using one-way ANOVAs. Normalized values were compared to 0 and between uniform and non-uniform using multiple t-tests with a Holm-Šídák correction. Error bars indicate SEM; ****p < 0.0001.
FIGURE 3
FIGURE 3
Changes in Pr lead to similar variance analysis outcomes in both uniform and non-uniform in silico populations of synapses. (A–C) Left panels: effects of changes in release probability (Pr) on average EPSC (A), 1/CV2 (B), and VMR (C) in uniform (grey circles) and non-uniform (red squares) populations. Right panel: average log2 values of EPSC (A), 1/CV2 (B), and VMR (C) normalized to expected values of uniform (grey circles) and non-uniform populations (red squares). For all populations N = 15 and Q = 15 pA; in uniform populations SDs of Pr and Q were 0; in non-uniform populations SDs of Pr were 0.15 (0.14 for Pr = 0.2 and 0.8) and SDs of Q were 4.5 pA (n = 27). Statistics: effect of release probability on average EPSC, 1/CV2 and VMR values (left panels) were tested using one-way ANOVAs. Normalized values were compared to 0 and between uniform and non-uniform using multiple t-tests with a Holm-Šídák correction. Error bars indicate SEM; **p < 0.01, ****p < 0.0001.
FIGURE 4
FIGURE 4
Changes in Q lead to similar variance analysis outcomes in both uniform and non-uniform in silico populations of synapses. (A–C) Left panels: effects of changes in quantal size (Q) on average EPSC (A), 1/CV2 (B), and VMR (C) in uniform (grey circles) and non-uniform (red squares) populations. Right panel: average log2 values of EPSC (A), 1/CV2 (B), and VMR (C) normalized to expected values of uniform (grey circles) and non-uniform (red squares) populations. For all populations N = 15 and Pr = 0.3; in uniform populations SDs of Pr and Q were 0; in non-uniform populations SDs of Pr were 0.15 and SDs of Q were 4.5 pA (2.5 pA for Q = 5 pA) (n = 27). Statistics: effect of quantal size on average EPSC, 1/CV2 and VMR values (left panels) were tested using one-way ANOVAs. Normalized values were compared to 0 and between uniform and non-uniform using multiple t-tests with a Holm-Šídák correction. Error bars indicate SEM; ****p < 0.0001.
FIGURE 5
FIGURE 5
Variance analysis predicts the effects of Aβ on synapses. (A) Left panel: example traces of EPSCs from uninfected neuron (black circles) and infected neighboring neuron expressing APPCT100 (yellow squares). Middle panels: with averages of EPSC, 1/CV2 and VMR in uninfected neurons and their neighboring APPCT100-infected neurons. Right panel: schematic representation of two CA1 neurons (uninfected and infected) that are recorded simultaneously. (B–E) Left panel: example traces of in silico control neuron (grey circles; N = 10, Pr = 0.46 ± 0.23, Q = 15 ± 4.5 pA) and test neuron in which N, Pr, and Q are changed to achieve a ∼47% reduction in EPSC amplitude (orange squares). Middle panels: averages of EPSC, 1/CV2 and VMR between control and test neurons (n = 27). Right panel: simulations were run 1,000 times and differences in EPSC, 1/CV2 and VMR were assessed using t-tests and checked for statistical significance. (B) N is reduced by ∼47% (N = 5); Pr and Q are unchanged compared to control. (C) Pr is reduced by 47% (Pr = 0.24 ± 0.15); N and Q are unchanged compared to control. (D) Q is reduced by 47% (Q = 7.95 ± 4.5 pA); N and Pr are unchanged compared to control. (E) N is decreased by 30% (N = 7) and Q is decreased by 24% (Q = 11.36 ± 4.5 pA), Pr is unchanged compared to the control. Statistics: paired t-test (A); unpaired t-test (B–D). Error bars indicate SEM; *p < 0.05; **p < 0.01, ****p < 0.0001.

Similar articles

Cited by

References

    1. Barthet G., Mulle C. (2020). Presynaptic failure in Alzheimer’s disease. Prog. Neurobiol. 194:101801. 10.1016/j.pneurobio.2020.101801 - DOI - PubMed
    1. Bekkers J. M., Stevens C. F. (1990). Presynaptic mechanism for long-term potentiation in the hippocampus. Nature 346 724–729. 10.1038/346724a0 - DOI - PubMed
    1. Brock J. A., Thomazeau A., Watanabe A., Li S. S. Y., Sjöström P. J. (2020). A practical guide to using CV analysis for determining the locus of synaptic plasticity. Front. Synaptic Neurosci. 12:11. 10.3389/fnsyn.2020.00011 - DOI - PMC - PubMed
    1. Christie J. M., Jahr C. E. (2006). Multivesicular release at Schaffer collateral-CA1 hippocampal synapses. J. Neurosci. 26 210–216. 10.1523/JNEUROSCI.4307-05.2006 - DOI - PMC - PubMed
    1. Conti R., Lisman J. (2003). The high variance of AMPA receptor-and NMDA receptor-mediated responses at single hippocampal synapses: Evidence for multiquantal release. Proc. Natl. Acad. Sci. U.S.A. 100 4885–4890. - PMC - PubMed

LinkOut - more resources