. 2023 Feb 14:4:e3.
doi: 10.1017/qrd.2023.1. eCollection 2023.

Mouth breathing, dry air, and low water permeation promote inflammation, and activate neural pathways, by osmotic stresses acting on airway lining mucus

Affiliations

Mouth breathing, dry air, and low water permeation promote inflammation, and activate neural pathways, by osmotic stresses acting on airway lining mucus

David A Edwards et al. QRB Discov. .

Abstract

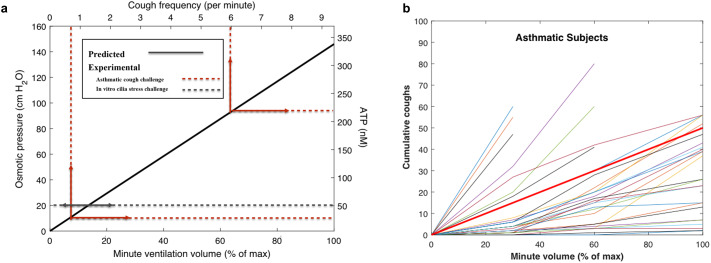
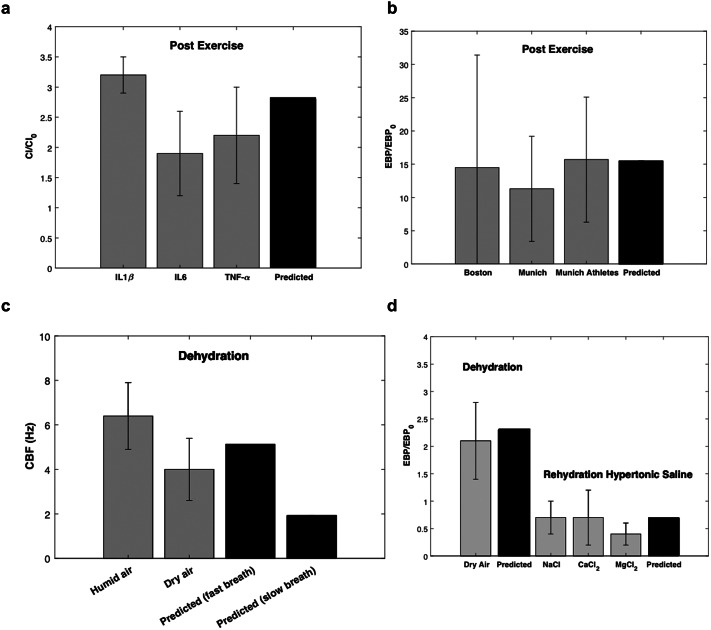
Respiratory disease and breathing abnormalities worsen with dehydration of the upper airways. We find that humidification of inhaled air occurs by evaporation of water over mucus lining the upper airways in such a way as to deliver an osmotic force on mucus, displacing it towards the epithelium. This displacement thins the periciliary layer of water beneath mucus while thickening topical water that is partially condensed from humid air on exhalation. With the rapid mouth breathing of dry air, this condensation layer, not previously reported while common to transpiring hydrogels in nature, can deliver an osmotic compressive force of up to around 100 cm H2O on underlying cilia, promoting adenosine triphosphate secretion and activating neural pathways. We derive expressions for the evolution of the thickness of the condensation layer, and its impact on cough frequency, inflammatory marker secretion, cilia beat frequency and respiratory droplet generation. We compare our predictions with human clinical data from multiple published sources and highlight the damaging impact of mouth breathing, dry, dirty air and high minute volume on upper airway function. We predict the hypertonic (or hypotonic) saline mass required to reduce (or amplify) dysfunction by restoration (or deterioration) of the structure of ciliated and condensation water layers in the upper airways and compare these predictions with published human clinical data. Preserving water balance in the upper airways appears critical in light of contemporary respiratory health challenges posed by the breathing of dirty and dry air.

Keywords: chronic cough; dehydration; hypertonic saline; mucus; respiratory droplets.


Conflict of interest statement

D.A.E. is a cofounder and shareholder of Sensory Cloud Inc. and a cofounder (while not a shareholder) of Pulmatrix. Each of these companies advances science, technology, and products for consumer health or therapeutic use by the inhalation of aerosols.

Figures

None
Graphical abstract
Fig. 1.
Fig. 1.
(a) Basic one-dimensional airway-lining-fluid geometry, steady-state, time-averaged water fluxes, and osmotic mucus force consequent to the encounter with relatively dry air. The flux of water through the mucus hydrogel (Qeχ) is proportional to the dehydration factor χ representing the degree to which the superficial layer of water above the mucus hydrogel that supplies evaporative water on inhalation is not restored on condensation of super-saturated water during exhalation. (b) Signalling pathways triggered by dehydration as associated with cilia-compression-activated adenosine triphosphate release.
Fig. 2.
Fig. 2.
(a) Time-averaged condensation layer thickness as a function of the normalised epithelial (red) and mucus (blue) permeabilities in conditions of fast (T = 1 s) breathing of dry (10% RH) air via the nose (solid lines) or mouth (dashed lines) at rest or exercise. (b) Time-averaged normalised concentration as a function of the normalised epithelial (Black) and mucus (blue) permeabilities in conditions of fast (T = 1 s) breathing of dry (10% RH) air via the nose (solid lines) or mouth (dashed lines) at rest or exercise.
Fig. 3.
Fig. 3.
Predicted and experimentally measured (as reported by Button et al., ; Fowles et al., 2017) relationships between minute volume, adenosine triphosphate (ATP) concentration in the airways and cough incidence. (a) Predicted (solid Black line) time-averaged steady-state osmotic pressure force acting on the PCL as a function of minute volume (with maximum assumed minute volume of 200 l min−1). The predicted linear relationship between osmotic pressure and ATP concentration is based on the first-order approximate expression Eq. (6) with αB = αATP ~ 245 cm2 mg−1 determined by the measured ATP extracellular concentration (50 nm) and compressive force (20-cm H2O) reported in Button et al. (2013). The predicted linear relationship between (asthmatic airway) CF and ATP concentration is based on the first-order approximate expression Eq. (7) where the unity coefficient is determined by fit of Eq. (7) to the measured CF observed at the two ATP levels shown by the dotted red line by Fowles et al. (2017) on topical delivery of ATP at the estimated ALF concentrations depicted in the figure, with the airway lining fluid concentrations being estimated by the delivery efficiencies reported elsewhere (Schlesinger and Lippmann, ; Khan et al., 2005). (b) Cough incidence (number of coughs) versus minute volume as a percentage of maximum minute volume following the deep breathing of dry air. Experimental data are as reported by Purokivi et al. (2011) for asthmatic subjects, and the prediction (thick red line) is based on Eq. (7) (Fig. 3a) without fitted parameters.
Fig. 4.
Fig. 4.
(a) Post-exercise exhaled inflammatory marker concentration (CI) relative to pre-exercise. Data represent mean values (grey boxes) with standard deviations reported from Osaka study (Tatsuya et al., 2011). Prediction (Black box) is based on Eq. (36) of the Supplementary Material in the case of exercise (Table 2). (b). Post-exercise exhaled breath particles (EBPs) relative to pre-exercise. Data represent mean values (grey boxes) and standard deviations as reported from the Boston study (George et al., 2022), the Munich study (all participants) (Mutsch et al., 2022) and the Munich study (seasoned athletes only) (Mutsch et al., 2022). Prediction (Black box) is based on Eq. (38) of the Supplementary Material in the case of exercise (Table 2). (c) Cilia beat frequency post exposure to dry air (with isotonic saline) or perfectly humid air in patients following tracheotomy as reported by Birk et al. (2017). Prediction (Black box) and standard deviation is based on the dry air (10% RH) mouth-breathing case of Table 2 with maximum of 20 and a minimum of 6 breaths per minute (i.e. 1 or 5 s inhalation times). (d) EBP post exposure to dry air (10% RH) relative to EBP in humid room conditions (40–50% RH) (Dehydration) (grey box) and following the delivery of 5% hypertonic saline to the upper airways (Rehydration) (grey boxes). Data represent mean values and standard deviation as reported from the Cambridge study (Reihill et al., 2021). Prediction is based on Eq. (38) of the Supplementary Material in the case of fully hydrated airway lining fluid [equivalent to the case of slow (T = 5 s) nose breathing].

References

    1. Abdulqawi R, Dockry R, Holt K, Layton G, McCarthy BG, Ford AP and Smith JA (2015) P2X3 receptor antagonist (AF-219) in refractory chronic cough: A randomised, double-blind, placebo-controlled phase 2 study. Lancet 385(9974), 1198–1205. 10.1016/S0140-6736(14)61255-1 - DOI - PubMed
    1. Anderson JL and Malone DM (1974) Mechanism of osmotic flow in porous membranes. Biophysical Journal 14(12), 957–982. 10.1016/S0006-3495(74)85962-X - DOI - PMC - PubMed
    1. Barbet JP, Chauveau M, Labbe S and Lockhart A (1988) Breathing dry air causes acute epithelial damage and inflammation of the Guinea pig trachea. Journal of Applied Physiology 64, 1851–1857. - PubMed
    1. Birk R, Händel A, Wenzel A, Kramer B, Aderhold C, Hörmann K, Stuck BA and Sommer JU (2017) Heated air humidification versus cold air nebulization in newly tracheostomized patients. Head & Neck 39(12), 2481–2487. 10.1002/hed.24917 - DOI - PMC - PubMed
    1. Boucher RC (2007) Airway surface dehydration in cystic fibrosis: Pathogenesis and therapy. Annual Review of Medicine 58, 157–170. 10.1146/annurev.med.58.071905.105316 - DOI - PubMed

LinkOut - more resources