. 2023 Jun 28;26(8):107227.
doi: 10.1016/j.isci.2023.107227. eCollection 2023 Aug 18.

Federated generalized linear mixed models for collaborative genome-wide association studies

Affiliations

Federated generalized linear mixed models for collaborative genome-wide association studies

Wentao Li et al. iScience. .

Abstract

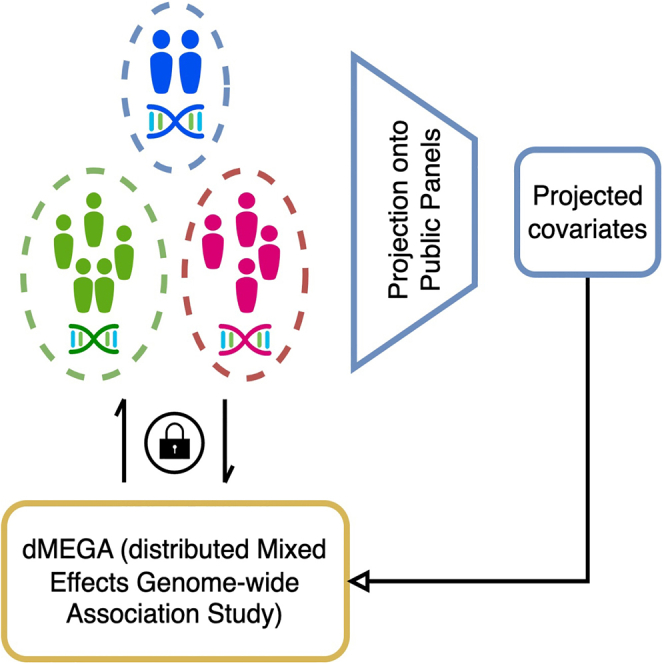
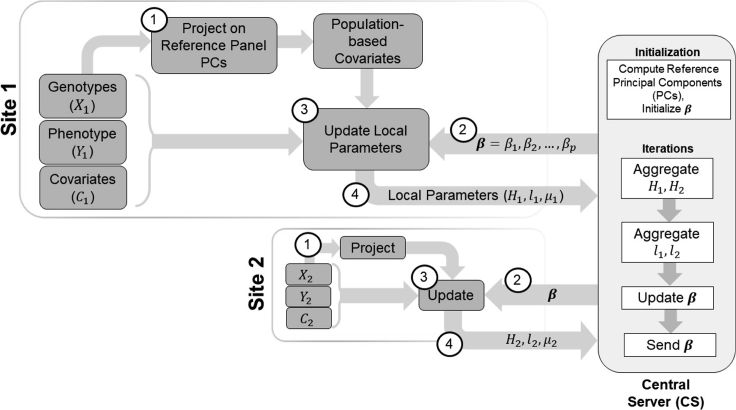
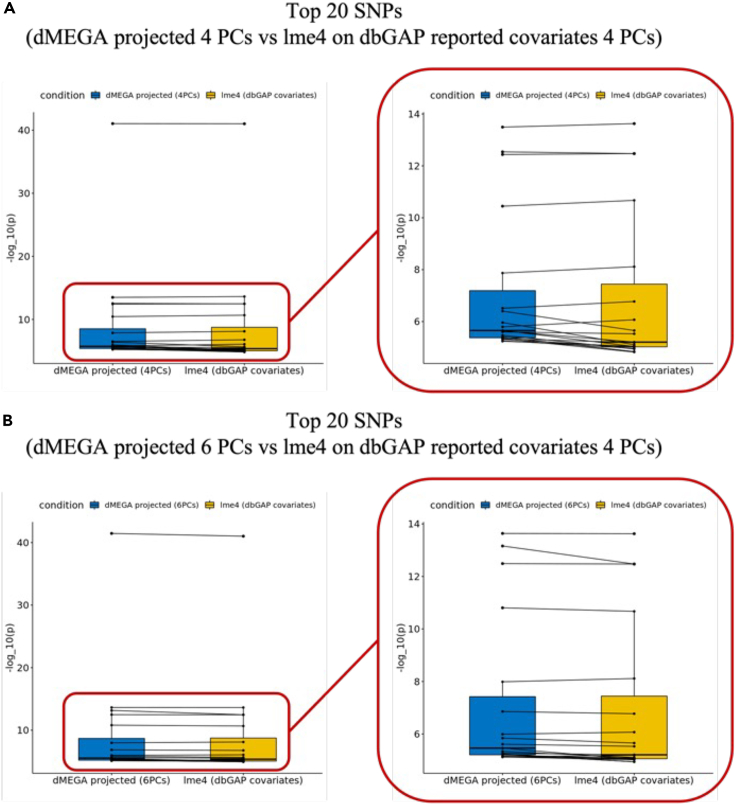
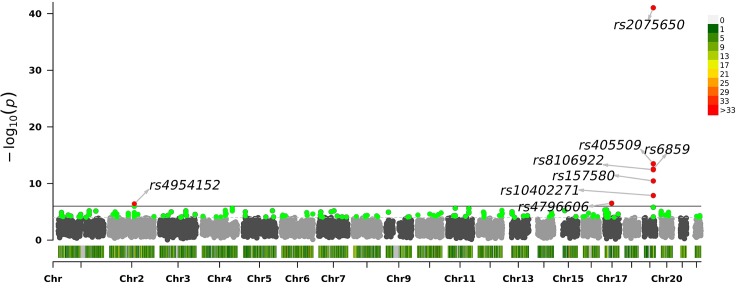
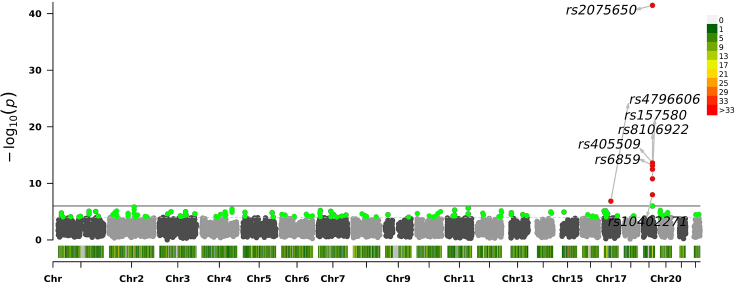
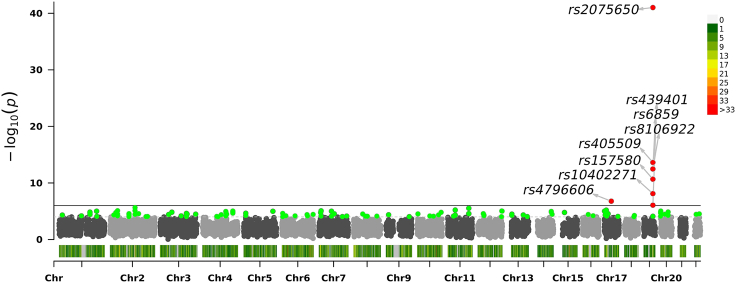
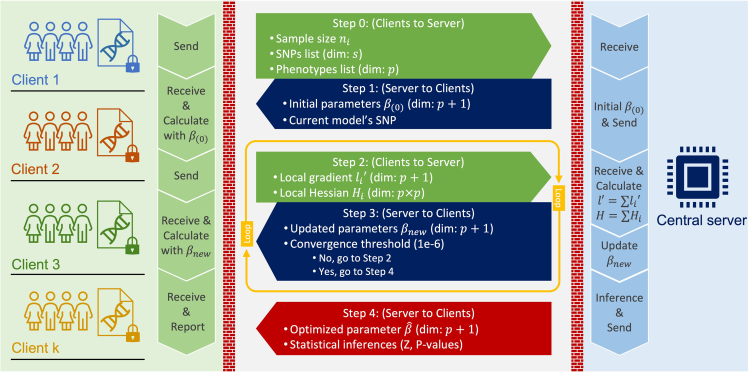
Federated association testing is a powerful approach to conduct large-scale association studies where sites share intermediate statistics through a central server. There are, however, several standing challenges. Confounding factors like population stratification should be carefully modeled across sites. In addition, it is crucial to consider disease etiology using flexible models to prevent biases. Privacy protections for participants pose another significant challenge. Here, we propose distributed Mixed Effects Genome-wide Association study (dMEGA), a method that enables federated generalized linear mixed model-based association testing across multiple sites without explicitly sharing genotype and phenotype data. dMEGA employs a reference projection to correct for population-stratification and utilizes efficient local-gradient updates among sites, incorporating both fixed and random effects. The accuracy and efficiency of dMEGA are demonstrated through simulated and real datasets. dMEGA is publicly available at https://github.com/Li-Wentao/dMEGA.

Keywords: Clinical genetics; Genomics; Health sciences; Human genetics.


Conflict of interest statement

The authors declare no competing interests.

Figures

None
Graphical abstract
Figure 1
Figure 1
Illustration of federated association testing workflow for two sites named Site-1 and Site-2 Each site holds genotype, phenotype, and covariate datasets. Each site first downloads the reference panel principal components (PCs) and projects the genotypes to generate the population-based covariates (Step 1). Next, the initial parameters are downloaded from the central server (CS) (Step 2). Using the local genotype, phenotype, and merged covariate data, each site updates the local parameters (Step 3) and sends them to CS (Step 4). After receiving the local parameters from both sites, CS aggregates the parameters and sends the updates parameters to all sites. Steps 2, 3, and 4 are performed until the model converges. Step 1 is performed only once at the before iterations.
Figure 2
Figure 2
Comparison of most significant variant concordance between projection-based population stratification and PCA-based stratification among 100 simulated GWAS (A) The comparison of significant variant concordance for matching population panels. X axis shows the number of top variants. Y axis shows the concordance fraction. Blue boxplots depict the concordance between projection-based stratification and PCA-based stratification. Red boxplots show the concordance between GWAS with no population stratification and GWAS with PCA-based stratification. (B) Concordance of most significant variants when projection is performed with a mismatching set of reference populations.
Figure 3
Figure 3
Scatterplots of p values from two comparisons (A) Scatterplot of p values from comparison 1. (B) Scatterplot of p values from comparison 2. The lme4 baseline models experimented with 4PCs dbGAP reported covariates.
Figure 4
Figure 4
SNP ranking concordance between lme4 and dMEGA (A) Paired boxplot of comparison 1. (B) Paired boxplot of comparison 2. The lme4 baseline models experimented with 4PCs dbGAP reported covariates.
Figure 5
Figure 5
Association significance of SNPs scored by dMEGA with projected datasets on 4 PCs Manhattan plot shows the chromosomes on x axis and log10(pvalue) on the y axis. Each dot corresponds to an SNP.
Figure 6
Figure 6
Association significance of SNPs scored by dMEGA with projected datasets on 6 PCs Manhattan plot shows the chromosomes on x axis and log10(pvalue) on the y axis. Each dot corresponds to an SNP.
Figure 7
Figure 7
Association significance of SNPs scored by lme4 with 4 dbGAP reported PCs Manhattan plot shows the chromosomes on x axis and log10(pvalue) on the y axis. Each dot corresponds to an SNP.
Figure 8
Figure 8
Diagram of federated GLMM inference in dMEGA

Similar articles

Cited by

References

    1. Christensen K.D., Dukhovny D., Siebert U., Green R.C. Assessing the costs and cost-effectiveness of genomic sequencing. J. Personalized Med. 2015;5:470–486. - PMC - PubMed
    1. Sboner A., Mu X.J., Greenbaum D., Auerbach R.K., Gerstein M.B. The real cost of sequencing: higher than you think. Genome Biol. 2011;12:125. - PMC - PubMed
    1. All of Us Research Program Investigators. Denny J.C., Rutter J.L., Goldstein D.B., Philippakis A., Smoller J.W., Jenkins G., Dishman E. The “all of us” research program. N. Engl. J. Med. 2019;381:668–676. - PMC - PubMed
    1. Palsson G., Rabinow P. Iceland: the case of a national human genome project. Anthropol. Today. 1999;15:14–18. - PubMed
    1. Sudlow C., Gallacher J., Allen N., Beral V., Burton P., Danesh J., Downey P., Elliott P., Green J., Landray M., et al. UK biobank: an open access resource for identifying the causes of a wide range of complex diseases of middle and old age. PLoS Med. 2015;12 - PMC - PubMed

LinkOut - more resources