

What Do United States Adolescents Eat? Food Group Consumption Patterns and Dietary Diversity from a Decade of Nationally Representative Data
- PMID: 37529118
- PMCID: PMC10388726
- DOI: 10.1016/j.cdnut.2023.101968
What Do United States Adolescents Eat? Food Group Consumption Patterns and Dietary Diversity from a Decade of Nationally Representative Data
Abstract
Background: Although the importance of adolescent nutrition has gained attention in the global nutrition community, there is a gap in research focused on adolescent dietary diversity and food group consumption.
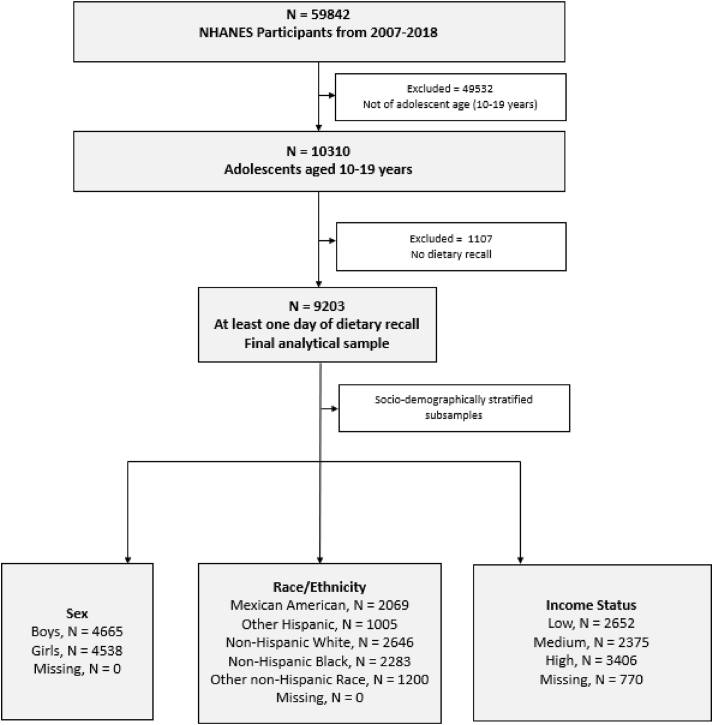
Objectives: This study aimed to characterize population-level food group consumption patterns and quantify the extent of dietary diversity among United States adolescents using a large nationally representative sample of adolescents aged 10-19 y.
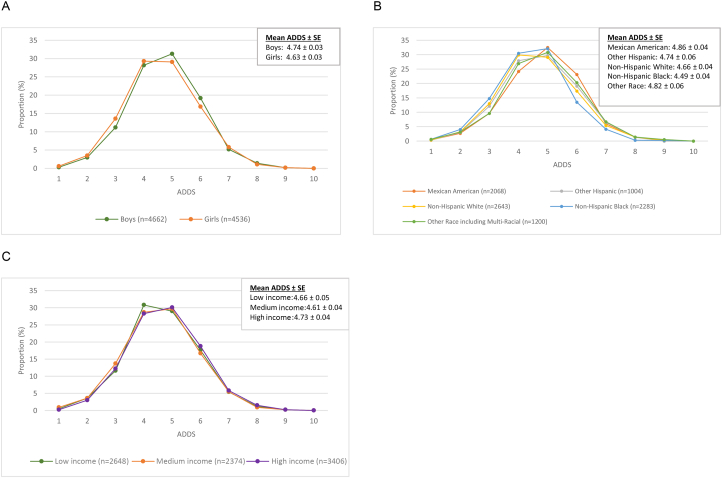
Methods: We used 24-h dietary recall data from the National Health and Nutrition Examination Survey (NHANES) from 2007 to 2018 to construct the 10 food groups comprising the minimum dietary diversity for women (MDD-W) indicator and estimated the prevalence of intake of each food group. A composite metric adolescent dietary diversity score (ADDS) was derived for each adolescent where 1 point was awarded per food group. Both population scores and the distribution of individual scores were estimated. Differences in proportions of food groups consumed across sociodemographic categories were tested using the Rao-Scott χ2 test, and pairwise comparisons were expressed as population prevalence differences and prevalence ratios.
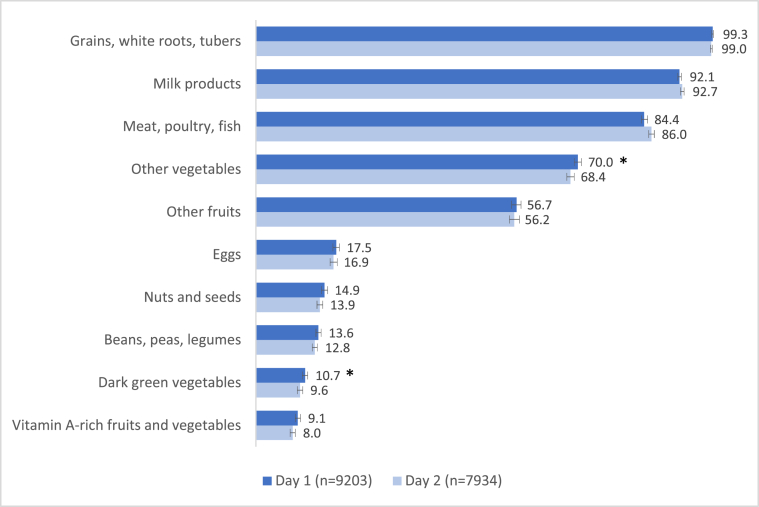
Results: Food group consumption patterns were very similar across 2 d of dietary recall but varied significantly by sex, race/ethnicity, and income status. The food groups with the highest prevalence of consumption were grains, white, roots, and tubers (∼99%), milk products (∼92%), and meat, poultry, and fish (∼85%), whereas <15% of adolescents consumed key micronutrient-dense foods, such as vitamin A-rich fruits and vegetables and dark green vegetables. The mean ADDS was 4.69, with modest variation across strata.
Conclusions: On average, United States youth consumed fewer than 5 food groups on a given day. The lack of dietary variety and relatively low prevalence of consumption of several micronutrient-rich plant-based foods could pose a risk for adolescents' ability to achieve micronutrient adequacy in the United States.
Keywords: United States adolescents; dietary diversity; food group consumption patterns.
© 2023 The Author(s).
Figures
Similar articles
-
Dietary Variation among Children Meeting and Not Meeting Minimum Dietary Diversity: An Empirical Investigation of Food Group Consumption Patterns among 73,036 Children in India.J Nutr. 2020 Oct 12;150(10):2818-2824. doi: 10.1093/jn/nxaa223. J Nutr. 2020. PMID: 32805040 Free PMC article.
-
Dietary Diversity and Nutritional Status of Adolescents in Rural Ghana.Nutr Metab Insights. 2023 Mar 10;16:11786388231158487. doi: 10.1177/11786388231158487. eCollection 2023. Nutr Metab Insights. 2023. PMID: 36923452 Free PMC article.
-
Maternal dietary diversity during lactation and associated factors in Palghar district, Maharashtra, India.PLoS One. 2021 Dec 29;16(12):e0261700. doi: 10.1371/journal.pone.0261700. eCollection 2021. PLoS One. 2021. PMID: 34965269 Free PMC article.
-
Characteristics of Global Data on Adolescent's Dietary Intake: A Systematic Scoping Review.Curr Dev Nutr. 2023 Dec 1;8(1):102054. doi: 10.1016/j.cdnut.2023.102054. eCollection 2024 Jan. Curr Dev Nutr. 2023. PMID: 38230349 Free PMC article.
-
Consumption of Mexican Food by U.S. Children and Adolescents: What We Eat in America, NHANES 2017 – March 2020.2024 Dec. In: FSRG Dietary Data Briefs [Internet]. Beltsville (MD): United States Department of Agriculture (USDA); 2010–. Dietary Data Brief No. 63. 2024 Dec. In: FSRG Dietary Data Briefs [Internet]. Beltsville (MD): United States Department of Agriculture (USDA); 2010–. Dietary Data Brief No. 63. PMID: 39808057 Free Books & Documents. Review.
Cited by
-
Comparison Between Two Divergent Diets, Mediterranean and Western, on Gut Microbiota and Cognitive Function in Young Sprague Dawley Rats.Gut Microbes Rep. 2024;1(1):1-21. doi: 10.1080/29933935.2024.2439490. Epub 2024 Dec 18. Gut Microbes Rep. 2024. PMID: 39916748
-
Nutrient Inadequacy Rates Among Japanese Adolescents Aged 10-14: Cross-Sectional Pooled Analysis From 2018 to 2023 (NICE EVIDENCE Study 5).J Nutr Metab. 2025 Jul 24;2025:5568303. doi: 10.1155/jnme/5568303. eCollection 2025. J Nutr Metab. 2025. PMID: 40746918 Free PMC article.
References
-
- 2015-2020 Dietary Guidelines for Americans. 8th Edition [Internet]. U.S. Department of Health and Human Services and U.S. Department of Agriculture; 2015. https://health.gov/our-work/nutrition-physical-activity/dietary-guidelin... [cited 21 November 2022]. Available from:
-
- 2020-2025 Dietary Guidelines for Americans. 9th Edition[Internet]. U.S. Department of Health and Human Services and U.S. Department of Agriculture; 2020. https://www.dietaryguidelines.gov/ [cited 21 November 2022]. Available from:
LinkOut - more resources
Full Text Sources
Miscellaneous
