Review
. 2023 Jul 17:10:1161779.
doi: 10.3389/fcvm.2023.1161779. eCollection 2023.

Quantitative aortography for assessment of aortic regurgitation in the era of percutaneous aortic valve replacement

Affiliations
Review

Quantitative aortography for assessment of aortic regurgitation in the era of percutaneous aortic valve replacement

Mahmoud Abdelshafy et al. Front Cardiovasc Med. .

Abstract

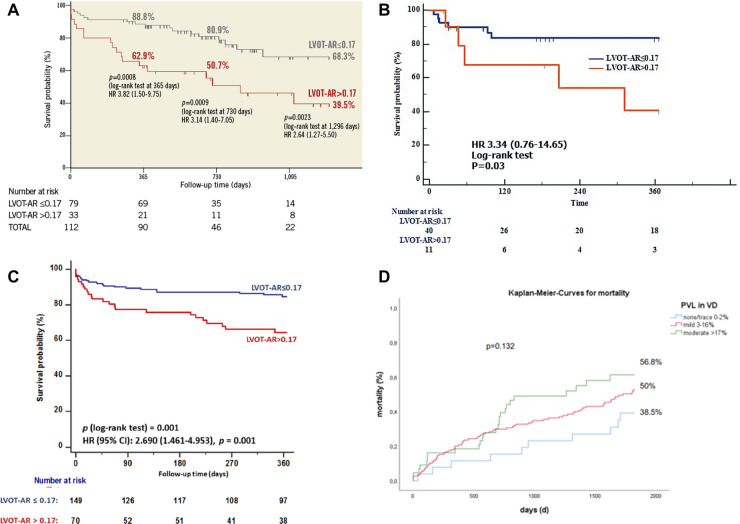
Paravalvular leak (PVL) is a shortcoming that can erode the clinical benefits of transcatheter valve replacement (TAVR) and therefore a readily applicable method (aortography) to quantitate PVL objectively and accurately in the interventional suite is appealing to all operators. The ratio between the areas of the time-density curves in the aorta and left ventricular outflow tract (LVOT-AR) defines the regurgitation fraction (RF). This technique has been validated in a mock circulation; a single injection in diastole was further tested in porcine and ovine models. In the clinical setting, LVOT-AR was compared with trans-thoracic and trans-oesophageal echocardiography and cardiac magnetic resonance imaging. LVOT-AR > 17% discriminates mild from moderate aortic regurgitation on echocardiography and confers a poor prognosis in multiple registries, and justifies balloon post-dilatation. The LVOT-AR differentiates the individual performances of many old and novel devices and is being used in ongoing randomized trials and registries.

Keywords: aortic regurgitation; paravalvular leak; quantitative aortography; transcatheter aortic valve implantation; transcatheter aortic valve replacement; videodensitometry.


Conflict of interest statement

PWS reports personal fees from Philips/Volcano, SMT, Novartis, Xeltis, Merillife. PCR has no conflict of interest. Aben is an employee of Pie Medical Imaging. MC is employed by and holds shares of Xeltis BV CS is an employee of Philips Healthcare. MA-W reports other from Medtronic, other from Boston Scientific, outside the submitted work. NP is a consultant to Medtronic, Peijia, and MicroPort. RM is an employee of Boston Scientific. AR reports grants and personal fees from Boston Scientific, personal fees from Edwards Lifesciences, outside the submitted work. KK reports personal fees from Abbott, personal fees from Boston Scientific, personal fees from Edwards Lifesciences, personal fees from Medtronic, personal fees from Meril Life Sciences, outside the submitted work. NVR reports grants and personal fees from Abbott, grants from Philips, grants from Biotronik, and personal fees from Microport, outside the submitted work. Rudolph is a proctor, speaker’s honoraria of JenaValve. FJN reports personal fees from Amgen, personal fees from Boehringer Ingelheim, personal fees from Daiichi Sankyo, grants and personal fees from Pfizer, grants and personal fees from Biotronic, grants and personal fees from Edwards Lifesciences, grants from Medtronic, grants and personal fees from Bayer Healthcare, personal fees from Novartis, grants from GlaxoSmithKline, grants and personal fees from Boston Scientific, personal fees from Ferrer, outside the submitted work. IJA-S is a proctor for Medtronic, Boston Scientific and Meril Life. OS and YO report several institutional research grants, outside the submitted work. The remaining authors declare that the research was conducted in the absence of any commercial or financial relationships that could be construed as a potential conflict of interest.

Figures

Figure 1
Figure 1
Video-densitometric assessment of an egg-shaped plastic phantom filled with radiopaque contrast medium rotated in an x-ray field from short (0, 180 degree) to long axis view (90 degree). [Modified From Kawashima, et al. (6)].
Figure 2
Figure 2
(A) Trace of aortic regurgitation (upper left panel) just after contrast injection. Later, the contrast-filled descending aorta overlaps the LV (upper right panel), causing a spurious increase in contrast density and colour-density map. (B) time-density curves (TDC) of qRA index (left)and LVOT-AR. (right panel). [see text, modified from Tateishi, et al. (8)].
Figure 3
Figure 3
ROC curve of LVOT-AR corresponding to greater than mild post-TAVR AR on intra-procedural TTE (A) and TEE (E). LVOT-AR values (median and quartiles) post-TAVR correlated to four categories of regurgitation on TTE (B) and TTE (F). (C,D) circumferential extent (CE %) of different degrees of AR on TEE and Linear regression of LVOT-AR with CE % [modified from Tateishi, et al. (15) and Abdelghani, et al. (14)].
Figure 4
Figure 4
Individual LVOT-AR serial changes before and after balloon post-dilatation. At 4 years, in patients with LVOT-AR > 17%, 7 deaths (34%) occurred, whereas in patients with VD-AR ≤ 17%, 8 deaths (19%) were observed [modified from Miyazaki et al. (17)].
Figure 5
Figure 5
Central illustration. Kaplan-Meier estimates of cumulative survival after TAVR at 30 days, 1 year four years and five years stratified according to the degree of LVOT-AR. Compiled illustration (A,B) from Tateishi et al. (8, 15) (C) from Abdelghani, et al. (14) and (D) from Bad Krozingen TAVI cohort [partially unpublished data (16)].
Figure 6
Figure 6
Overlap of either outflow tract (A) or ascending aorta (G) on descending aorta visualized by MSCT [heart navigator software (A) or 3mensio software (G)] and by aortography, invalidating the video-densitometric assessment (C,I). Further rotation either toward LAO (D) or RAO (J) resolves the overlapping issue (F,L). (D,E,K) use of intravascular catheter to avoid overlapping [Teng's rule (22), see text].
Figure 7
Figure 7
(A,B) S curves (mean and 95% C) for optimal acquisition, showing the continuity (S-green curve) of the angiographic projections (n = 92) in which the aortic cusps remain aligned and perpendicular to the x-ray beam. One single angiographic view provides optimization of projection for assessment of aortic regurgitation and aligned aortic cusps. Alternative fluoroscopic view with x-ray gantry angled caudally is shown by a blue circle. [Reproduced with permission from Dr Tateishi, et al. (21) and from the Circulation journal].
Figure 8
Figure 8
Feasibility of analysis per centre and per planning method [modified from Modolo, et al. (21)].
Figure 9
Figure 9
(A) Cumulative percentage of different grades of post-TAVR AR by video-densitometric assessment. Devices circled in red are not commercially available anymore. (B) Comparison of the mean regurgitation fraction after TAVR among the 14 THVs. Bars denote the mean regurgitation values, and error bars denote standard errors of the mean.
Figure 10
Figure 10
Example of LVOT-AR analysis pre and post TAVR using jenaValve.
Figure 11
Figure 11
Example of QMR analysis post mitral valve replacement with highlife valve.

References

    1. Abdelghani M, Soliman OII, Schultz C, Vahanian A, Serruys PW. Adjudicating paravalvular leaks of transcatheter aortic valves: a critical appraisal. Eur Heart J. (2016) 37:2627–44. 10.1093/eurheartj/ehw115 - DOI - PubMed
    1. Davidson CJ, Kisslo K, Burgess R, Bashore TM. Quantification of aortic regurgitation after balloon aortic valvuloplasty using videodensitometric analysis of digital subtraction aortography. Am J Cardiol. (1989) 63:585–8. 10.1016/0002-9149(89)90903-X - DOI - PubMed
    1. Grayburn PA, Nissen SE, Elion JL, Evans J, DeMaria AN. Quantitation of aortic regurgitation by computer analysis of digital subtraction angiography. J Am Coll Cardiol. (1987) 10:1122–7. 10.1016/S0735-1097(87)80355-8 - DOI - PubMed
    1. Klein LW, Agarwal JB, Stets G, Rubinstein RI, Weintraub WS, Helfant RH. Videodensitometric quantitation of aortic regurgitation by digital subtraction aortography using a computer-based method analyzing time-density curves. Am J Cardiol. (1986) 58:753–6. 10.1016/0002-9149(86)90350-4 - DOI - PubMed
    1. Von BG, Tsakiris AG, Wood EH. Quantitation of experimental aortic regurgitation by roentgen videodensitometry. Am J Cardiol. (1973) 31:265–72. 10.1016/0002-9149(73)91040-0 - DOI - PubMed