. 2023 Sep 1;130(3):497-515.
doi: 10.1152/jn.00501.2022. Epub 2023 Aug 2.

Bilateral arm movements are coordinated via task-dependent negotiations between independent and codependent control, but not by a "coupling" control policy

Affiliations

Bilateral arm movements are coordinated via task-dependent negotiations between independent and codependent control, but not by a "coupling" control policy

Nick M Kitchen et al. J Neurophysiol. .

Abstract

Prior research has shown that coordination of bilateral arm movements might be attributed to either control policies that minimize performance and control costs regardless of bilateral symmetry or by control coupling, which activates bilaterally homologous muscles as a single unit to achieve symmetric performance. We hypothesize that independent bimanual control (movements of one arm are performed without influence on the other) and codependent bimanual control (two arms are constrained to move together with high spatiotemporal symmetry) are two extremes on a coordination spectrum that can be negotiated to meet infinite variations in task demands. To better understand and distinguish between these views, we designed a task where minimization of either control costs or asymmetry would yield different patterns of coordination. Participants made bilateral reaches with a shared visual cursor to a midline target. We then covertly varied the gain contribution of either hand to the shared cursor's horizontal position. Across two experiments, we show that bilateral coordination retains high task-dependent sensitivity to subtle visual feedback gain asymmetries applied to the shared cursor. Specifically, we found a change from strong spatial covariation between hands during equal gains to more independent control during asymmetric gains, which occurred rapidly and with high specificity to the dimension of gain manipulation. Furthermore, the extent of spatial covariation was graded to the magnitude of perpendicular gain asymmetry between hands. These findings suggest coordination of bilateral arm movements flexibly maneuvers along a continuous coordination spectrum in a task-dependent manner that cannot be explained by bilateral control coupling.NEW & NOTEWORTHY Minimization of performance and control costs and efferent coupling between bilaterally homologous muscle groups have been separately hypothesized to describe patterns of bimanual coordination. Here, we address whether the mechanisms mediating independent and codependent control between limbs can be weighted for successful task performance. Using bilaterally asymmetric visuomotor gain perturbations, we show bimanual coordination can be characterized as a negotiation along a spectrum between extremes of independent and codependent control, but not efferent control coupling.

Keywords: bimanual; coordination; reaching; vision.


Conflict of interest statement

No conflicts of interest, financial or otherwise, are declared by the authors.

Figures

None
Graphical abstract
Figure 1.
Figure 1.
Experimental setup of Kinereach system and the task design for Experiments 1 and 2. A: Kinereach system from a lateral view. B: a top-down view with visual stimuli. Dashed circles show start positions for the left and right hands, the green circle shows start location for the shared cursor (small black circle with crosshair) whose position was determined by the unseen left and right finger tips according to the equation shown in the top right corner. C: task design for Experiment 1 (10 participants) according to changes in perpendicular (x-axis) position gains of the left (GL) and right (GR) hands. These values correspond to Eq. 1b that defines shared cursor position (also shown in B). Gain asymmetry conditions are labeled as LH High and RH High to denote whether the left or right hand had high perpendicular gain contribution to the shared cursor, respectively. D: task design for Experiment 2 (11 participants), which included additional intermediate (Int.) gain asymmetry conditions for the left and right hands. Perpendicular position gain values of the left (GL) and right (GR) hands correspond to the shared cursor position defined in Eq. 1b (also shown in B) in the same manner as the Experiment 1 design.
Figure 2.
Figure 2.
Conceptual model of the bimanual task and its control requirements. [xc, yc]T: cursor position; [xc_desired, yc_desired]T: desired cursor position; [qL, … qR, …]T: instantaneous state of the two hands; [q˙L, … q˙R, …]T: time rate of change of hand states; C: experimentally defined hand-to-cursor projection matrix; A and B: matrices modeling the limb dynamics (limb-state transition matrix and control input matrix, respectively); C−1 and K: comprise the adaptive task controller.
Figure 3.
Figure 3.
Example velocity profiles and trajectories of one representative participant in the Equal (2:2a; A), LH High (B), and RH High (C) conditions of Experiment 1. The velocity profiles and trajectories for the left hand are shown on the left column of the figure and data for the right hand is shown on the right. Shared cursor trajectories are shown down the center. Red cross and open circle symbols indicate the shared peak velocity and end position time points, respectively, where deviations in hand position were recorded for analysis. D and E show the group mean (error bars represent 1 standard error) and individual participant values for peak tangential velocity and movement time, respectively, for the left and right hands in the LH High, Equal (2:2a), and RH High conditions.
Figure 4.
Figure 4.
Summary of shared cursor end-position (EP) accuracy measures for the LH High (pink), Equal (2:2a; black), and RH High (light blue) conditions from Experiment 1. Top row shows the group mean cursor error at end position in 10 trial epochs (A) and averaged across the whole 50 trial block (B). Group cursor error variability (measured by coefficient of variation) is shown in the bottom row, calculated in 10 trial epochs (C) and across the whole block of trials (D). Errors bars in A and C represent 1 standard error. The P values annotated on the boxplots in B and D reflect significant Bonferroni-adjusted post hoc comparisons, with individual subject values shown as separate data points.
Figure 5.
Figure 5.
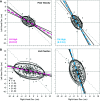
Theoretical and measured group-level covariance relationships (orthogonal regression lines and 95% confidence ellipses) of left- and right-hand perpendicular deviations for LH High (pink diamonds, left), Equal (2:2a; black circles, middle), and RH High (light blue squares, right) conditions in Experiment 1. The top row (A) shows theoretical covariance relationships and their associated regression slope angles (in degrees) that might be observed if the mode of bilateral coordination was to adjust completely to the different visual feedback conditions. The middle row (B) and bottom row (C) show empirical perpendicular deviations measured at peak velocity and end position, respectively, with annotations of measured slope angles and associated 95% confidence intervals in square brackets. The data points represent all trials from all participants combined on the same axes with 95% confidence ellipses and fitted regression models shown as solid colored lines. Individual participant 95% confidence ellipses are shown as superimposed faintly colored lines. The change in regression slopes observed for the asymmetric gain conditions are consistent in direction with the theoretical task-dependent covariance relationships shown in A, but do not completely align with those predictions due to some residual covariance between hands.
Figure 6.
Figure 6.
Boxplots and individual participant values of covariance regression slope angle measured at peak velocity (left) and end position (right) in Experiment 1. Corresponding raw slope values for 0°, −45°, and −90° slopes are shown on the right y-axis. A linear mixed-effects model indicated a significant effect of gain condition on slope angle at end position (P = 0.011), corresponding to a −15.30° [−24.68°,−5.92°] change between gain conditions, as right-hand gain contribution increases.
Figure 7.
Figure 7.
Covariance relationships (orthogonal regression lines and 95% confidence ellipses) of left- and right-hand perpendicular deviations grouped into intervals of 10 trials (grayscale key inset in lower left) for measures recorded at peak velocity (A) and end position (B) in Experiment 1. Data for the LH High and RH High conditions are shown in the left and right columns, respectively, with colored dashed lines representing orthogonal regression fitted to all data combined (i.e., identical to those for corresponding conditions shown in Fig. 5).
Figure 8.
Figure 8.
Covariance relationships (orthogonal regression and 95% confidence ellipses) of left- and right-hand parallel deviations (y-axis) at end position for LH High (left, light pink), Equal (middle, black), and RH High (right, light blue) gain conditions in Experiment 1. Positive deviation values represent an overshoot of the y-axis target location (20 cm along y-axis from start position) and negative values represent undershoot. Pearson’s correlation coefficient denoted in each panel next to regression lines (n.s. = nonsignificant).
Figure 9.
Figure 9.
Covariance relationships (orthogonal regression and 95% confidence ellipses) for different gain asymmetry conditions in Experiment 2 (see Fig. 1D for details of task design). The data are presented as all trials from all participants combined on the same axes for measurements made at peak velocity (A) and end position (B), with the annotations of the associated regression slope angles in degrees. Boxplots of slope angles obtained from orthogonal regression models fitted to individual participant data are shown for measurements at peak velocity (C) and end position (D). Raw slope values corresponding to slope angle in degrees are shown in gray near the right axis, as in Fig. 6. A linear mixed-effects model revealed a significant effect of gain condition on slope angle at end position (P = 0.024), corresponding to an estimated −5.59° [−9.72°,−1.46°] change in slope angle between gain conditions, as contribution of the right hand increases.

Similar articles

Cited by

References

    1. Swinnen SP. Intermanual coordination: from behavioural principles to neural-network interactions. Nat Rev Neurosci 3: 348–359, 2002. doi:10.1038/nrn807. - DOI - PubMed
    1. Kelso JA, Southard DL, Goodman D. On the coordination of two-handed movements. J Exp Psychol Hum Percept Perform 5: 229–238, 1979. doi:10.1037//0096-1523.5.2.229. - DOI - PubMed
    1. Kelso JA, Putnam CA, Goodman D. On the space-time structure of human interlimb co-ordination. Q J Exp Psychol A 35: 347–375, 1983. doi:10.1080/14640748308402139. - DOI - PubMed
    1. Cattaert D, Semjen A, Summers JJ. Simulating a neural cross-talk model for between-hand interference during bimanual circle drawing. Biol Cybern 81: 343–358, 1999. doi:10.1007/S004220050567. - DOI - PubMed
    1. Carson RG, Thomas J, Summers JJ, Walters MR, Semjen A. The dynamics of bimanual circle drawing. Q J Exp Psychol A 50: 664–683, 1997. doi:10.1080/713755721. - DOI - PubMed

Publication types

LinkOut - more resources