. 2023 Dec;21(12):2458-2472.
doi: 10.1111/pbi.14141. Epub 2023 Aug 2.

Engineering homoeologs provide a fine scale for quantitative traits in polyploid

Affiliations

Engineering homoeologs provide a fine scale for quantitative traits in polyploid

Eun Song Lee et al. Plant Biotechnol J. 2023 Dec.

Abstract

Numerous staple crops exhibit polyploidy and are difficult to genetically modify. However, recent advances in genome sequencing and editing have enabled polyploid genome engineering. The hexaploid black nightshade species Solanum nigrum has immense potential as a beneficial food supplement. We assembled its genome at the scaffold level. After functional annotations, we identified homoeologous gene sets, with similar sequence and expression profiles, based on comparative analyses of orthologous genes with close diploid relatives Solanum americanum and S. lycopersicum. Using CRISPR-Cas9-mediated mutagenesis, we generated various mutation combinations in homoeologous genes. Multiple mutants showed quantitative phenotypic changes based on the genotype, resulting in a broad-spectrum effect on the quantitative traits of hexaploid S. nigrum. Furthermore, we successfully improved the fruit productivity of Boranong, an orphan cultivar of S. nigrum suggesting that engineering homoeologous genes could be useful for agricultural improvement of polyploid crops.

Keywords: agricultural improvement; homoeologous gene editing; polyploid; quantitative traits.


Conflict of interest statement

The authors declare no competing interests.

Figures

Figure 1
Figure 1
Evolutionary closeness between hexaploid Solanum nigrum and diploid Solanum americanum. (a) Sympodial shoot structures and ripe fruits (inset) of S. nigrum (accession NIBRGR0000189638) and S. americanum (accession SP2273), respectively. Red arrowheads indicate inflorescence. Bracket and number represent the interval between inflorescences and leaf numbers on each sympodial unit. ID, indeterminate growth. (b) Phylogenetic tree of chloroplast cDNA sequences from various Solanaceae species. The black number denotes the bootstrap of each node. The red number indicates the estimated divergence time (million years ago, myr). Oryza sativa was used as an outgroup control. (c) FisH karyotypes of S. americanum and S. nigrum. The numbers above indicate the chromosome number. Green and red signals indicate sequence‐specific barcode‐probing regions based on the S. americanum chromosome. Purple and blue signals indicate 5S rDNA and 45S rDNA, respectively. Scale bar, 10 μm. (d) Evolution tree constructed using synteny block analysis in Solanaceae family. The black number denotes the bootstrap of each node, and the red number indicates the estimated divergence time (myr) based on Ks values on the blocks. T means genome triplication event generating three genomic contents in S. nigrum.
Figure 2
Figure 2
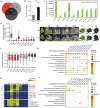
Characterization of the orthologous genes in Solanum species. (a) Venn diagram describing hierarchical orthologous groups (HOGs) among Solanum lycopersicum (Sl), S. americanum (Sa) and S. nigrum (Sn). (b) Average orthologous gene numbers included in common HOGs in S. americanum and S. nigrum (mean + SD). Statistical significance was obtained using a two‐tailed Mann–Whitney U test (***P < 0.001). (c) Pairwise comparison of nucleotide polymorphisms among pepper (Ca, C. annuum), tomatoes (Sl, S. lycopersicum; Spi, S. pimpinellifolium; Spe, S. pennellii), S. americanum and S. nigrum. Sn1, Sn2 and Sn3 refer to each orthologous gene existing as a triad in S. nigrum. Pepper and wild tomato species were used as inter‐genus and inter‐species controls, respectively. n = 5257 HOGs. (d) Pairwise comparison of amino acid differences through nonsynonymous substitution rate (dN) calculation among species used in (C). n = 7473 HOGs. (e) Tissue samples from leaves, shoot apical meristems, and fruits for transcriptome profiling in S. americanum and S. nigrum. DAG, days after germination; FM, floral meristem; L, leaf; MF, mature fruit; SYM, sympodial shoot meristem; TF, transition fruit; TM, transition meristem; VM, vegetative meristem; YF, young fruit. Dotted lines indicate excision sites in meristem samples. Scale bar, 1 cm (leaf and fruits) and 100 μm (shoot apical meristems). (f) Pairwise analyses of Pearson's correlation coefficients of gene expression patterns using eight tissue samples among the three species in (e). For each box plot, the lower and upper bounds of the box indicate the first (Q1) and third (Q3) quartiles, respectively, and the centre white line indicates the median. Outliers determined by Tukey's HSD are not shown. Different letters indicate statistical significance obtained using Kruskal–Wallis test with Dunn's multiple comparisons. n = 7473 HOGs. (g) Heat map represents gene expression patterns of three selected individual genes in three species. Numbers in parentheses indicate correlation coefficients compared to an expression pattern in S. americanum (green colour). Red and black colours indicate genes from S. lycopersicum and S. nigrum, respectively. (h, i) Enriched GO terms of orthologous gene set with either highly correlated expressions (H, r ≥ 0.8) or noncorrelated expressions (I, −0.2 < r < 0.2) from data in (f). Statistical significance for differences was obtained using Fisher's exact test with false discovery rate (FDR) <0.05. Numbers in parentheses indicate the numbers of genes in each set.
Figure 3
Figure 3
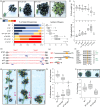
Functional gene copy numbers of S homoeologous genes determine inflorescence branching and fruit yield in S. nigrum. (a) Schematic diagram explaining CRISPR‐Cas9‐generated mutants by backcrossing in S. americanum and S. nigrum. OG, orthologous gene; HG, homoeologous gene. (b) CRISPR‐Cas9‐generated mutations in S gene loci. S gene structure and four sgRNA targeting sites are depicted in the upper diagram. sgRNA‐targeted sequences are red‐coloured, and each protospacer‐adjacent motif (PAM) sequence is underlined. Parentheses number represents gap lengths between sgRNAs. Each mutation is denoted in blue colour. (c) Inflorescence branching of the s mutants in S. americanum and S. nigrum. Red arrowheads indicate branching points in the inflorescence. The magnified picture of emerging inflorescence in the s mutant shows meristem overproliferation phenotype. The s1s2s3 triple mutant rarely develops mature black fruits from flowers. (d) Quantifications of inflorescence branching and flower numbers of the s mutants in S. americanum and S. nigrum. Each inflorescence branch number is counted and denoted using different colours in the stacked bar chart. Each inflorescence flower number is measured and depicted in the box plot. n, number of inflorescences. Genotypes are ordered to show gradual phenotypic effect changes. Open circles represent data values of outliers. (e) Estimated fruit yield potential of various s mutant combinations in S. americanum and S. nigrum. Total yield potential is calculated based on the average weight of each inflorescence and the total number of maturating inflorescences in each plant grown in the greenhouse (upper) or field (lower). n, number of plants. Open circles represent all data values. (d, e) Box plots show the 25th, 50th and 75th percentiles and different letters indicate statistically significant differences (ANOVA, Tukey's HSD, P < 0.05).
Figure 4
Figure 4
Mutant series possessing various copy numbers of functional SP homoeologous genes exhibits altered shoot growth patterns affecting fruit yield in S. nigrum. (a) CRISPR‐Cas9‐generated mutations in SP gene loci. SP gene structure and four sgRNA targeting sites are depicted in the upper diagram. sgRNA and PAM sequences are highlighted in red and bold underlined, respectively. Each mutation is denoted in blue colour. (b) Shoot structure of SID (semi‐indeterminate)‐type S. nigrum sp mutants. Black arrows indicate stem growth directions, and red arrows indicate emerging axillary inflorescences. ID, indeterminate growth; D, determinate growth. (c) Shoot growth patterns (top) and axillary bud formations (bottom) of the sp mutants in S. americanum and S. nigrum. Red arrowheads indicate main stem inflorescences, and orange arrowheads indicate axillary stem inflorescences. Yellow brackets indicate elongated internode lengths of the axillary shoots. Sympodial indices are denoted with leaf numbers between two adjacent inflorescences. Axe. indicates an emerged axillary branch. (d) Quantification of the shoot growth patterns and axillary bud formations of the sp mutants in S. americanum and S. nigrum. Internode lengths (left), axillary shoot elongations (middle) and numbers of emerged axillary inflorescences (right) were measured in each genotype. Genotypes are ordered to show gradual changes in phenotypic effects. n, number of tested shoots. (e) Estimated fruit yield potential of various sp mutant combinations in S. americanum and S. nigrum. Total yield potentials were calculated based on the average weight of each inflorescence and the total numbers of maturating inflorescence in each plant. Genotype order is as same as (d). n, number of plants. (d, e) Box plots depict the 25th, 50th and 75th percentiles and different letters indicate statistically significant differences (ANOVA, Tukey's HSD, P < 0.05). Open circles represent outlier data values.
Figure 5
Figure 5
Dosage effects on paralogous compensation by functional CLE9 homoeologous genes in flower and fruit development in the clv3Q mutant of S. nigrum. (a) CRISPR‐Cas9‐generated mutations in CLE9 homoeologous gene loci. CLE9 gene structure and four sgRNA targeting sites are depicted in the upper diagram. sgRNA‐targeted sequences in red, and each PAM sequence is underlined. Each mutation is denoted in blue colour. (b) Reproductive organ phenotype of the cle9 mutants in S. nigrum. Morphology of flowers (upper) and cross‐section of the immature fruit (lower) showing locule photographed. White arrowheads indicate each fruit locules. The clv3Q cle9T septuple mutant shows severely fasciated flower that fails to develop as a fruit. Scale bar, 1 cm. (c) Petal number quantification in cle9 mutant flowers from S. nigrum. n, number of plants. (d) Locule number quantification of cle9 mutant fruits in S. nigrum. n, number of plants. (e) Fruit weight quantification of the cle9 mutants in S. nigrum. n, number of fruits. (c–e) Box plots depicting the 25th, 50th and 75th percentiles and different letters indicate statistically significant differences (ANOVA, Tukey's HSD, P < 0.05). Genotypes were ordered to show gradual changes in phenotypic effects. Open circles represent outlier data values.
Figure 6
Figure 6
Fruit yield improvement by polyploid mutagenesis in S. nigrum cv. Boranong. (a) Inflorescence phenotypes in selected s multiple mutants in S. nigrum cv. Boranong. Scale bar, 2 cm. (b) Quantification of inflorescence branching and flower numbers of various s mutant combinations in Boranong. Branch numbers in each inflorescence were counted and grouped using different colours in the stacked bar chart (left). Flower numbers of each inflorescence measured (right). n, number of inflorescences. (c) Fruit yields of Boranong s mutants. The 10‐fruit weight of each genotype was measured using fully matured black fruits (upper). Total yield potentials were calculated based on the average weight of each inflorescence and the total number of maturating inflorescences in each plant (lower). (d) CRISPR‐Cas9‐generated SP gene loci mutation in Boranong. sgRNA‐targeted sequences are red‐coloured, and each PAM sequence is underlined. Each mutation is denoted in blue colour. (e) Proteins encoded by SP3 alleles. Single amino acid (H58) deletion occurred by sp3 a1 mutation, SP3a2 severely impaired due to the frameshift mutation. The asterisk indicates a premature stop. (f) Peptide sequence alignment of SP proteins from various species. Histidine residue is conserved only in the TFL1 clade and missing in the SP3a1 of Boranong (yellow box). (g) Sympodial shoot structures and fruit formations of the sp allele‐specific mutants in Boranong. Red arrowheads indicate main stem inflorescence, and orange arrowheads indicate axillary bud inflorescence. D, determinate growth; ID, indeterminate growth; Scale bar, 5 cm. (h) Quantification of shoot branching and inflorescence development in axillary buds. Numbers of the long axillary branches (≥15 cm) measured in each plant (upper). Emerged inflorescence numbers of each fruit bundle (lower). (i) Fruit yield of the sp allele‐specific mutants in Boranong. The weight of fully matured black fruits are measured in each plant at the same stage. Representative image of collected black fruits from a single plant (upper inbox; Scale bar, 5 cm). n, number of plants. (b, c, h and i) Box plots depict the 25th, 50th and 75th percentiles and different letters indicate statistically significant differences (ANOVA, Tukey's HSD, P < 0.05). Open circles represent outlier data values.

References

    1. Andrés, F. and Coupland, G. (2012) The genetic basis of flowering responses to seasonal cues. Nat. Rev. Genet. 13, 627–639. - PubMed
    1. Bernard, R.L. (1972) Two genes affecting stem termination in soybeans 1. Crop. Sci. 12, 235–239.
    1. Blanca, J. , Montero‐Pau, J. , Sauvage, C. , Bauchet, G. , Illa, E. , Díez, M.J. , Francis, D. et al. (2015) Genomic variation in tomato, from wild ancestors to contemporary breeding accessions. BMC Genomics 16, 257. - PMC - PubMed
    1. Comai, L. (2005) The advantages and disadvantages of being polyploid. Nat. Rev. Genet. 6, 836–846. - PubMed
    1. Doyle, J.J. and Doyle, J.L. (1987) A rapid DNA isolation procedure for small quantities of fresh leaf tissue. Phytochem. Bull. 19, 11–15.

Publication types

LinkOut - more resources