Review
. 2024 Feb;59(2):412-430.
doi: 10.1002/jmri.28890. Epub 2023 Aug 2.

Cardiac MRI at Low Field Strengths

Affiliations
Review

Cardiac MRI at Low Field Strengths

Adrienne E Campbell-Washburn et al. J Magn Reson Imaging. 2024 Feb.

Abstract

Cardiac MR imaging is well established for assessment of cardiovascular structure and function, myocardial scar, quantitative flow, parametric mapping, and myocardial perfusion. Despite the clear evidence supporting the use of cardiac MRI for a wide range of indications, it is underutilized clinically. Recent developments in low-field MRI technology, including modern data acquisition and image reconstruction methods, are enabling high-quality low-field imaging that may improve the cost-benefit ratio for cardiac MRI. Studies to-date confirm that low-field MRI offers high measurement concordance and consistent interpretation with clinical imaging for several routine sequences. Moreover, low-field MRI may enable specific new clinical opportunities for cardiac imaging such as imaging near metal implants, MRI-guided interventions, combined cardiopulmonary assessment, and imaging of patients with severe obesity. In this review, we discuss the recent progress in low-field cardiac MRI with a focus on technical developments and early clinical validation studies. EVIDENCE LEVEL: 5 TECHNICAL EFFICACY: Stage 1.

Keywords: MRI; accessibility; cardiac imaging; low field.


Figures

Figure 1:
Figure 1:
Illustration of the reduced magnetohydrodynamic (MHD) effect at 0.75T (top) compared to 1.5T (bottom). This MHD effect can be resolved using vector gating, with additional leads and higher complexity of the gating system. In general, low field strengths enable simpler and more robust ECG gating with a single channel. [Reproduced from Ref (60)]
Figure 2:
Figure 2:
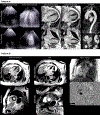
Example images from the prototype 0.55T MRI system. A) Free breathing bSSFP cine imaging of cardiac function using a compressed sensing image reconstruction (diastolic frame shown). This patient has a wall motion abnormality post myocardial infarction which can be seen in Supporting Information Video S1. B) Flow quantification using phase-contrast MRI in a patient with a ventricular septal defect. C) Late gadolinium enhancement and D) T1 mapping are shown in a patient with hypertrophic cardiomyopathy (white arrows). E) Fat/water separation using the Dixon method in a patient with myocardial fat infiltration (orange arrows).
Figure 3:
Figure 3:
Example images from the commercial 0.55T MRI system. A) T2-weighted turbo spin echo (TSE) black blood imaging in a healthy volunteer with and without deep learning (DL) image enhancement. DL enhancements were vendor-provided reconstruction methods to densoise and increase image sharpness. B) A compressed sensing-based ECG-triggered contrast-enhanced (CE) MR angiography (MRA) acquisition in a healthy volunteer. C) Rest perfusion images and comparison late gadolinium enhancement (LGE) images illustrating a perfusion defect (arrows) in a swine model of myocardial infarction.
Figure 4:
Figure 4:
Strain images from a commercial 0.55T MRI system. The left panel shows Late Gadolinium Enhanced images in a porcine myocardial infarction model, showing apical, antero-septal infarct caused by 90-minute occlusion followed by reperfusion of the left anterior descending coronary artery. The AHA 16-segment bulls-eye plot in the middle shows longitudinal strain deficit (in yellow and green) in the segments corresponding to the infarct location. The corresponding apical short-axis SENC image in the right panel shows the longitudinal strain deficit in the anterior septal region. [Reproduced from Ref. (165)]
Figure 5:
Figure 5:
Assessment of RF ablation lesions (green arrows) and chemoablation lesions (orange arrows) on a prototype 0.55T MRI system in a swine model. In vivo imaging included a) 3D T2-weighted imaging, B) 3D T1-weighted imaging, C) T1 mapping, and ex vivo imaging used D) 3D T1-weighted imaging to confirm the location of the lesion in fixed tissue. [Reproduced from Ref. (105)]
Figure 6:
Figure 6:
MRI-guided procedure using commercial 0.55T MRI system in a swine model. A) MRI-conditional polymer guidewire with susceptibility markers (arrow) (EmeryGlide, Nano4Imaging, Aachen, Germany) used for MRI-guided left heart catheterization, and B) placement of a stent in the inferior vena cava (arrow) (Z-Med Balloon, NuMED for Children, Orlando, FL). Real-time imaging was achieved with spoiled gradient echo (~2 frames/s, 1.8mm x 2mm x 9.5mm) following administration of 2mg/kg ferumoxytol.
Figure 7:
Figure 7:
Example images from the first-in-human MRI-guided radioablation at 0.35T with estimated delivered radiation dose overlaid [Adapted from Ref. (115)].
Figure 8:
Figure 8:
Quantitative lung water density measurement with the patient supine and prone to illustrate the gravitational dependence of lung water distribution. The evaluation of cardiogenic pulmonary edema is valuable during the MRI assessment of heart failure.
Figure 9:
Figure 9:
Comparison of artifacts caused by metallic implants at 1.5T and 0.55T.
Figure 10:
Figure 10:
Example images from a commercial 80 cm bore, 0.55T system in two obese patients unable to undergo cardiac MRI assessment on 70 cm bore systems due to body habitus. Patient A (Male, 61 y.o., 350 lb, BMI 48 kg/m2, body surface area 2.6m2) - Breath-held segmented cine images in four and two-chamber views are shown along with the patient’s echocardiographic images, acquired without and with ultrasound contrast. Multiplanar reformatted images of the thoracic aorta acquired with a non-triggered contrast-enhanced MR angiogram depicts a dilated aorta. Patient B (Male, 6.5.y.o., 410 lbs, BMI > 57 kg/m2, body surface area 2.86m2) - Breath-held segmented cine (four chamber and short axis view), free-breathing motion-corrected (four chamber) and breath-held segmented (short axis) LGE demonstrating fibrosis, and magnitude and phase images of the aortic root are shown. [Adapted from Refs. (166) and (55)]

References

    1. Leiner T, Bogaert J, Friedrich MG, et al. SCMR Position Paper (2020) on clinical indications for cardiovascular magnetic resonance. J Cardiovasc Magn Reson 2020;22(1):76. - PMC - PubMed
    1. Couto M, Souto M, Martinez A, et al. Accuracy of right ventricular volume and function assessed with cardiovascular magnetic resonance: comparison with echocardiographic parameters. Clin Imaging 2020;59(1):61–67. - PubMed
    1. Nayak KS, Nielsen JF, Bernstein MA, et al. Cardiovascular magnetic resonance phase contrast imaging. J Cardiovasc Magn Reson 2015;17:71. - PMC - PubMed
    1. Simonetti OP, Kim RJ, Fieno DS, et al. An improved MR imaging technique for the visualization of myocardial infarction. Radiology 2001;218(1):215–223. - PubMed
    1. Aquaro GD, Ghebru Habtemicael Y, Camastra G, et al. Prognostic Value of Repeating Cardiac Magnetic Resonance in Patients With Acute Myocarditis. J Am Coll Cardiol 2019;74(20):2439–2448. - PubMed

Publication types