

The cell cycle protein MAD2 facilitates endocytosis of the serotonin transporter in the neuronal soma
- PMID: 37530743
- PMCID: PMC10561363
- DOI: 10.15252/embr.202153408
The cell cycle protein MAD2 facilitates endocytosis of the serotonin transporter in the neuronal soma
Abstract
Monoamine transporters retrieve serotonin (SERT), dopamine (DAT), and norepinephrine (NET) from the synaptic cleft. Transporter internalization contributes to the regulation of their surface expression. Clathrin-mediated endocytosis of plasma membrane proteins requires adaptor protein-2 (AP2), which recruits cargo to the nascent clathrin cage. However, the intracellular portions of monoamine transporters are devoid of a conventional AP2-binding site. Here, we identify a MAD2 (mitotic arrest deficient-2) interaction motif in the C-terminus of SERT, which binds the closed conformation of MAD2 and allows for the recruitment of two additional mitotic spindle assembly checkpoint (SAC) proteins, BubR1 and p31comet , and of AP2. We visualize MAD2, BubR1, and p31comet in dorsal raphe neurons, and depletion of MAD2 in primary serotonergic rat neurons decreases SERT endocytosis in the soma. Our findings do not only provide mechanistic insights into transporter internalization but also allow for rationalizing why SAC proteins are present in post-mitotic neurons.
Keywords: endocytosis; mitotic checkpoint; raphe neurons; recycling endosome; serotonin transporter.
© 2023 The Authors. Published under the terms of the CC BY 4.0 license.
Conflict of interest statement
The authors declare that they have no conflict of interest.
Figures
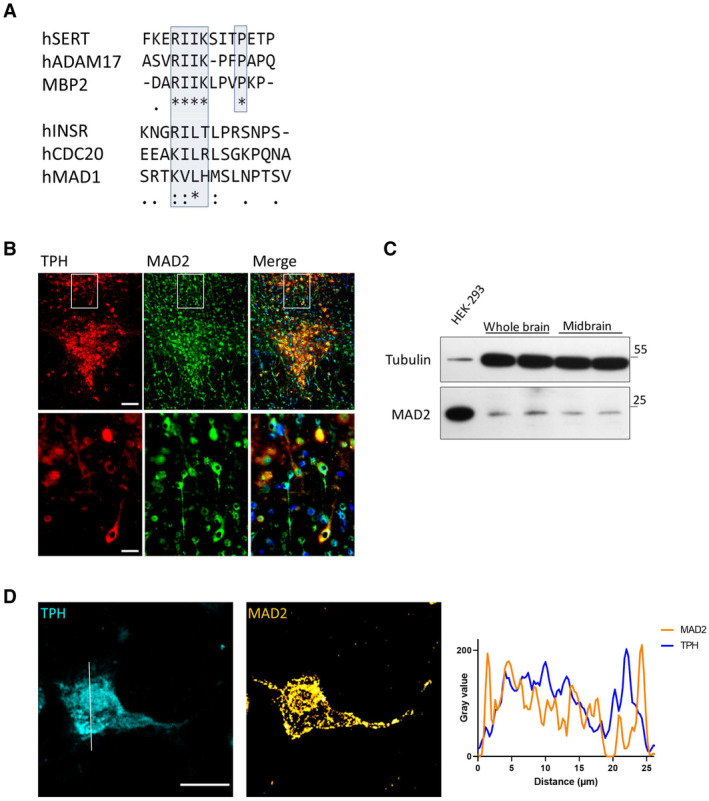
Clustal Omega alignment of the SERT C‐terminus with previously described MAD2‐interacting proteins. The putative SERT‐MIM and previously described MIMs are highlighted by blue boxes; (*)—fully conserved residue; (:)—residues of strongly similar properties; (.)—residues of weakly similar properties.
Cryosections were subjected to immunofluorescence microscopy using appropriate excitation wavelengths and emission filters. White boxes indicate the magnified area in the lower panel. All images were taken as “multiple image alignments.” Scale bars represent 100 and 25 μm in the upper and lower panel, respectively.
Whole‐brain and midbrain lysates of adult mice were prepared as outlined under “Materials and Methods.” Total protein (20 μg) was immunoblotted for MAD2 or α‐Tubulin and compared to HEK‐293 cell lysates.
Z‐stacks of individual TPH+/MAD2+ positive neurons were generated by confocal microscopy. Intensity profiles of an average projection were generated using ImageJ/Plot Profile software. Scale bar represents 20 μm.
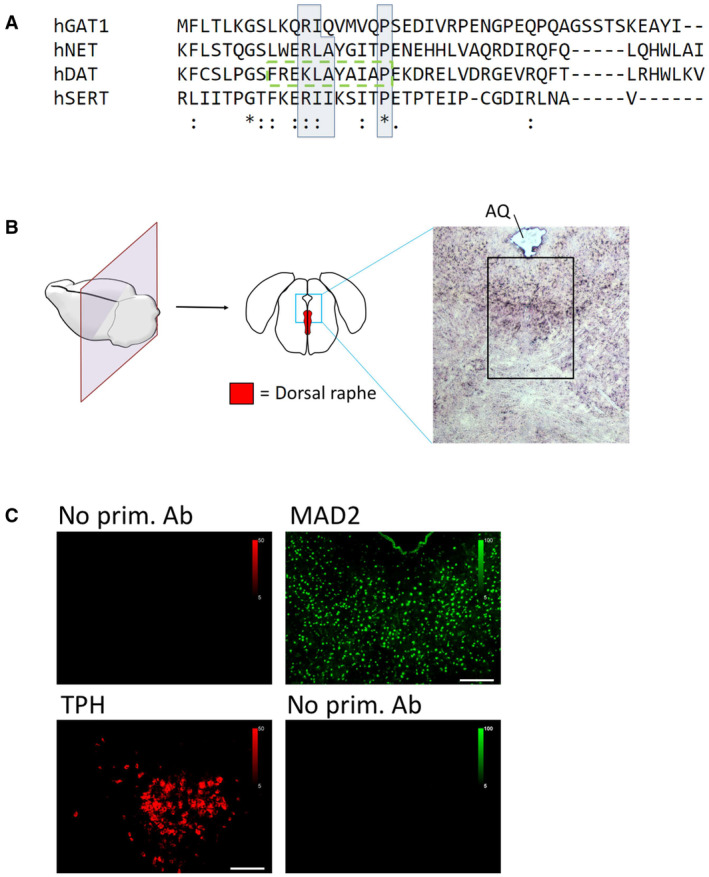
The C‐termini of indicated transporters were aligned using Clustal Omega software. Conserved residues of candidate MIMs are highlighted by blue boxes; (*)—fully conserved residue; (:)—residues of strongly similar properties; (.)—residues of weakly similar properties. The previously described endocytic motif in DAT is highlighted by the green dashed box.
Cryosections of mouse brain were prepared covering the dorsal raphe and stained with hematoxylin/eosin. The black box indicates the approximate area of immunofluorescence images in Figs 1B and 3A and B. AQ = cerebral aqueduct.
Mouse brain sections were subjected to immunofluorescence microscopy as described under “Materials and Methods,” with or without polyclonal antibodies for either TPH or MAD2, as indicated. Scale bars represent 100 μm.

- A
Glutathione S‐transferase (GST)‐tagged serotonin transporter C‐terminus and the derivative RII‐AAA mutant were purified and used in GST‐protein‐based interaction assays.
- B–D
GST pull‐down experiments were conducted in duplicates using the indicated GST fusion proteins. Eluates (30%) were subjected to immunoblotting together with an aliquot (1%) of the input. Blots were stained with Ponceau S, and MAD2 was detected by immunoblotting. Densitometric signals were quantified using ImageJ software. Results were compared using unpaired two‐tailed t‐tests; ****P < 0.0001, ns—not significant; exact P‐values are indicated; error bars represent SD of eight independent biological replicates (n = 8).
- E
Total cell lysates (5 μg) of indicated transfections were subjected to immunoblotting, using antibodies against YFP and MAD2.
- F–H
YFP‐hMAD2 constructs were generated as outlined under “Materials and Methods.” Whole‐cell lysates of transfected HEK‐293 cells were used for GST pull‐down experiments. One‐way ANOVA with Dunnett's multiple post hoc comparison; ***P < 0.001, ns—not significant; error bars represent SD of three independent biological replicates (n = 3).
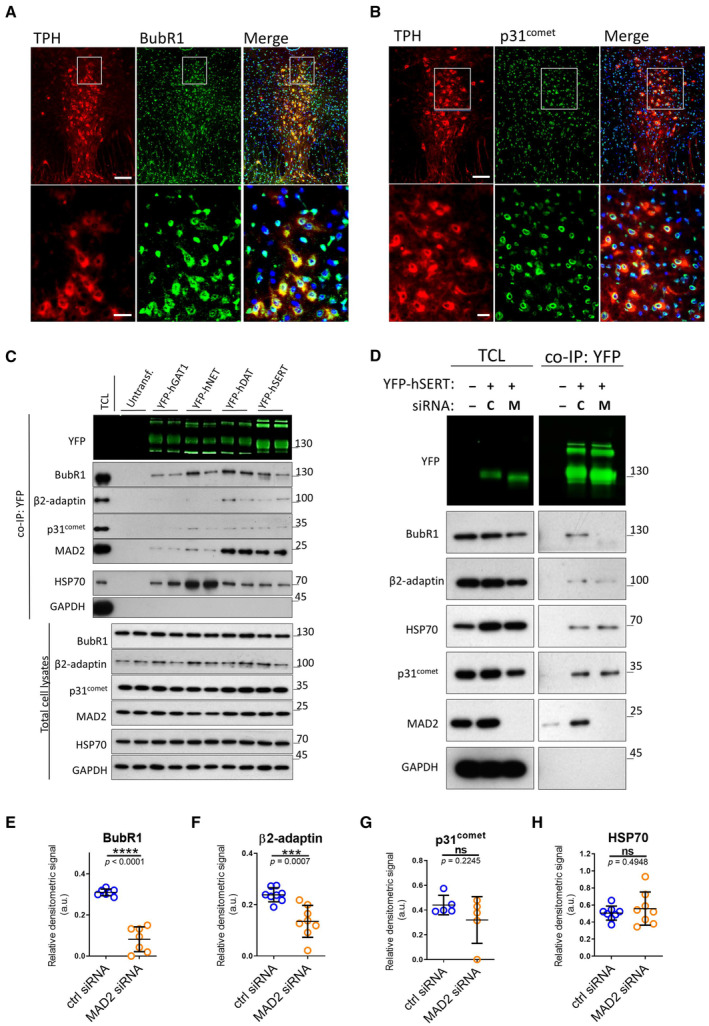
- A, B
Immunofluorescence of p31comet and BubR1 in mouse dorsal raphe. White boxes indicate the magnified sections in the lower panels. Scale bars represent 100 and 25 μm in the upper and lower panels, respectively.
- C
Co‐immunoprecipitation experiments using lysates from HEK‐293 cells stably expressing the indicated YFP‐tagged transporters. Eluates (20%) as well as 0.1% total cell lysate were analyzed by immunoblotting. The immunoblot for mouse anti‐β2‐adaptin was subsequently used for incubation with rabbit anti‐GFP primary and IRDye 800CW anti‐rabbit secondary antibody. IRDye signals were detected using the LI‐COR Odyssey CLx imaging system. Densitometric signals were quantified using ImageJ software.
- D–H
HEK‐293 cells stably expressing YFP‐hSERT were transfected with indicated siRNAs (“C”—ctrl siRNA; “M”—MAD2 siRNA) and subjected to co‐immunoprecipitation. All signals were normalized to YFP‐SERT. Results were compared using unpaired two‐tailed t‐tests; ***P < 0.001, ****P < 0.0001, ns—not significant; calculated P‐values are indicated; error bars represent SD of seven (BubR1), eight (β2‐adaptin), five (p31comet), and eight (HSP70) independent biological replicates.
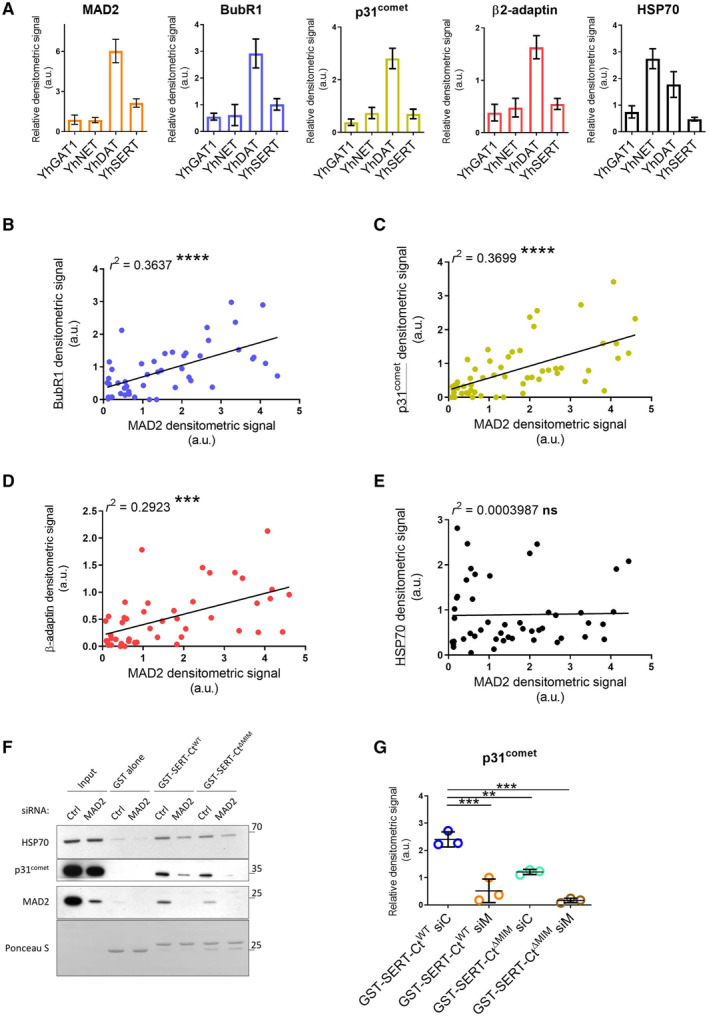
- A
Densitometric signals in Fig 3C/co‐IP:YFP were quantified using ImageJ and normalized to their respective transporter signal intensities; error bars represent SEM. Data derive from seven (MAD2), six (BubR1), seven (p31comet), six (β2‐adaptin), and six (HSP70) independent biological replicates.
- B–E
Scatter plots for the co‐IP of indicated proteins (y‐axis) against the co‐IP of MAD2 (x‐axis) (cf. Fig 3C); r 2 indicates the squared linear correlation coefficient; ***P < 0.001, ****P < 0.0001, ns—not significant. Data derive from six (BubR1), seven (p31comet), six (β2‐adaptin), and six (HSP70) independent biological replicates.
- F, G
HEK‐293 cells were transfected with the indicated siRNAs and cell lysates were used for GST pull‐down experiments using the indicated GST proteins. One‐way ANOVA with Dunnett's multiple post hoc comparison; **P < 0.01, ***P < 0.001; error bars represent SD of three independent biological replicates.
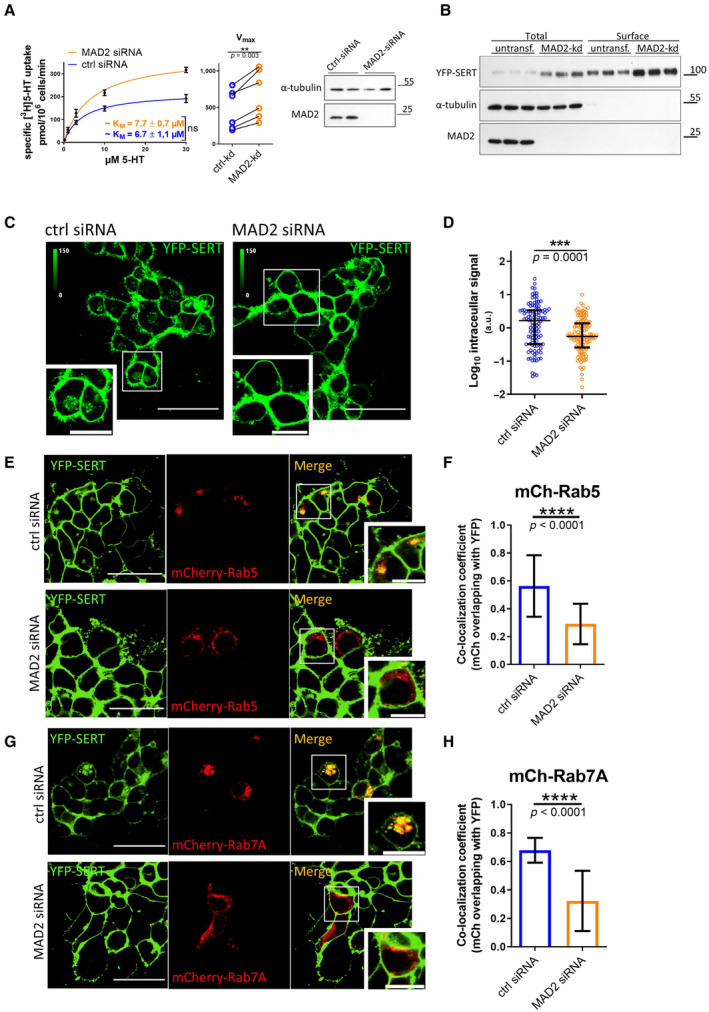
- A
Radioactive substrate uptake was conducted as described under “Materials and Methods.” KM and Vmax were determined by fitting the data to the equation of a rectangular hyperbola. Representative curves are shown. Error bars represent SEM. For comparison of Vmax, paired two‐tailed t‐test was conducted; **P < 0.01, ns—not significant. Data are derived from six independent biological replicates. Lysates were prepared from an aliquot of the cells, which were used for the uptake assay, and subjected to immunoblotting to verify MAD2 knockdown. Immunodetection of α‐tubulin was used as a loading control.
- B
Cell surface biotinylation using HEK‐293 cells stably expressing YFP‐hSERT was performed as described under “Materials and Methods.” Whole‐cell lysates and streptavidin‐conjugated fractions (i.e., surface protein) were subjected to immunoblotting.
- C, D
HEK‐293 cells stably expressing YFP‐hSERT were transfected with the indicated siRNAs, imaged, and analyzed as described under “Materials and Methods.” Representative maximum‐intensity projections of Z‐stacks are shown. Scale bars represent 50 and 20 μm in full‐size images and zoomed areas, respectively. Intracellular SERT signal was measured using ImageJ software. The dot plot in Panel (D) shows values (presented as Log10 to account for the large variation in the signal) from individual cells (Ctrl siRNA n = 112 cells; MAD2 siRNA n = 116 cells) deriving from three independent biological replicates, the median, and the interquartile range. The statistically significant difference was assessed by an unpaired two‐tailed t‐test; ***P < 0.001.
- E–H
HEK‐293 cells stably expressing YFP‐hSERT were transfected with the indicated siRNA, subsequently co‐transfected with plasmids encoding mCherry‐Rab5 (Panel E) or mCherry‐Rab7A (Panel G), and imaged as described under “Materials and Methods.” Manders' overlap coefficients for the fraction of mCherry‐overlapping YFP were calculated for multiple individual images using ImageJ/JACoP. Number of analyzed images: mCh‐Rab5/ctrl‐siRNA = 38; mCh‐Rab5/MAD2‐siRNA = 33 (Panel F); mCh‐Rab7A/ctrl‐siRNA = 13; and mCh‐Rab7A/Mad2‐siRNA = 14 (Panel H). Statistically significant differences were assessed by unpaired two‐tailed t‐test; ****P < 0.0001. Error bars represent SD of three independent biological replicates (n = 3). Scale bars represent 50 and 20 μm in full‐size images and zoomed areas, respectively.
- A–C
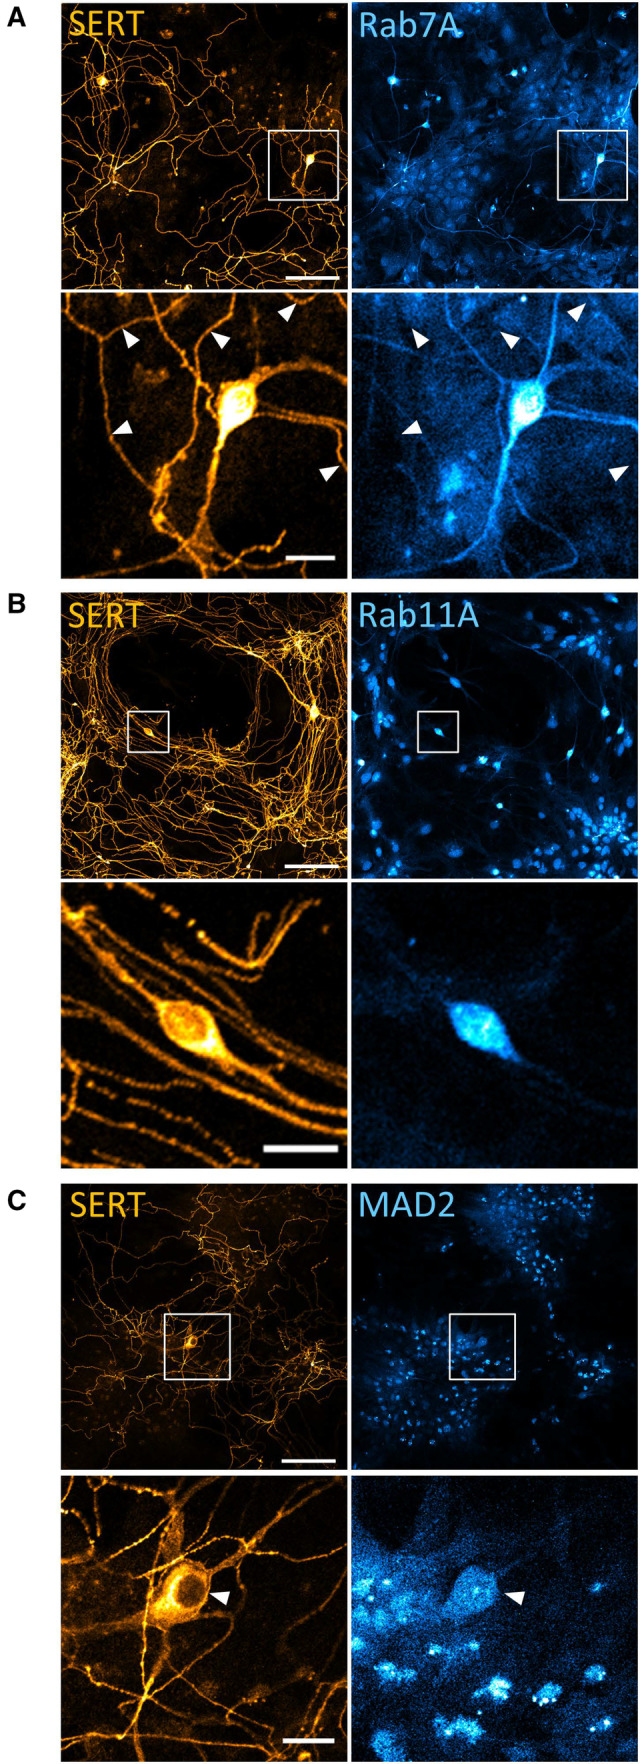
Primary rat dorsal raphe neurons were cultured as described under “Materials and Methods.” After 14 days, cells were fixed in acetone/methanol (1:1) and subjected to immunofluorescence with the indicated antibodies. Confocal images were captured on a Nikon A1 laser scanning confocal microscope at 20× magnification. White boxes in the merged image indicate zoomed area in the lower panels. White arrowheads specify serotonergic extensions, as Rab7A was also detectable in non‐serotonergic neurite extensions. Scale bars represent 100 and 20 μm for 20× image and zoomed area, respectively.
- A
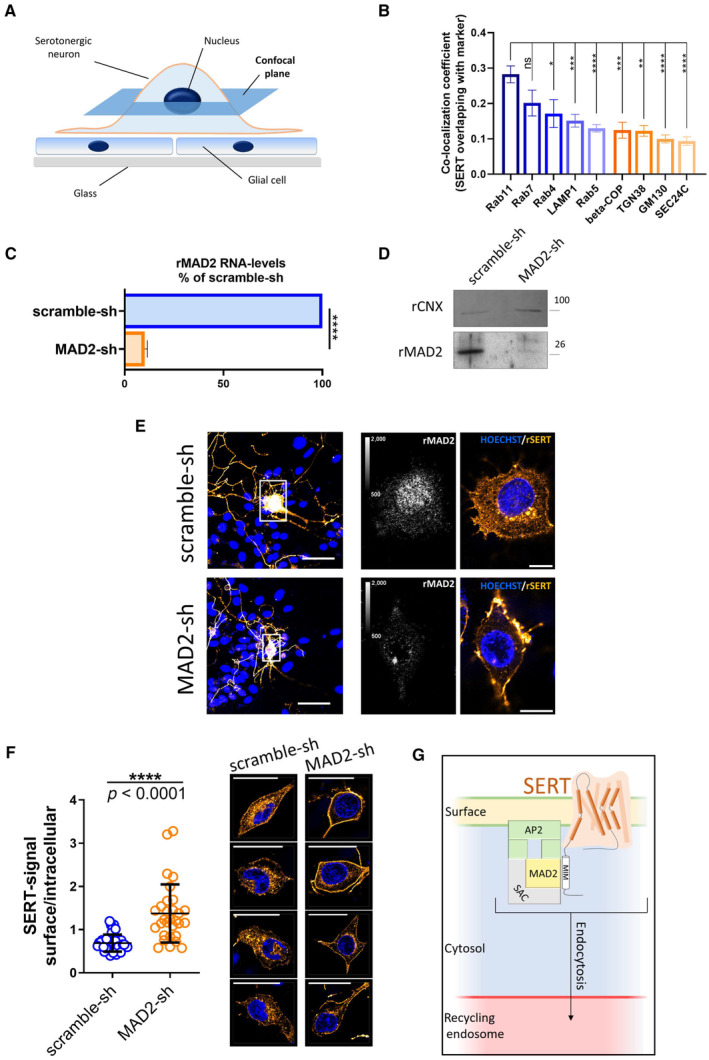
Schematic representation of the confocal plane (dark blue) selected for visualizing immunoreactivity in somata of serotonergic neurons in Panel (E).
- B
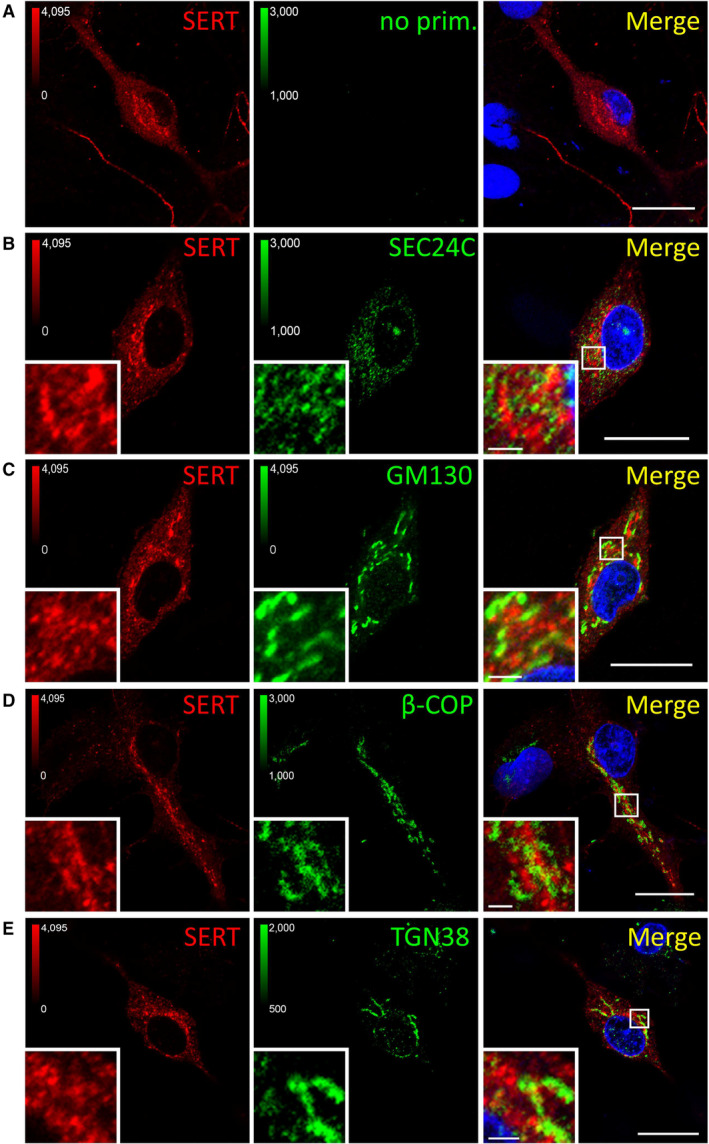
Immunofluorescence images of rat primary dorsal raphe neurons in Figs EV4 and EV5 were analyzed using ImageJ/JACoP software. Bars indicate Manders' overlap coefficients for the fraction of SERT overlapping with the denoted marker protein. One‐way ANOVA and Tukey's multiple‐comparisons test; *P < 0.05, **P < 0.01, ***P < 0.001, ****P < 0.0001. Number of analyzed cells: Rab11A n = 20; Rab7A n = 11; Rab4 n = 8; LAMP1 n = 12; Rab5 n = 14; beta‐COP n = 7; TGN38 n = 5; GM130 n = 11; SEC24C n = 11. Error bars represent SEM.
- C, D
Primary rat cortical glia cells were cultured as described under “Materials and Methods.” After 14 days, cells were infected with lentiviral particles encoding either scramble shRNA or shRNA directed against MAD2. Five days after infection, cells were subjected to quantitative PCR (n = 3 biological replicates) or immunoblotting (n = 2 biological replicates). For the latter, the ER resident protein calnexin was used as loading control. For Panel (C), ****P < 0.0001 in an unpaired two‐tailed t‐test. Error bars represent SD.
- E
Primary rat dorsal raphe neurons were cultured as described under “Materials and Methods.” After 14 days, cells were infected with lentiviral particles encoding either scramble shRNA or shRNA directed against MAD2. Five days after infection, cells were fixed in acetone/methanol (1:1) and subjected to immunofluorescence with the indicated primary and secondary antibodies. Confocal images were captured on a Nikon A1 laser scanning confocal microscope at either 20× (Fig 5E, left panel) or 60× (Fig 5E, right panel) magnification; representative images are shown. Due to imaging conditions, the optical section thickness is increased at 20× compared to 60× magnification. Calibration bars in images showing rMAD2 represent arbitrary fluorescence units. Scale bars represent 50 and 10 μm for 20× and 60× magnification, respectively.
- F
Surface and intracellular SERT signal from scramble‐ and MAD2‐shRNA‐infected neurons (n = 40 and n = 30, respectively) was quantified within regions of interest (ROIs) using ImageJ software, and the resulting ratios were compared using an unpaired two‐tailed t‐test, the P‐value was below 0.0001 (n = 4 biological replicates). Error bars represent SD. The right part provides four additional representative images of both scramble‐shRNA and MAD2‐shRNA expressing serotonergic neurons (SERT: orange, nuclei: blue). Scale bars represent 30 μm.
- G
Model of SERT endocytosis in somata of serotonergic neurons: MAD2 (in its closed conformation) binds a MAD2 interaction motif (MIM) in the SERT C‐terminus and forms a complex with other spindle assembly checkpoint proteins (SAC) and adaptor protein 2 (AP2). Subsequent endocytosis delivers SERT to the recycling endosome.
- A–E
Primary rat dorsal raphe neurons were cultured and fixed as for Fig EV3 and subjected to immunofluorescence with the indicated antibodies. Confocal images were captured on a Nikon A1 laser scanning confocal microscope at 60× magnification. White boxes in merged image indicate zoomed area in the lower left corner. Scale bars represent 20 μm in full‐size images and 2 μm in zoomed areas.
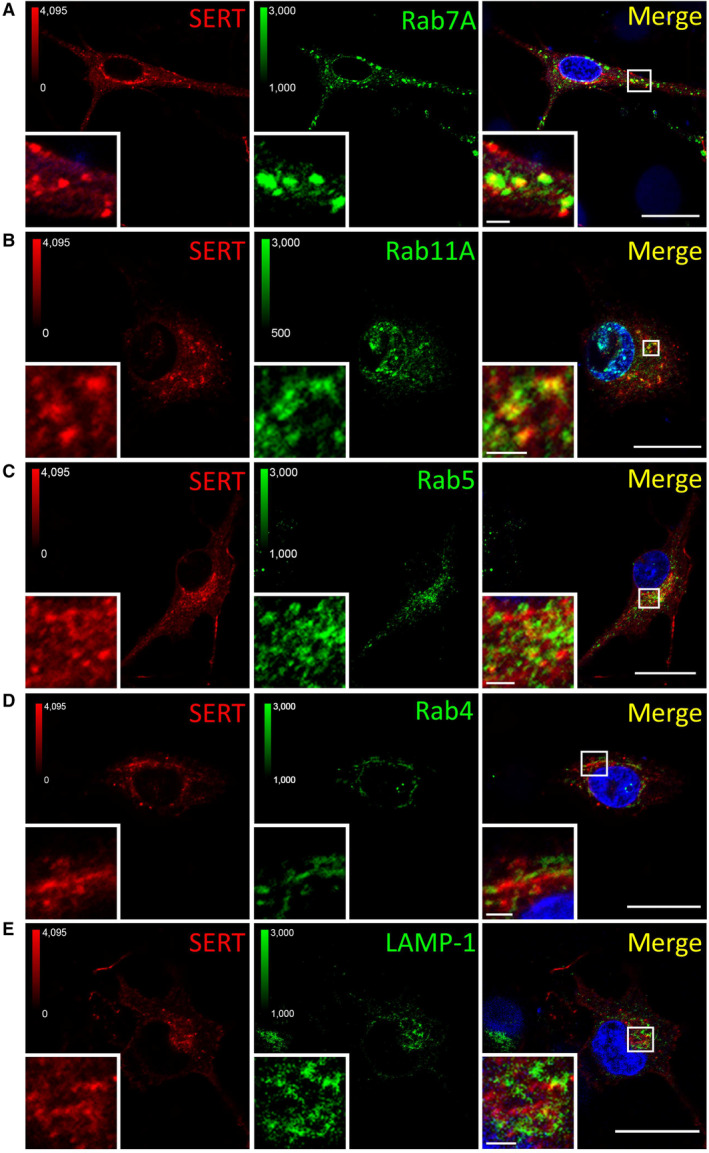
- A–E
Primary rat dorsal raphe neurons were cultured and imaged as in Fig EV4, using the indicated primary antibodies. Scale bars represent 20 and 2 μm in full‐size images and zoomed areas, respectively.
References
Publication types
MeSH terms
Substances
LinkOut - more resources
Full Text Sources
Molecular Biology Databases
Research Materials
