. 2023 Aug 2:12:RP86913.
doi: 10.7554/eLife.86913.

Vitamin D induces SIRT1 activation through K610 deacetylation in colon cancer

Affiliations

Vitamin D induces SIRT1 activation through K610 deacetylation in colon cancer

José Manuel García-Martínez et al. Elife. .

Abstract

Posttranslational modifications of epigenetic modifiers provide a flexible and timely mechanism for rapid adaptations to the dynamic environment of cancer cells. SIRT1 is an NAD+-dependent epigenetic modifier whose activity is classically associated with healthy aging and longevity, but its function in cancer is not well understood. Here, we reveal that 1α,25-dihydroxyvitamin D3 (1,25(OH)2D3, calcitriol), the active metabolite of vitamin D (VD), promotes SIRT1 activation through auto-deacetylation in human colon carcinoma cells, and identify lysine 610 as an essential driver of SIRT1 activity. Remarkably, our data show that the post-translational control of SIRT1 activity mediates the antiproliferative action of 1,25(OH)2D3. This effect is reproduced by the SIRT1 activator SRT1720, suggesting that SIRT1 activators may offer new therapeutic possibilities for colon cancer patients who are VD deficient or unresponsive. Moreover, this might be extrapolated to inflammation and other VD deficiency-associated and highly prevalent diseases in which SIRT1 plays a prominent role.

Keywords: VDR; acetylation; cancer biology; colorrectal cancer; human; vitamin D.


Conflict of interest statement

JG, AC, JM, MF, MF, JC, AD, AB, AM, ML, CG No competing interests declared

Figures

Figure 1.
Figure 1.. 1,25(OH)2D3 increases SIRT1 levels in CRC cells and VDR is required to ensure basal levels.
(A)-(D) HCT 116 or HT-29 CRC cells cultured under standard conditions and where indicated, treated with 1α,25-dihydroxyvitamin D3 (1,25(OH)2D3), 100 nM, added 24 hr before harvesting. (E)-(H) ShVDR cells were derived from HCT 116 by stable and specific knock-down of vitamin D receptor (VDR) using specific shRNA and are compared to ShControl cells that contain normal VDR levels (Larriba et al., 2011). Cell extracts were fractionated in all cases. (A) Confocal imaging of SIRT1 (green) in CRC (HCT 116 and HT-29) cells and fluorescence intensity quantification of 3 independent experiments using ImageJ software. For each experiment, three different fields were evaluated per slide. Scale bars:25 µm. (B) Western-blot analysis of 1,25(OH)2D3 effects on levels of SIRT1 in nuclear extracts (NE) from indicated CRC cells. Representative blots and statistical analysis using TBP as loading controls. (C)-(E) RT-qPCR analysis of the effect of 1,25 (OH)2D3 in indicated colon cancer cells. Values normalized with endogenous control (18 S RNA) are referred as fold induction over cells without 1,25(OH)2D3. (C) Effect of 1,25 (OH)2D3 on SIRT1 gene expression. (D) validation of 1,25 (OH)2D3 activity on the canonical target gene cytochrome P450 family 24 subfamily A member 1, CYP24A1, in HT-29 colon cancer cells. (E) Requirement of vitamin D receptor (VDR) for 1,25 (OH)2D3 induction of SIRT1 gene expression. (F) Effect of VDR knock-down on SIRT1 protein content evaluated by confocal imaging of ShControl and ShVDR HCT 116 colon cancer cells to detect SIRT1 (green). Scale bars represent 25 μm. On the right, quantification of fluorescence intensity using ImageJ software; for each experiment, three different fields were evaluated per slide. (G) Western blot analysis of the effect of 1,25 (OH)2D3 on nuclear accumulation of SIRT1 in cells depleted (ShVDR) or not (ShControl) of VDR. (H) Specificity of 1,25 (OH)2D3 effects on SIRT1 by western blot analysis of the alternative nuclear sirtuin, SIRT7. Statistical analysis of three independent experiments in each panel was performed by Student t-test (A) to (D) and (H) or by One-Way ANOVA (E)-(F). For (G), statistical analysis of the four groups by ANOVA is represented by * and comparison of the two indicated groups by Students t test, by #. In all panels, values represent mean ± SEM of triplicates corresponding to biological replicates; * or # p<0.05; ** p<0.01; *** p<0.001. Raw data are available in Figure 1—source data 1.
Figure 2.
Figure 2.. 1,25(OH)2D3 induces specific SIRT1 deacetylase activity independently of levels, in CRC cells.
Cells were cultured as in Figure 1. (A) and (G) NAD+-dependent deacetylase activity, (B) Evaluation of nuclear NAD+ levels. (C) to (F) Western blot analysis using TBP or H3 as loading controls. Representative western blots and statistical analysis of 3 independent experiments. (A) NAD+-dependent deacetylase activity measured on nuclear extracts of HT-29 cells. Relative luciferase units (RLU) were calculated as fold induction relative to the corresponding control. (B) Evaluation of nuclear NAD+ levels in HT-29 CRC cells in response to 1,25(OH)2D3, with data expressed as fold induction over the control, untreated cells. (C) 1,25(OH)2D3 effects on the interaction between vitamin D receptor (VDR) and SIRT1. Input (5%) and flow through (FT) are shown (D) 1,25(OH)2D3 effects on the acetylation status of the SIRT1 substrate FoxO3a in nuclear extracts immunoprecipitated with anti-acetyl lysine antibodies. Input (5%) and flow through (FT) are shown. (E) 1,25(OH)2D3 effects on the nuclear acetylation of the SIRT1 substrate H3K9 (Ace H3K9). (F) Requirement of VDR for deacetylation of Ace H3K9 in response to 1,25(OH)2D3 (G) Quantification of NAD+-dependent deacetylase activity on SIRT1 immunoprecipitates from nuclear extracts (NE) of HCT 116 CRC cells treated or not with 1,25(OH)2D3. Values represent mean ± SEM of n=3 independent experiments. Statistical analysis by Student t test, n≥3 biological replicates and values represent mean ± SEM; *p<0.05; **p<0.01; *** p<0.001. Raw data are available in Figure 2—source data 1.
Figure 3.
Figure 3.. CRC biopsies exhibit discrepancies between SIRT1 protein levels and deacetylase activity.
(A)-(B) TNM plot analysis of VDR (A) or SIRT1 (B) gene expression in 160 paired samples of non-cancer adjacent tissue (normal) versus adenocarcinoma tissue (tumour). Data was collected from TCGA-COAD database. SIRT1 or VDR expression is shown as transcripts per million (TPM) in log2. Tumour and control samples were compared with Mann-Whitney U test. The statistical significance cut off was set at p<0.01. (C) Association analysis between VDR and SIRT1 protein levels in human colon cancer samples, stage 2 and 4. Cut-off points to separate proteins between high- or low- expression levels were for SIRT1 expression median of Histoscore, and negative versus positive staining for VDR expression. Statistical analysis was performed with Chi-square test. (D) Representative micrographs at ×40 from immunostaining for vitamin D receptor (VDR) or SIRT1 on human samples of healthy colon or CRC patients. Scale bars: 20 µm. Immunostainings were revealed with DAB (diaminebenzidine) and thus, positiveness is highlighted by light or dark brown according to their low or high protein expression. Counterstaining with hematoxilin stains nuclei in dark blue and cytoplasm in light blue. (E) Profile for SIRT1 content from healthy to colon cancer human samples. The profile was obtained from Histoscore variations. Tumour and control samples were compared with Mann-Whitney U test. The statistical significance cut off was set at p<0.01. (F) Western-blot analysis of the levels of SIRT1 and its substrate Ace H3K9 in total lysates from intestinal healthy (HIEC6) or CRC cells. Representative western blot with ERK as loading control. (G) Western-blot analysis from human patient samples, with patient number indicated at the top. CRC samples (T) and adjacent nontumor tissue (NT) were probed for SIRT1 and its substrate Ace H3K9 (as in F). Frozen samples were obtained from HUFA patients. (H) NAD+-dependent deacetylase activity on immunoprecipitated SIRT1 from patient lysates. Values for T and NT samples were corrected according to immunoprecipitated SIRT1 levels shown on the western underneath the graph. Values for T samples were referred to values of NT and data (duplicates) are expressed as fold induction. Patient number is indicated at the bottom. (I) Western-blot analysis for SIRT1 and its substrate Ace H3K9 levels in total lysates from alternative human CRC samples (as in G). Patient number is indicated at the top. (J) NAD+-dependent deacetylase activity on immunoprecipitated SIRT1 from patient lysates presented in (I). Levels of immunoprecipitated SIRT1 are presented in the bottom panel. SIRT1 deacetylase activity in patients is presented as fold induction, referred to the first patient sample (patient #10). Patient number is indicated at the bottom. Raw data are available in Figure 3—source data 1.
Figure 4.
Figure 4.. 1,25(OH)2D3 induces SIRT1 activity through auto deacetylation.
HCT 116 CRC cells were cultured under standard conditions in DMEM containing LiCl (40 mM) to mimic Wnt signalling before addition of 1,25(OH)2D3, 100 nM or SRT1720 (20 μM) for the last 24 hr; after fractionation nuclear extracts (NE) were used. (A)-(C) and (E)-(F) Immunoprecipitation (IP) using anti-acetyl lysine antibody from nuclear extracts (NE) of indicated cells and western-blot analysis to evaluate changes in acetylation of SIRT1; TBP was used in the Flow Through (FT) as loading control. Representative western-blots and statistical analysis are shown in all panels. (A) Effect of 1,25(OH)2D3 on acetylation of SIRT1. (B) Effect of SRT1720 on acetylation of SIRT1. (C) Requirement of VDR for 1,25(OH)2D3 or SRT1720 effects on acetylation of SIRT1 in Sh Control and ShVDR HCT 116 cells. (D) SIRT1 scheme with functional domains and putative acetylation sites (top) and sequence alignment. Conserved putative acetylation targets for activation/inactivation of SIRT1 shown at the bottom. (E) Acetylation status of exogenous SIRT1 wild type (WT) or mutants (H363Y or K610R). HCT 116 were transiently transfected with pcDNA expression vectors: empty (-), myc-tagged SIRT1 wild type (WT) or mutants: H363Y inactive or K610R, 48 hr before harvesting. Immunoprecipitation using anti-acetyl-lysine antibodies and western blot detection using myc antibodies. Representative western-blot and statistical analysis; MYC and TBP in the flow through (FT) serve as loading controls. (F) Western-blot analysis of the interaction of SIRT1 wild type and mutants, with vitamin D receptor (VDR). Expression and analysis as in (E). (G) Western-blot analysis of the effect of SIRT1 mutant expression on Ace H3K9. (H) In vitro NAD+-dependent deacetylase activity assays on equivalent amounts of exogenous SIRT1 wild type (WT), K610R and inactive H363Y mutants immunoprecipitated using anti-myc antibodies. Statistical analysis in all panels except (D) and (G) by One Way ANOVA of n>3 independent experiments. Values represent mean ± SEM; *p<0.05; **p<0.01; *** p<0.001. Raw data are available in Figure 4—source data 1.
Figure 5.
Figure 5.. SIRT1 activation rescues antiproliferative effects of 1,25(OH)2D3in unresponsive CRC cells.
Cells were cultured as in previous figures and treatments with NAA (300 uM), SRT1720 (20 μM) and 1,25 (OH)2D3 (100 nM) also were for the last 24 hr. (A) Flow cytometry analysis of cell cycle from indicated cells treated (+) or not (-) with 1,25(OH)2D3. Numbers correspond to the percentage of cells in the indicated phases expressed as mean ± SEM. (B) Effect of NAA on the 1,25(OH)2D3-driven blockades of HCT 116 CRC cell proliferation. (C) Effects of SRT1720 on cell cycle of HCT 116 CRC cells by flow cytometry analysis. Numbers correspond to the percentage of cells in the indicated phases expressed as mean ± SEM. (D) Flow cytometry analysis of cell cycle response to 1,25 (OH)2D3 in ShControl and ShVDR HCT 116 cells. Numbers correspond to the percentage of cells in the indicated phases expressed as mean ± SEM. (E) Proliferation curves of ShControl or ShVDR HCT 116 colon cancer cells in response to 1,25 (OH)2D3 (100 nM) (grey), compared to control with vehicle (green) or SRT1720 (red). Statistical analysis by One-Way ANOVA of three independent experiments; values represent mean ± SEM of triplicates; * p<0.05; ** p<0.01; *** p<0.001.
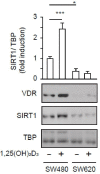
Author response image 1.
Author response image 1.. Vitamin D requires the presence of VDR to increase SIRT1 protein levels.
SW480 and SW620 cell lines derive from the same patient, from primary tumor and lung metastasis respectively and differ in their VDR content. 1α,25-dihydroxyvitamin D3 (1,25(OH)2D3) was added at 100 nM for 24 h. Representative western-blot, where TBP was used as a loading control, of four biological replicates. Statistical analysis by ANOVA and values represent mean ± SEM; *p<0.05; *** p<0.001.
Author response image 2.
Author response image 2.. Immunoprecipitation of endogenous SIRT1 to show interaction with VDR.
1α,25-dihydroxyvitamin D3 (1,25(OH)2D3) was added at 100 nM for 24 h. Representative western-blots, where TBP was used as a loading control.
Author response image 3.
Author response image 3.. Immunoprecipitation of exogenous myc-tagged SIRT1 to show interaction with VDR of wild type (WT) or mutants.
1α,25-dihydroxyvitamin D3 (1,25(OH)2D3) was added at 100 nM for 24 h. FT: Flow Through. TBP as a loading control.

Update of

  • doi: 10.1101/2023.02.22.529558
  • doi: 10.7554/eLife.86913.1
  • doi: 10.7554/eLife.86913.2

References

    1. An BS, Tavera-Mendoza LE, Dimitrov V, Wang X, Calderon MR, Wang HJ, White JH. Stimulation of Sirt1-regulated FoxO protein function by the ligand-bound vitamin D receptor. Molecular and Cellular Biology. 2010;30:4890–4900. doi: 10.1128/MCB.00180-10. - DOI - PMC - PubMed
    1. Bartha Á, Győrffy B. TNMplot.com: a web tool for the comparison of gene expression in normal, tumor and metastatic tissues. International Journal of Molecular Sciences. 2021;22:1–12. doi: 10.3390/ijms22052622. - DOI - PMC - PubMed
    1. Bikle D, Christakos S. New aspects of vitamin D metabolism and action - addressing the skin as source and target. Nature Reviews. Endocrinology. 2020;16:234–252. doi: 10.1038/s41574-019-0312-5. - DOI - PubMed
    1. Bonkowski MS, Sinclair DA. Slowing ageing by design: the rise of NAD+ and sirtuin-activating compounds. Nature Reviews. Molecular Cell Biology. 2016;17:679–690. doi: 10.1038/nrm.2016.93. - DOI - PMC - PubMed
    1. Bray F, Ferlay J, Soerjomataram I, Siegel RL, Torre LA, Jemal A. Global cancer statistics 2018: GLOBOCAN estimates of incidence and mortality worldwide for 36 cancers in 185 countries. CA. 2018;68:394–424. doi: 10.3322/caac.21492. - DOI - PubMed

Publication types

LinkOut - more resources