. 2023 Aug 1;12(8):2.
doi: 10.1167/tvst.12.8.2.

Assessing the Sensitivity of OCT-A Retinal Vasculature Metrics

Affiliations

Assessing the Sensitivity of OCT-A Retinal Vasculature Metrics

Jacob Szpernal et al. Transl Vis Sci Technol. .

Abstract

Purpose: The purpose of this study was to examine the sensitivity of quantitative metrics of the retinal vasculature derived from optical coherence tomography angiography (OCT-A) images.

Methods: Full retinal vascular slab OCT-A images were obtained from 94 healthy participants. Capillary loss, at 1% increments up to 50%, was simulated by randomly removing capillary segments (1000 iterations of randomized loss for each participant at each percent loss). Thirteen quantitative metrics were calculated for each image: foveal avascular zone (FAZ) area, vessel density, vessel complexity index (VCI), vessel perimeter index (VPI), fractal dimension (FD), and parafoveal intercapillary area (PICA) measurements with and without the FAZ (mean PICA, summed PICA, PICA regularity, and PICA standard deviation [PICA SD]). The sensitivity of each metric was calculated as the percent loss at which 80% of the iterations for a participant fell outside of two standard deviations from the sample's normative mean.

Results: The most used OCT-A metrics, FAZ area and vessel density, were not significantly different from normative values until 27.69% and 16.00% capillary loss, respectively. Across the remaining metrics, metric sensitivity ranged from 6.37% (PICA SD without FAZ) to 39.78% (Summed PICA without FAZ).

Conclusions: The sensitivity of vasculature metrics for detecting random capillary loss varies substantially. Further efforts simulating different patterns of capillary loss are needed for comparison. Additionally, mapping the repeatability of metrics over time in a normal population is needed to further define metric sensitivity.

Translational relevance: Quantitative metrics vary in their ability to detect vascular abnormalities in OCT-A images. Metric choice in screening studies will need to balance expected capillary abnormalities and the quality of the OCT-A images being used.


Conflict of interest statement

Disclosure: J. Szpernal, None; M. Gaffney, None; R.E. Linderman, None; C.S. Langlo, None; K. Hemsworth, None; A. Walesa, None; B.P. Higgins, None; R.B. Rosen, OptoVue (C), OptoVue (P), Boehringer-Ingelheim (C), Astellas (C), Genentech-Roche (C), Opticology (I), Guardion (I), CellView (C), Regeneron (C).Topcon (F), OcuSciences (F), Lumithera (C), US Patent WO 2016/109750 Al, 43625.140US01 (P); T.Y.P. Chui, None; J. Carroll, AGTC (F), MeiraGTx (F), OptoVue (F), Translational Imaging Innovations (I, P), US Patent 9,427,147 (P)

Figures

Figure 1.
Figure 1.
OCT-A scaling and alignment workflow. (1) Five images were exported from Optovue's Avanti Revue XR system and saved as tif images. (2) These five images were registered using bUnwarpJ in Fiji and then averaged together using Z-project in ImageJ and cropped to 304 by 304 pixels. (3) All averaged images were then set to the same scale. (4) These images were then aligned (wire diagram) using the reported foveal centers (white cross) from Optovue's ReVue software. Once the images were aligned, the largest common 2380 × 2380 um square area (shaded region) was cropped from each image. (5) The cropped images were resized to be 304 by 304 pixels. Three participants are shown for illustration purposes: JC_11931 (12-year-old boy), JC_11598 (15-year-old girl), and JC_11415 (25-year-old woman), although the process included all 94 participants.
Figure 2.
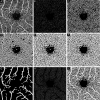
Figure 2.
Example of the OCT-A image processing pipeline. The aligned and cropped image from each participant was processed using a custom MATLAB script to clean the OCT-A image and convert into a binary image for metric calculations. Shown in panel (A) is the image from one representative subject, AD_10055 (26-year-old man) after being contrast stretched and cleaned by subtracting a background image (which was a variant of the input image with any segments with a radius of less than 15 pixels having been removed). (B) The image was then contrast stretched again, resized to 1824 × 1824 pixels, thresholded into a binary image, and then skeletonized. (C) The skeleton created in panel B was dilated using the function imdilate with a structuring element disk with a radius of 5 pixels to segment the small underlying vasculature within the original OCT-A image. (D) An enlarged contrast stretched version of panel A underwent adaptive thresholding to separate the background and foreground of the image, morphological opening to reduce incorrectly segmented pixels, and was further thresholded. Resulting in an image that was optimized for segmentation of the larger blood vessels within the image. (E) A skeleton of panel C was then combined with panel D to generate an image in which all vasculature within the image was segmented from the background. The image was then manually inspected to remove any noise that remained within the FAZ area, resulting in the cleaned version in panel (F). Using an enlarged contrast stretched version of panel A, a mask was created of the arterioles/venules, resulting in the image in panel (G). The inverse of panel G was then used to create a second binary image where the larger arterioles and venules were removed, as shown in panel (H). This was then multiplied by panel F and skeletonized. The skeleton was then dilated with a structuring element disk with radius of 5 pixels and added to the arterioles/venules mask panel G to produce the binary image in panel (I).
Figure 3.
Figure 3.
Depicting random capillary loss. Shown are three binary images depicting varying degrees of simulated capillary loss (0%, 10%, and 20%) from participant JC_10567 (26-year-old woman).
Figure 4.
Figure 4.
Depicting sensitivity of PICA SD with FAZ and vessel density in single individuals. Top panels plot the change in absolute metric value as a function of increasing capillary loss for PICA SD with FAZ (A) JC_12070 (61-year-old man) and vessel density (B) JC_10888 (51-year-old man). The dotted line depicts the normative mean of all individuals at 0% capillary loss. The shaded gray area depicts ± 2 SD of the normative mean of each metric (note that only the -2 SD is shown for vessel density to improve visibility of the individual data points). Error bars depict the 20th (upper limit) and 80th (lower limit) percentile of the 1000 trials. The metric was deemed sensitive when 800 of the 1000 trials surpassed two SDs. In these examples, 800 trials surpassed two SDs at 14% and 14.99% of intended capillary loss for A and B, respectively. The bottom panels show cumulative frequency histograms for the same individuals – the same respective sensitivities, 14% for JC_12070 (C) and 14.99% for JC_10888 (D), can be seen where the curve intersects the 80% of the trials line.
Figure 5.
Figure 5.
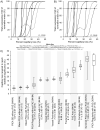
Relative metric rankings. Shown are relative metric rankings for two participants: (A) JC_10590 (23-year-old woman) and (B) JC_10648 (14-year-old man). Each panel depicts the sensitivity at which at least 800 of 1000 trials surpassed two SD of the normative mean for a given metric (horizontal black line). Each shape delineates the percent capillary loss at which a metric reached significance. For the participant in panel A, the metric sensitivity ranged from 5.62% capillary loss for PICA SD without FAZ to 39.60% capillary loss for summed PICA without FAZ. For the participant in panel B, metric sensitivity ranged from 6.13% capillary loss for PICA SD without FAZ to 46.20% capillary loss for PICA regularity with FAZ. Note that some metrics had identical or closely overlapping sensitivity values. For the participant in panel A vessel density, summed PICA with FAZ and VPI had sensitivities of 15.77%, 15.77%, and 15.99%, respectively. For the participant in panel B vessel density, summed PICA with FAZ, VPI, and PICA SD with FAZ had sensitivities of 15.71%. 15.71%, 16.75%, and 17.05%, respectively. Shown in (C) are box and whisker plot characterizing metric sensitivity across all participants. Upper and lower limits of the whisker plot represent the range of capillary loss achieving significance. Exclusive median of first and third quartile depicted as bottom and top of each box, respectively. Mean of each metric depicted as a filled circle inside of the box with median depicted as a horizontal line within the box. The values on the X-axis show the number of participants (#/94) that achieved significance at a capillary loss of 50% or less. The mean rank ± SD and rank range is provided for each metric.

References

    1. Ersoz MG, Hocaoglu M, Sayman Muslubas I, Arf S, Karacorlu M. Macular telangiectasia type 2: Acircularity index and quantitative assessment of foveal avascular zone using optical coherence tomography angiography. Retina . 2020; 40(6): 1132–1139. - PubMed
    1. Zeimer M, Gutfleisch M, Heimes B, Spital G, Lommatzsch A, Pauleikhoff D.. Association between changes in macular vasculature in optical coherence tomography- and fluorescein- angiography and distribution of macular pigment in type 2 idiopathic macular telangiectasia. Retina . 2015; 35(11): 2307–2316. - PubMed
    1. Charbel Issa P, Gillies MC, Chew EY, et al. . Macular telangiectasia type 2. Prog Retin Eye Res . 2013; 34: 49–77. - PMC - PubMed
    1. Wilk MA, McAllister JT, Cooper RF, et al. . Relationship between foveal cone specialization and pit morphology in albinism. Invest Ophthalmol Vis Sci . 2014; 55(7): 4186–4198. - PMC - PubMed
    1. Tam J, Dhamdhere KP, Tiruveedhula P, et al. . Subclinical capillary changes in non-proliferative diabetic retinopathy. Optom Vis Sci . 2012; 89(5): E692–E703. - PMC - PubMed

Publication types