. 2023 Aug 2;15(707):eadf2059.
doi: 10.1126/scitranslmed.adf2059. Epub 2023 Aug 2.

Alternative splicing of CEACAM1 by hypoxia-inducible factor-1α enhances tolerance to hepatic ischemia in mice and humans

Affiliations

Alternative splicing of CEACAM1 by hypoxia-inducible factor-1α enhances tolerance to hepatic ischemia in mice and humans

Kenneth J Dery et al. Sci Transl Med. .

Abstract

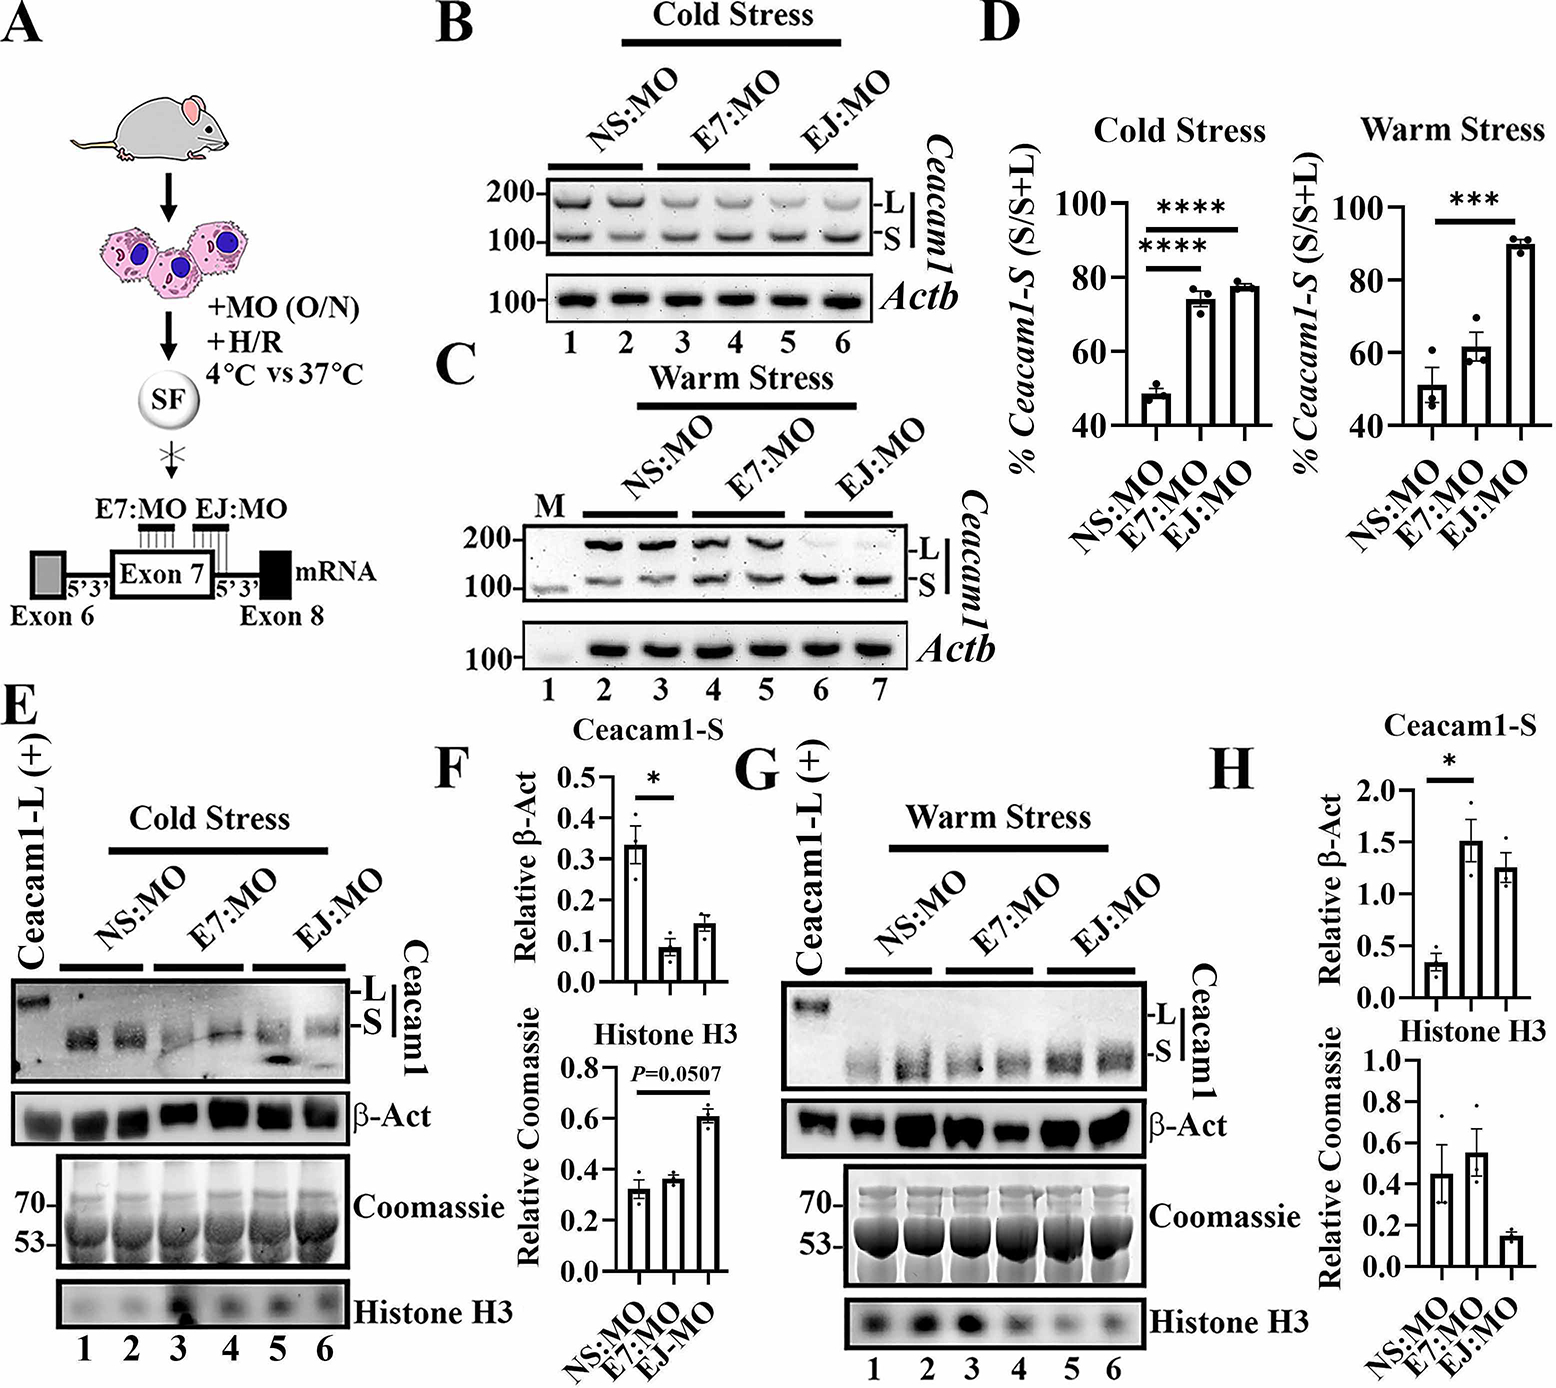
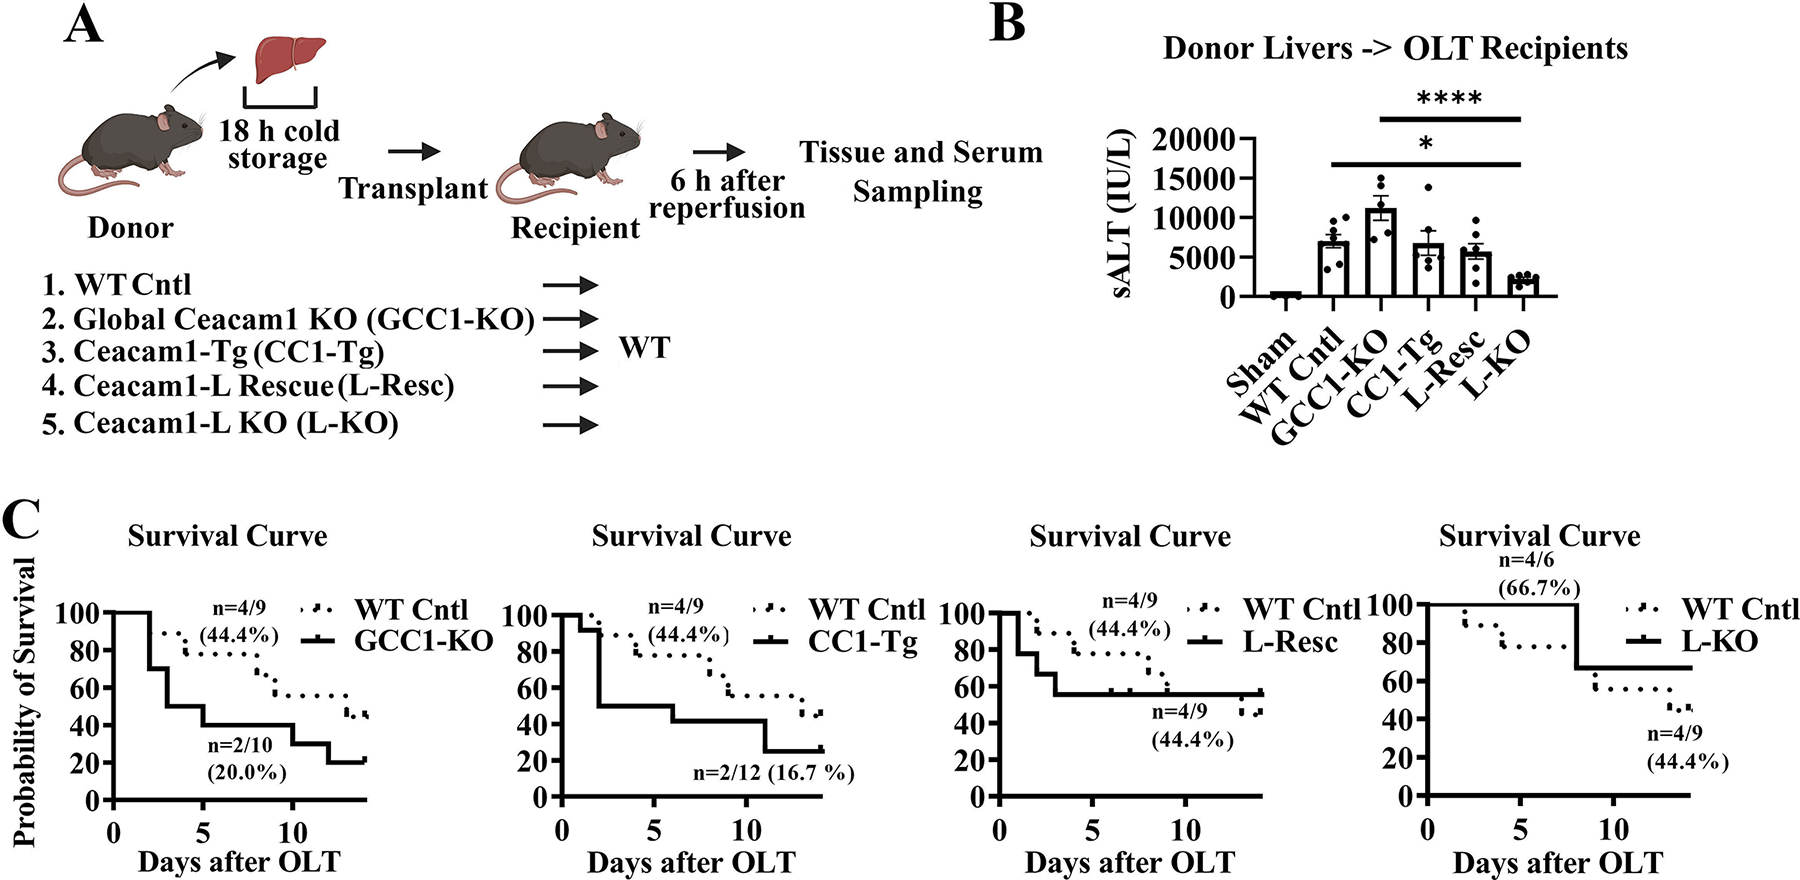
Although alternative splicing (AS) drives transcriptional responses and cellular adaptation to environmental stresses, its contributions in organ transplantation have not been appreciated. We have shown that carcinoembryonic antigen-related cell adhesion molecule (Ceacam1; CD66a), a transmembrane biliary glycoprotein expressed in epithelial, endothelial, and immune cells, determines donor liver transplant quality. Here, we studied how AS of Ceacam1 affects ischemia-reperfusion injury (IRI) in mouse and human livers. We found that the short cytoplasmic isoform Ceacam1-S increased during early acute and late resolution phases of warm IRI injury in mice. Transfection of Ceacam1-deficient mouse hepatocytes with adenoviral Ceacam1-S mitigated hypoxia-induced loss of cellular adhesion by repressing the Ask1/p-p38 cell death pathway. Nucleic acid-blocking morpholinos, designed to selectively induce Ceacam1-S, protected hepatocyte cultures against temperature-induced stress in vitro. Luciferase and chromatin immunoprecipitation assays identified direct binding of hypoxia-inducible factor-1α (Hif-1α) to the mouse polypyrimidine tract binding protein 1 (Ptbp1) promoter region. Dimethyloxalylglycine protected mouse livers from warm IR stress and hepatocellular damage by inhibiting prolyl hydroxylase domain-containing protein 1 and promoting AS of Ceacam1-S. Last, analysis of 46 human donor liver grafts revealed that CEACAM1-S positively correlated with pretransplant HIF1A expression. This also correlated with better transplant outcomes, including reduced TIMP1, total bilirubin, proinflammatory MCP1, CXCL10 cytokines, immune activation markers IL17A, and incidence of delayed complications from biliary anastomosis. This translational study identified mouse Hif-1α-controlled AS of Ceacam1, through transcriptional regulation of Ptbp1 promoter region, as a functional underpinning of hepatoprotection against IR stress and tissue damage in liver transplantation.


Conflict of interest statement

Competing interests: All authors declare that they have no competing interests and have not participated in consultation work related to this project.

Figures

Fig. 1.
Fig. 1.. Acute liver injury promotes Ceacam1 alternative splicing (AS).
(A) Western blots of Ceacam1 and Hif-1α from livers and serum isolated from C57BL/6 mice subjected to wIRI at time-points 0 h (Sham) vs. 6h post-reperfusion. (B) Quantitation of hepatic Ceacam1 and Hif-1α expression from panel A, relative to β-Act (n=3–4/group). Hif-1α Sham vs. 6h by unpaired Student’s t-test (P=0.0324). (C) Total mRNAs were subjected to exon junction primers designed to measure each splice variant. M is marker with sizes (bp) shown on the left and L and S denote Ceacam1-L or Ceacam1-S, respectively. Biological replicates/group are represented by black line above each blot. (D) Quantitation of % Ceacam1-S relative to total Ceacam1 mRNA from panel D was analyzed by Kruskal-Wallis test (P<0.034; n=3–4/group). (E) Serum AST (sAST) was analyzed by one-way ANOVA (P<0.0001). IU/L is International Units Per Liter. Tukey’s HSD test for Sham vs. 6h and Sham vs. 12h were both P<0.0001. For panels B-D, Sham, Actb, and β-Act served as internal controls. Data shown are mean±SEM, using at least n=3–9/group.
Fig. 2.
Fig. 2.. Ad: Ceacam1-S rescues hypoxia-triggered cellular stress in murine hepatocytes through Ask1/p-p38 signaling.
(A) Ceacam1-deficient (KO) mouse hepatocytes were transfected with Ad-viral particles at the indicated MOI (multiplicity of infection). WT lysates (+) show endogenous amounts. (B). Quantitation of Ad: Ceacam1 isoforms and Grp78 protein expression from 50 vs. 25 MOI lysates were analyzed by two-way ANOVA for both groups (P<0.0001, Ceacam1; P=0.0005, Grp78), followed by Tukey’s HSD. Expression was relative to internal standard Vnc (n=3–4/group). (C) Bright-field microscopy of Ad-expressing hepatocytes treated with hypoxia (+H) for the indicated time. Black arrows indicate areas of cellular adhesion, whereas black arrowheads show lack thereof. Representative specimens (n=3/group; all images were 125–150 x original magnification except for 0 x for WT -H, scale bar shows 100 μm). Representative specimens (n=3/group; original magnification ×160, scale bar shows 100 μm). (D) Viruses were given undiluted (lanes 1, 4, 10) or diluted 1/2 (lanes 2, 5, 11), 1/5 (lanes 3, 6, 12), 1/10 (lanes 7, 13), 1/20 (lanes 8, 14), and 1/40 (lanes 9, 15) MOI concentration as denoted by the descending black triangle. Western blots were evaluated for protein expression of Ceacam1, Ask1, p-p38 and β-Act (n=3–6/group). (E) Quantification of data from panel D. A Kruskal-Wallis test was used for parallel p-p38 samples (P=0.0235) relative to β-Act (n=3–6/group). The collective set of MOIs were grouped for Ceacam1 and p-p38 analyses. Post-hoc analyses were performed using an uncorrected Dunn’s test (P=0.0177). Data shown are mean±SEM and represent at least three biological replicates. *, ** represent P values <0.05 and <0.01.
Fig. 3.
Fig. 3.. Induction of AS of Ceacam1 by splice-blocking morpholino oligomers (MOs) protects murine hepatocytes against temperature-induced stress in vitro.
(A) Experimental scheme targeting variable exon 7 using morpholinos (MO) under hypoxia-reoxygenation (H/R) stimulation (see Supplemental Materials for more details). (B-C) Exon-junction RT-PCR of Ceacam1 isoforms in cold storage stress (4°C) vs. warm storage stress (37°C) conditions, (n=3/group). L and S notations mark isoform positions, and Actb is the loading control. (D) Quantification of Ceacam1-S expression based on panels B-C data. Expression normalized to total Ceacam1 mRNA. One-way ANOVA analyses for cold and warm storage stress MO groups (P=0.0001 and P=0.0008) was followed by Tukey’s HSD test for EJ:MO or E7:MO vs. NS:MO cold storage stress samples (P<0.0001 each) and for EJ:MO vs. NS:MO warm storage stress samples (P<0.0007). (E, G) Western blot detection for Ceacam1, β-actin and histone H3 under cold stress (panel E) vs. warm stress (panel G). Coomassie staining was also performed to normalize histone H3 expression. (F, H) Quantification of protein data from panels E and G. Expression normalized to β-actin and Coomassie stain. A Kruskal-Wallis test was used for cold and warm storage stress Ceacam1 MO groups (P=0.0107 and P=0.0250) were followed by Tukey’s HSD test for E7:MO vs. NS:MO cold storage stress samples (P<0.0225) and E7:MO vs. NS:MO warm storage stress samples (P<0.0341), (n=3/group). Histone H3 served as an indicator of hepatocellular stress. Data shown are mean±SEM and represent at least three biological replicates. *, ***, **** represent P values <0.05, <0.001, and <0.0001, respectively, for differences between groups.
Fig. 4.
Fig. 4.. Hepatic Ceacam1-L exacerbates liver IRI and reduces OLT survival.
(A) Genetically modified mouse (C57BL/6) donor livers, subjected to extended cold storage (18h), were transplanted to syngeneic WT recipients. Donors were characterized by: Global Ceacam1 deficiency (GCC1-KO, n=10); liver-specific rat Ceacam1-L overexpression in the C57BL/6 background (CC1-Tg; n=9), or the Global Ceacam1-KO background (L-Resc, n=9); and liver-specific Ceacam1-L deficiency (L-KO, n=9). (B) Serum was collected 6h post-reperfusion for ALT analyses (IU/L, n=3–8/group). Ordinary one-way ANOVA analyses of donor liver groups (P=0.0001) were followed by Tukey’s HSD test for WT Control (Cntl) vs. L-KO (P=0.0250) and GCC1-KO vs. L-KO (P<0.0001). (C) Animals were monitored for 14 days, and cumulative survival rates were estimated using the Kaplan-Meier method. Survival curves were compared using log-rank tests where the calculated observed number of deaths in each group was compared to the number expected if there were no differences between the groups. The dotted line indicates WT controls (n=9), while the solid indicates Ceacam1 experimental groups.
Fig. 5.
Fig. 5.. Hif-1α influences pre-and post-transcriptional Ceacam1 expression in murine hepatocytes in vitro.
(A) Experimental scheme using inhibitor Echinomycin (Ecn) or stabilizer (CoCl2) of Hif-1α in oxygen-stress conditions. (B) Time course of Hif-1α, Ceacam1-S, and histone H3 expression with hypoxia followed by indicated periods of normoxia. (C) Quantitation of histone H3 and Hif-1α from parallel panel B samples, measured by one-way ANOVA Kruskal Wallis test [Hif-1α (P<0.0139), histone H3 (P<0.0197) mock vs. 0 h]. (D) Quantitation of AST levels from culture media collected from panel B samples. (E) qRT-PCR detection of mRNA coding for Hif-1α relative Actb expression. (F) Exon junction RT-PCR and quantification for Ceacam1 isoforms and Actb analyzed by one-way ANOVA (P=0.00023, P=0.0007, mock vs. 50 and 10 nM) (G) Western blot of cultured normoxic hepatocytes treated with CoCl2 for either 4h or 18h (upper) panel. Magnified lanes highlight the production of Ceacam1-L. Positive Ceacam1-L control obtained from mouse intestinal tissue. Quantitation of Ceacam1-S and Hif-1α, relative to β-Act are in lower panel. (H) Immunofluorescence detection of Hif-1α and Ceacam1 from mouse hepatocytes in vitro exposed to hypoxia for 90min (H+). White arrows indicate cellular Ceacam1 location. Original magnification is x20, scaled upwards 120x for visualization. Scale bar shows 100 μm. Panels C-G were analyzed by one-way ANOVA. Post-hoc analyses for panel C used Dunn’s test, whereas panels D-G used Tukey’s HSD analyses (at least n=3/group). Data shown are mean±SEM. *, **, ***, **** represent P values <0.05, <0.01, <0.001, and <0.0001, respectively.
Fig. 6.
Fig. 6.. Hif-1α promotes Ptbp1 expression during hypoxia.
(A) Luciferase assays determined the relationship between Hif-1α, Ptbp1, and hnRNP A1. WT C57BL/6hepatocytes were transfected with constructs containing either WT or deletion mutations as shown, relative to the transcription start site (TSS), following H/R (n=6–12 biological replicates). Data analyzed by one-way ANOVA followed by Tukey’s HSD test. (B) Western blotting data for Ceacam1-S, Hif-1α and Vnc after RNA interference of Hif-1α and hypoxia/reoxygenation. Antibodies were directed to Hif-1α, Ceacam1 and Vnc. (C) Densitometer quantitation from panel B (n=3) analyzed by one-way ANOVA followed by Tukey’s HSD test. Vnc was used for normalization. (D) Anti-RNA polymerase II Ab and primers were used with GAPDH as a positive control for ChIP RT-PCR, establishing sensitivity and specificity conditions. Four ng ChIP DNA was used for downstream Ptbp1 studies. (E) ChIP of mouse Ptbp1 using antibody directed to Hif-1α. The region of the promoter targeted is notated above the panel. The apparent slower migration of DNA Ptbp1 for region −572 to −312 relative the input is attributed to mass of product loaded, as compared to normoxia samples. (F) Quantitation of parallel ChIP Ptbp1 panel E samples. Unpaired Student’s t-test of representative samples was performed for −900->−537 ±H (P=0.0002) and −900->−537 ±H (P=0.0002). (G) Summary of Hif-1α dependent interactions. Stable interactions were present before and after hypoxia, whereas hypoxia induced interactions occurred only after limited oxygen availability. Data shown are mean±SEM and represent at least three biological replicates. *, **, ***, **** represent P values <0.05, <0.01, <0.001, and <0.0001, respectively.
Fig. 7.
Fig. 7.. DMOG alleviates liver injury in mice and promotes Ceacam1 alternative splicing.
(A) Experimental scheme for wIRI and treatment. (B) Gross anatomical examination of Control (Cntl; no DMOG, +wIRI) vs. DMOG (+ treatment +wIRI). Black arrows indicate areas of liver damage or lack thereof. (C) sAST (P=0.057, unpaired Student’s t-test) and sALT concentrations in control and DMOG treated mice (n=5–6/group). (D) Representative images of H&E and TUNEL staining (brown) in liver tissue. Black arrows indicate dead cells. Original magnification, x20, scale 1/70). Scale bar shows 100μm. (E) Suzuki’s histological grading of liver IRI in Sham, control and DMOG treated mice (n=4–6/group). (F) Quantification of TUNEL-positive cells from panel D (n=6/HPF). (G) qRT-PCR analysis of Hif1A and Mcp1 mRNA expression after normalization to Actb. (n=3–8 per group). (H) Representative immunohistochemical staining of Ly6G (green) and nuclei (DAPI, blue) in liver tissue from control (Cntl) and DMOG treated mice. Arrows indicate extranuclear staining of Ly6G+ cells (original magnification, x20; scale bar shows 100 μm). (I) Quantification of infiltrating Ly6G-positive neutrophils/6HPF. (J) Western blots and (K) relative intensity ratios of PhD1, Hif-1α, and Ceacam1 expression in Sham, control and DMOG treated livers, (n=3–5/group). (L) RT-PCR to measure Ceacam1 splice variant mRNA expression in Sham, control and DMOG treated livers. (M) Relative intensity ratios to measure % Ceacam1-S in panel L. Panels C and I were analyzed by Mann-Whitney tests whereas panels E-F were analyzed by one-way ANOVA and Tukey’s HSD test. Panel G and K were analyzed by two-way ANOVA and Tukey’s HSD test. Panel M by Kruskal-Wallis test followed by post-hoc Dunn’s test. β-Act served as loading control. Data shown are mean±SEM. *, **, ***, **** represent P values <0.05, <0.01, <0.001, and <0.0001, respectively.
Fig. 8.
Fig. 8.. Hepatic CEACAM1-S mRNA expression associates with HIF1A mRNA in human OLT recipients before liver implantation.
(A) Forty-six human donor liver biopsies (Bx) were collected before (pre-OLT) and after transplantation (post-OLT). (B) Pre-transplant HIF1A vs. CEACAM1-S mRNA expression by Spearman r analyses. (C) Pre-transplant human liver Bx samples were divided into low (n=23; red) and high (n=23; blue) CEACAM1-S expression groups, after normalization to CEACAM1 total mRNA (S/S+L), P<0.0001. (D) High CEACAM1-S expression pre-transplant compared to pre-OLT HIF1A expression, P=0.0080. (E-H) Pre-transplant CEACAM1-S/HIF1A ratios were compared to post-OLT TIMP1, P=0.0012 (Mann-Whitney U test). (F) Total bilirubin on postoperative day 1 (POD)-POD7, relative CEACAM1:HIF1A by two-way ANOVA (P<0.0001, high vs. low CEACAM1/HIF-1α). (G) Incidence of delayed biliary anastomosis (Fisher’s exact test, P<0.0223), relative CEACAM1-S/HIF1A. (H) Correlation of CEACAM1-S/HIF1A ratios to MCP1, CXCL10, IL17A mRNA expression in post-transplant Bx (Spearman r). (I) Spearman r analyses for pre-transplant CEACAM1-S expression and MELD score.

Similar articles

Cited by

References

    1. Webster NJG, Alternative RNA Splicing in the Pathogenesis of Liver Disease. Front Endocrinol (Lausanne) 8, 133 (2017). - PMC - PubMed
    1. Han SP, Tang YH, Smith R, Functional diversity of the hnRNPs: past, present and perspectives. Biochem J 430, 379–392 (2010). - PubMed
    1. Geuens T, Bouhy D, Timmerman V, The hnRNP family: insights into their role in health and disease. Hum Genet 135, 851–867 (2016). - PMC - PubMed
    1. Yeo G, Holste D, Kreiman G, Burge CB, Variation in alternative splicing across human tissues. Genome Biol 5, R74 (2004). - PMC - PubMed
    1. Wong RJ, Singal AK, Trends in Liver Disease Etiology Among Adults Awaiting Liver Transplantation in the United States, 2014–2019. JAMA Netw Open 3, e1920294 (2020). - PubMed

Publication types

Substances