. 2023 Aug 2;15(707):eabj3138.
doi: 10.1126/scitranslmed.abj3138. Epub 2023 Aug 2.

Proregenerative extracellular matrix hydrogel mitigates pathological alterations of pelvic skeletal muscles after birth injury

Affiliations

Proregenerative extracellular matrix hydrogel mitigates pathological alterations of pelvic skeletal muscles after birth injury

Pamela Duran et al. Sci Transl Med. .

Abstract

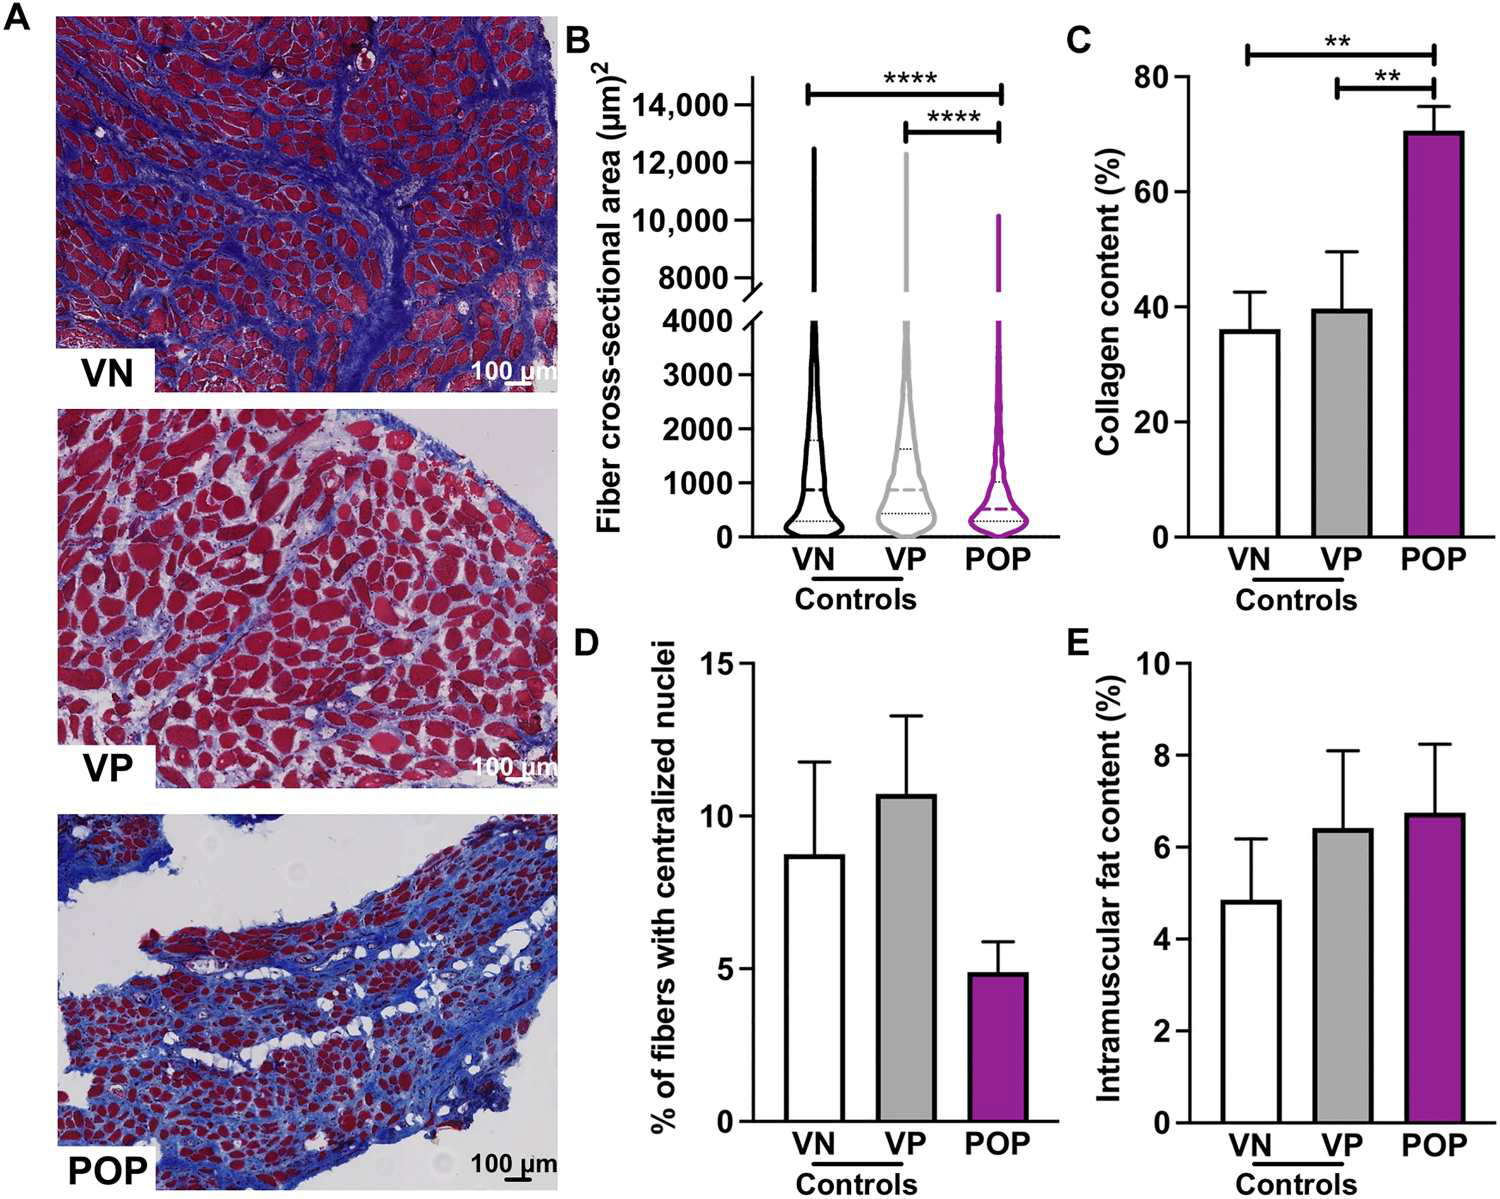
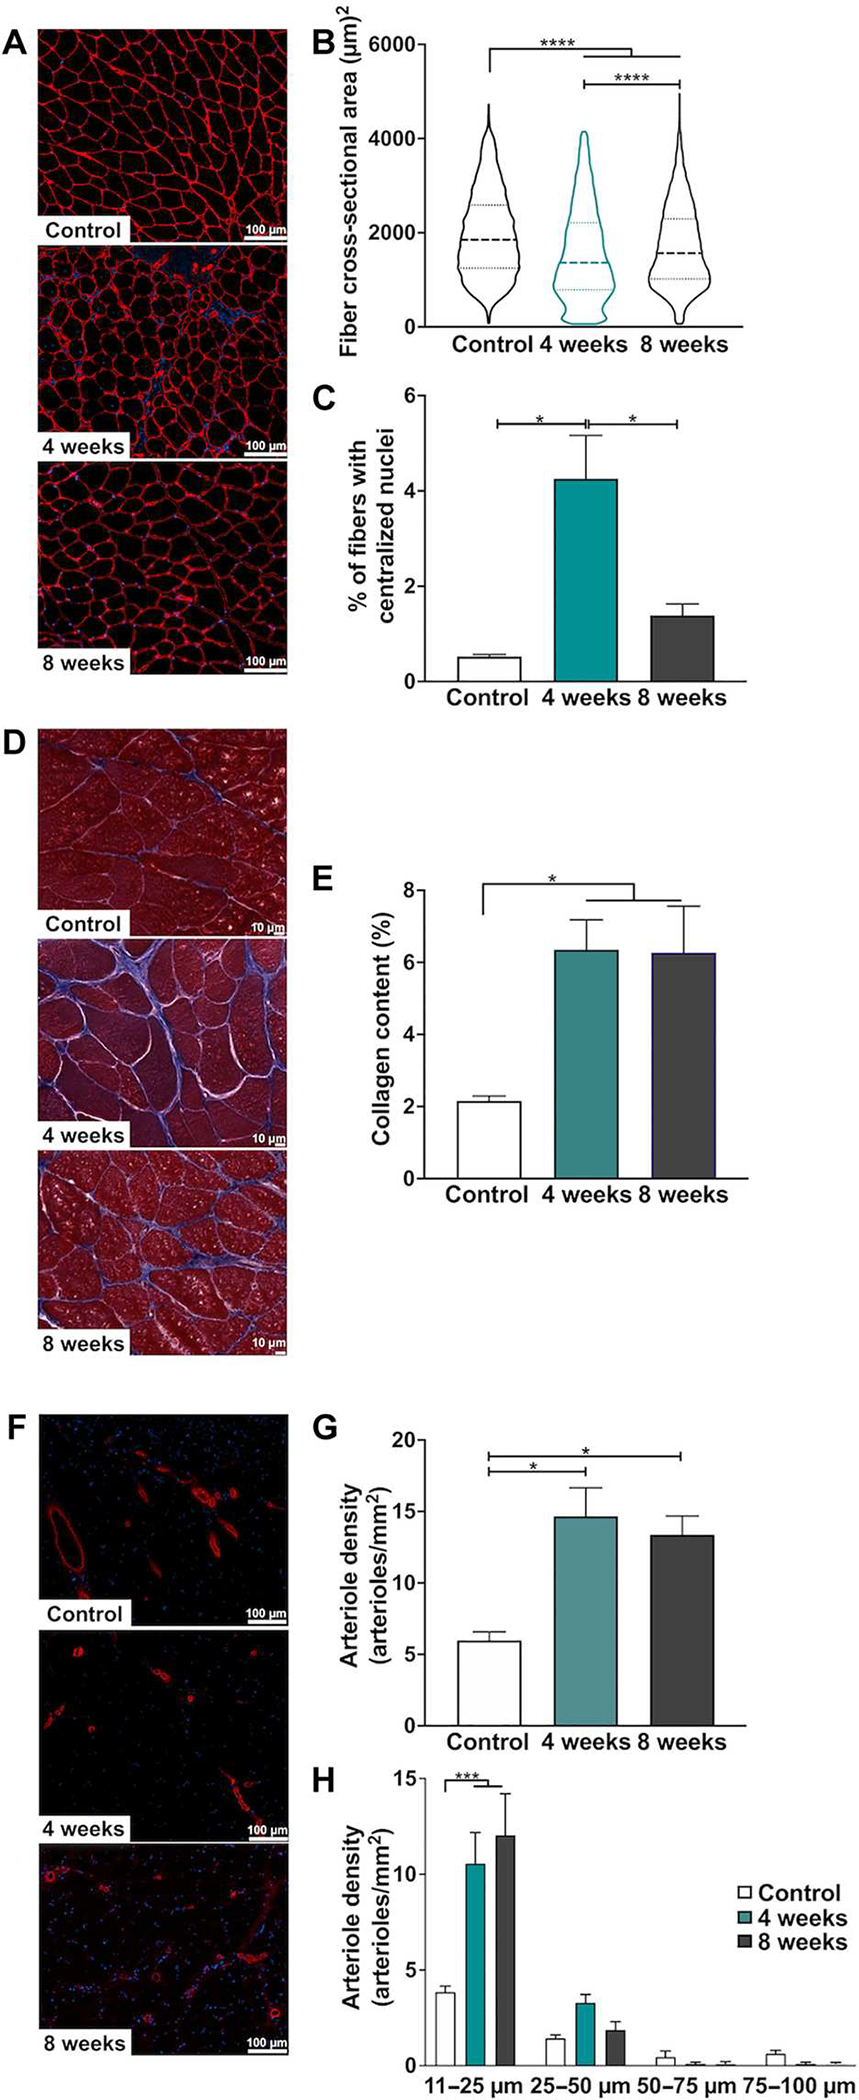
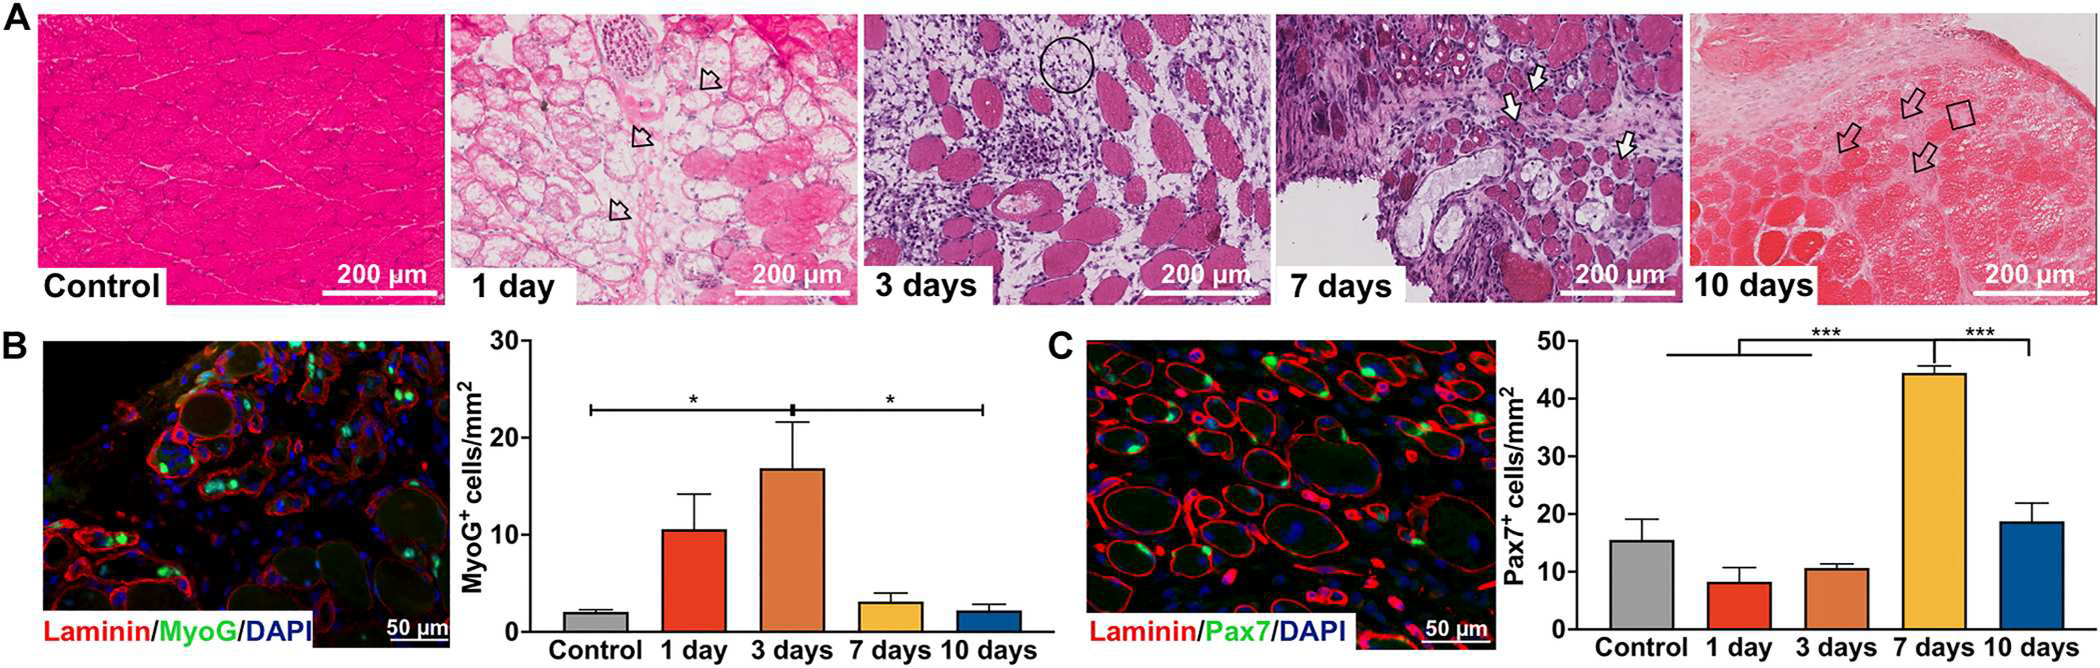
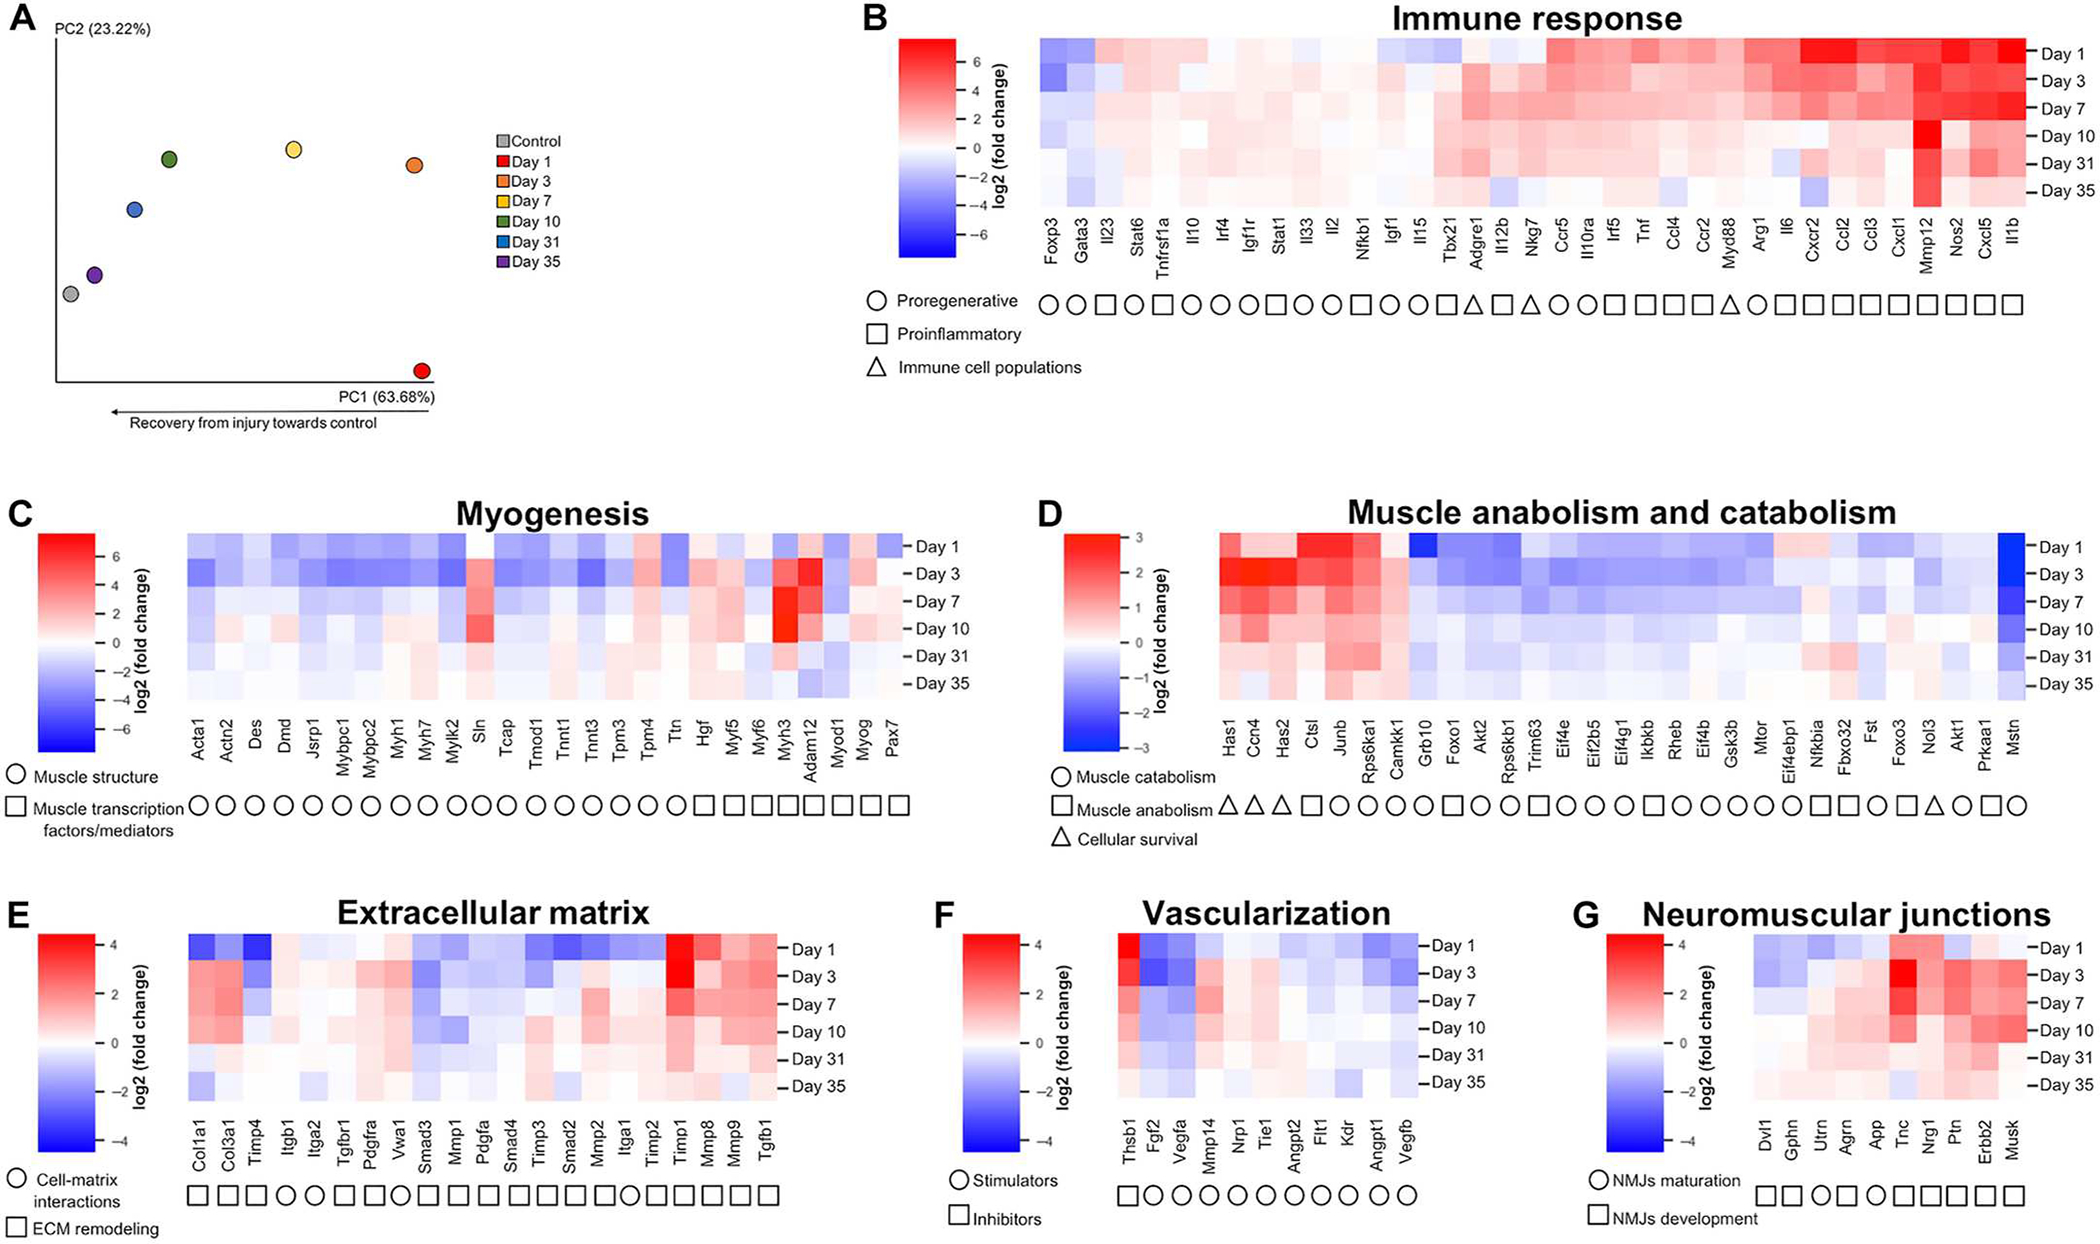
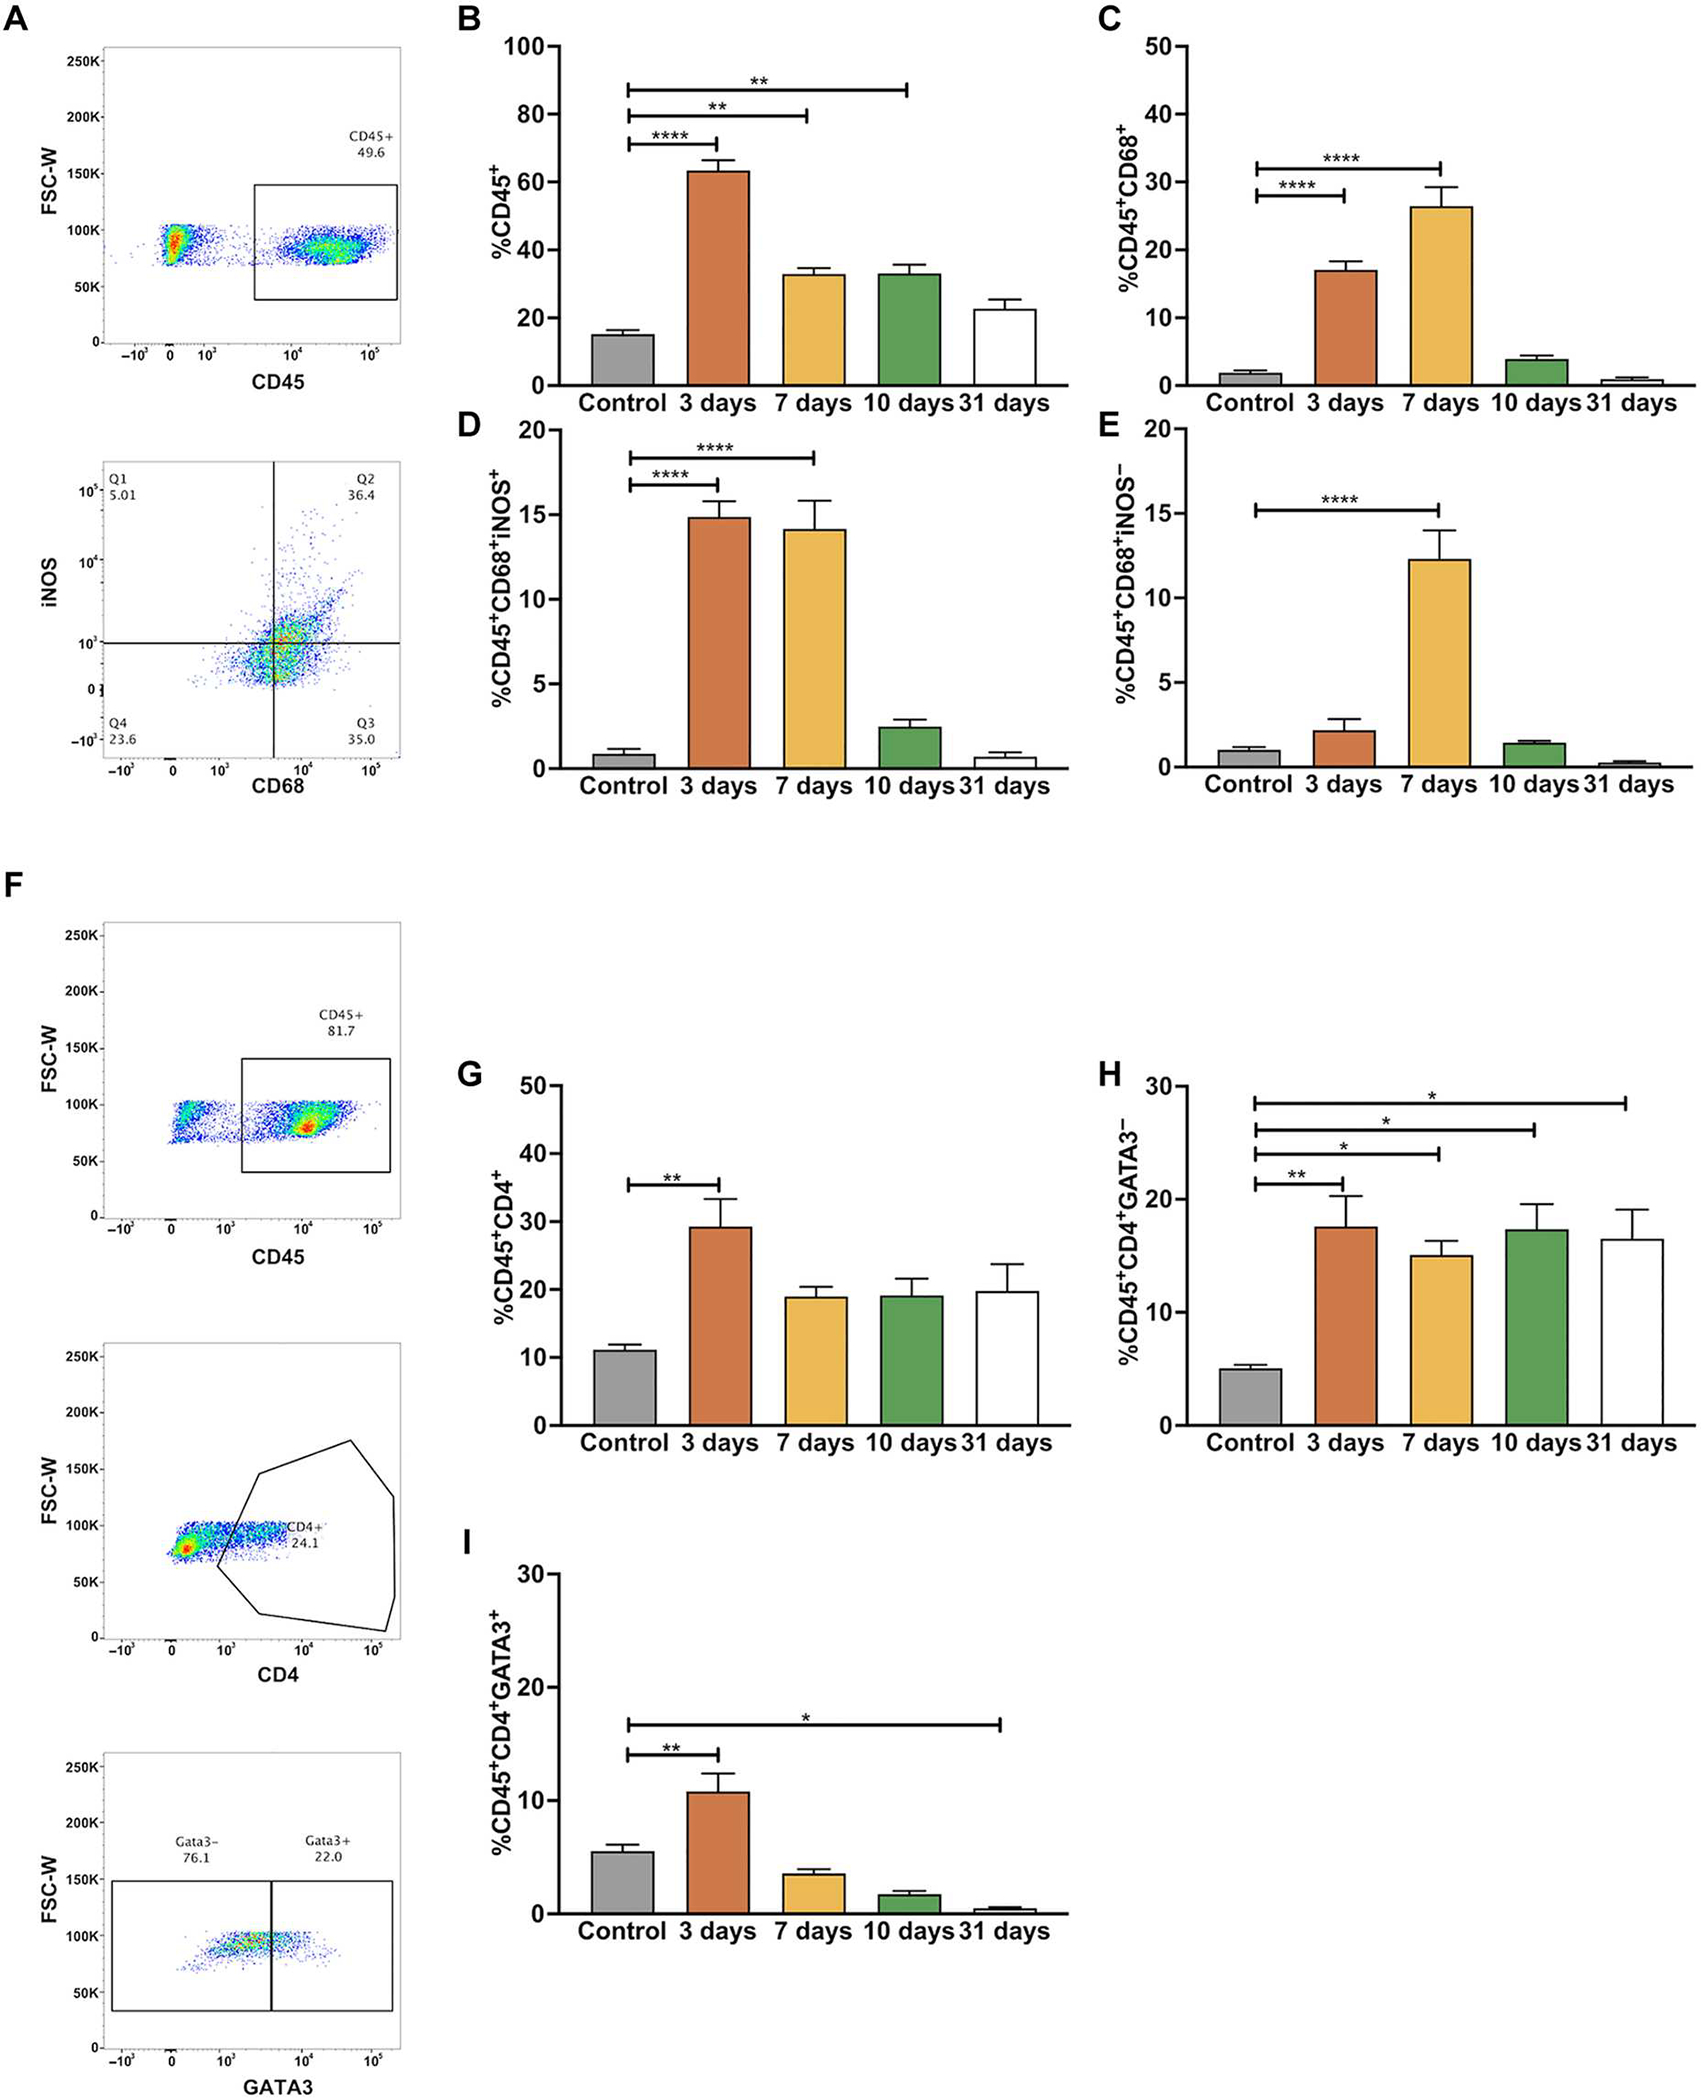
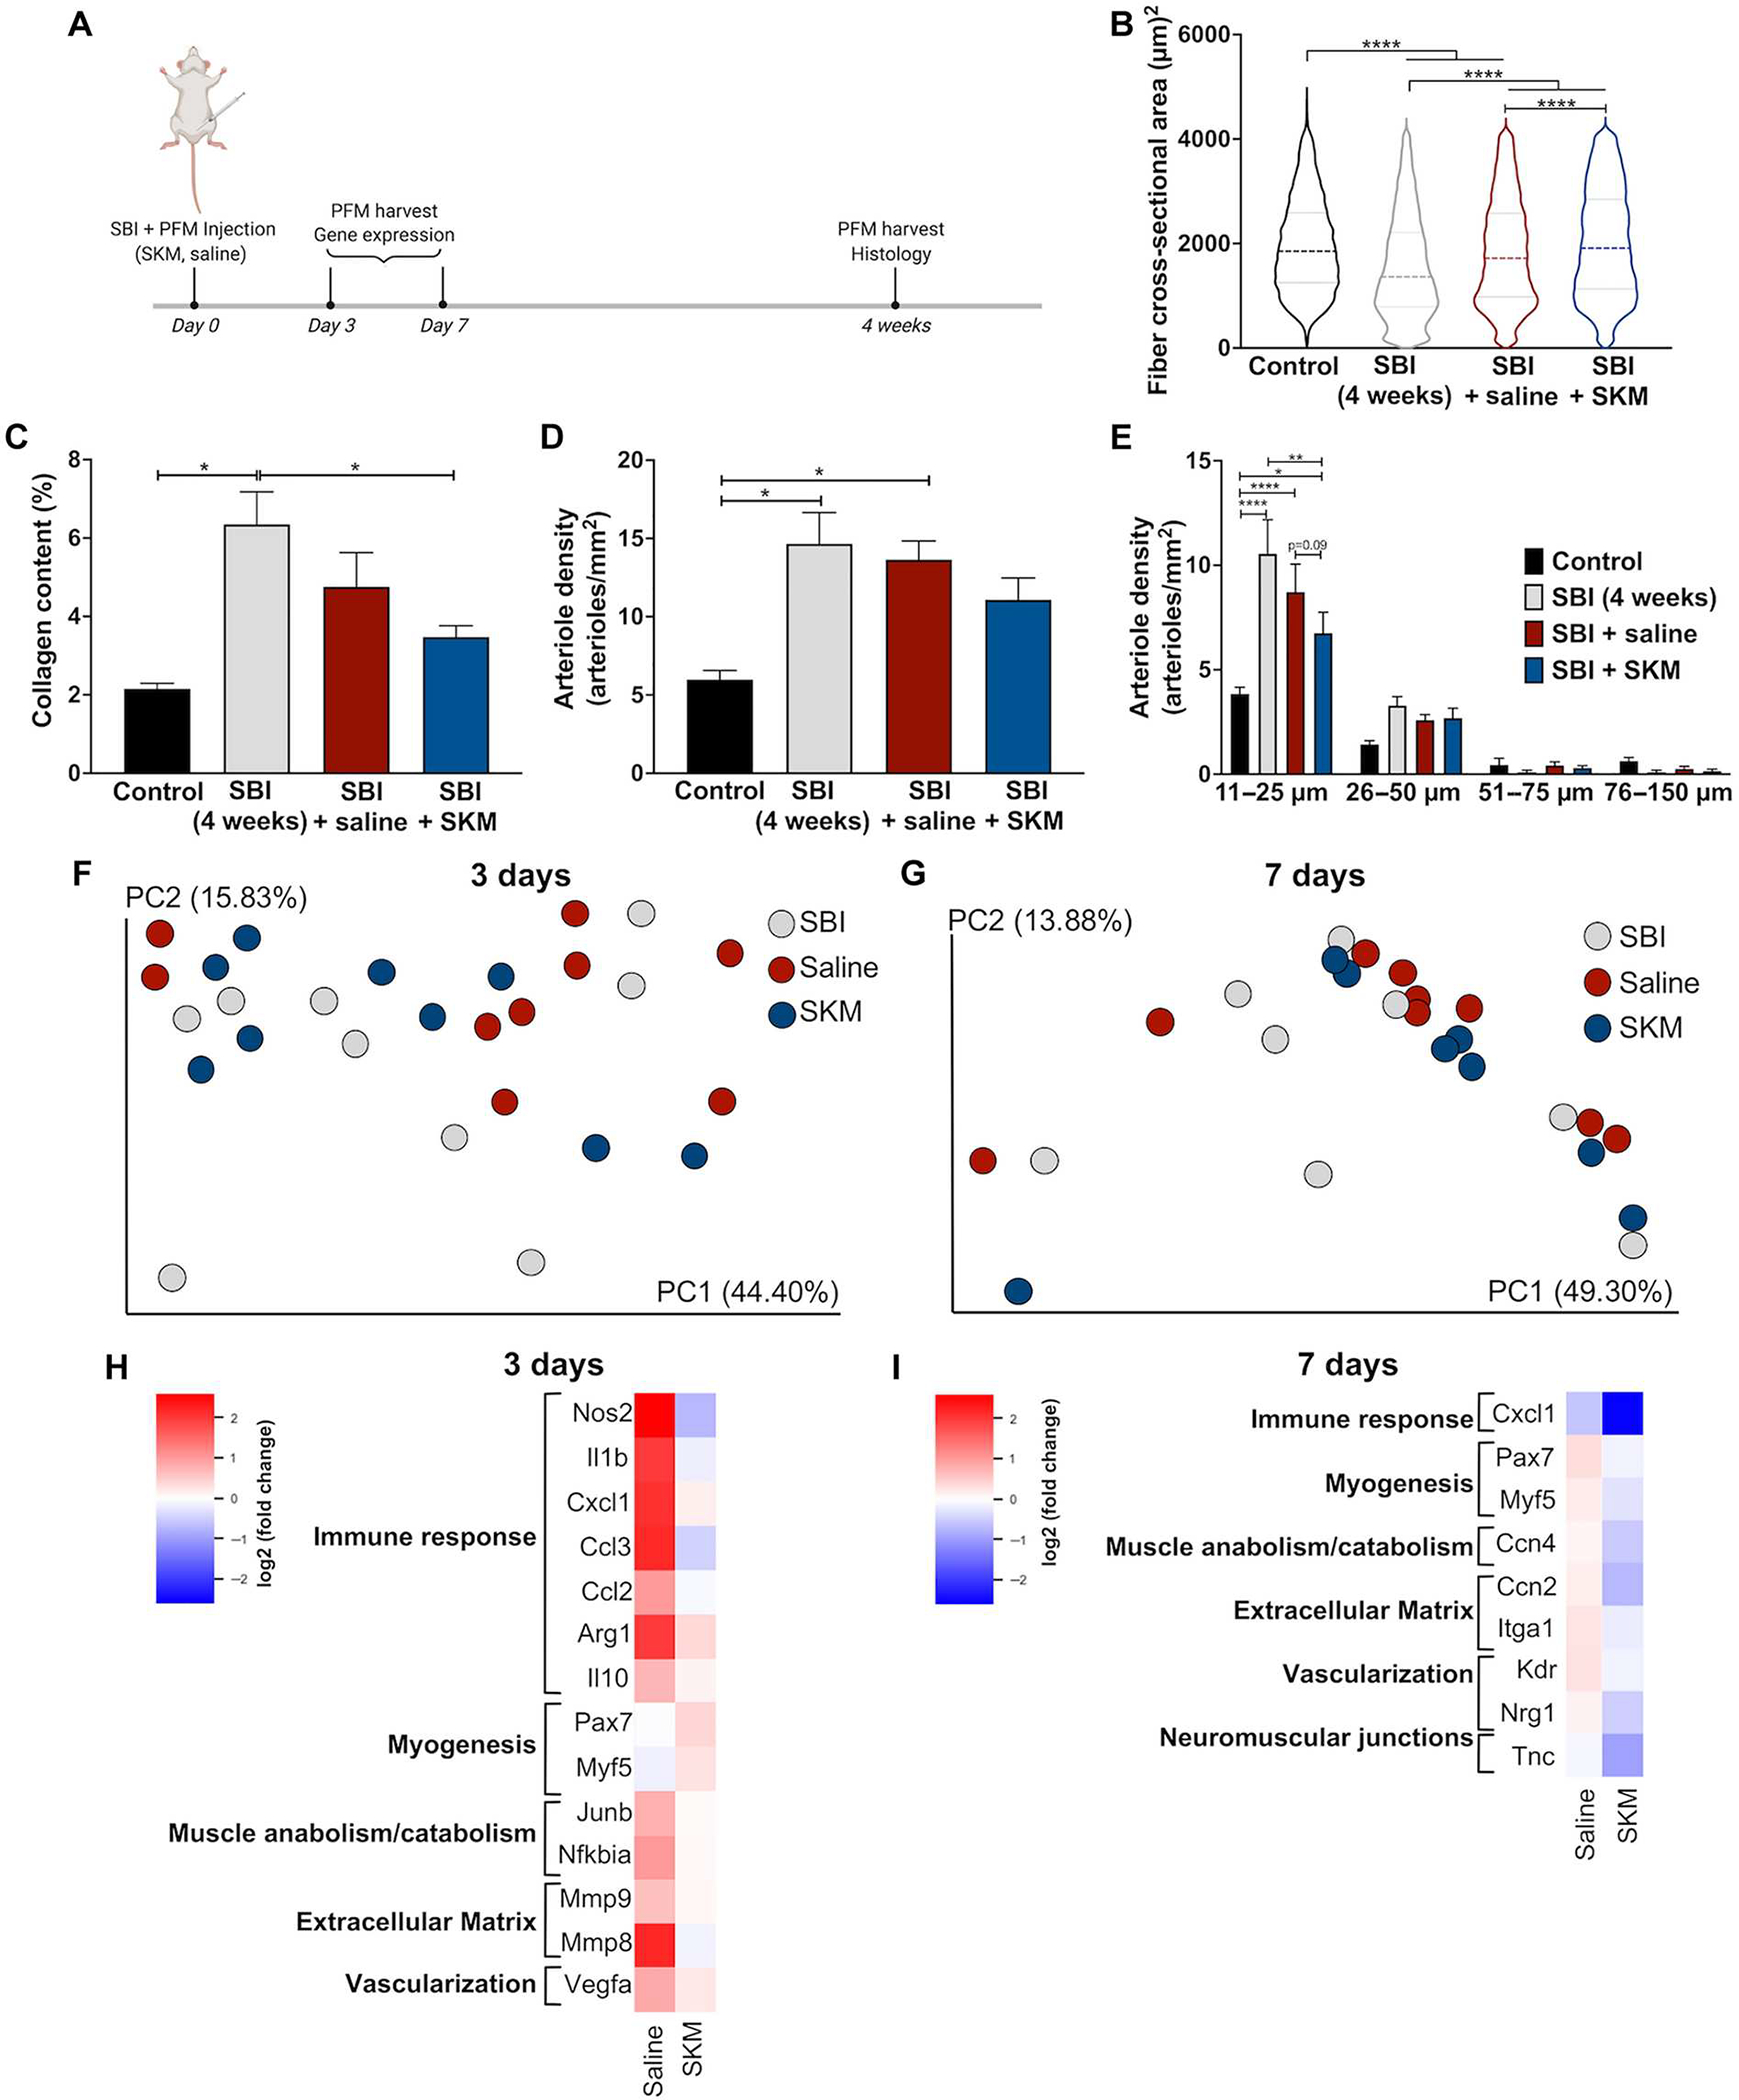
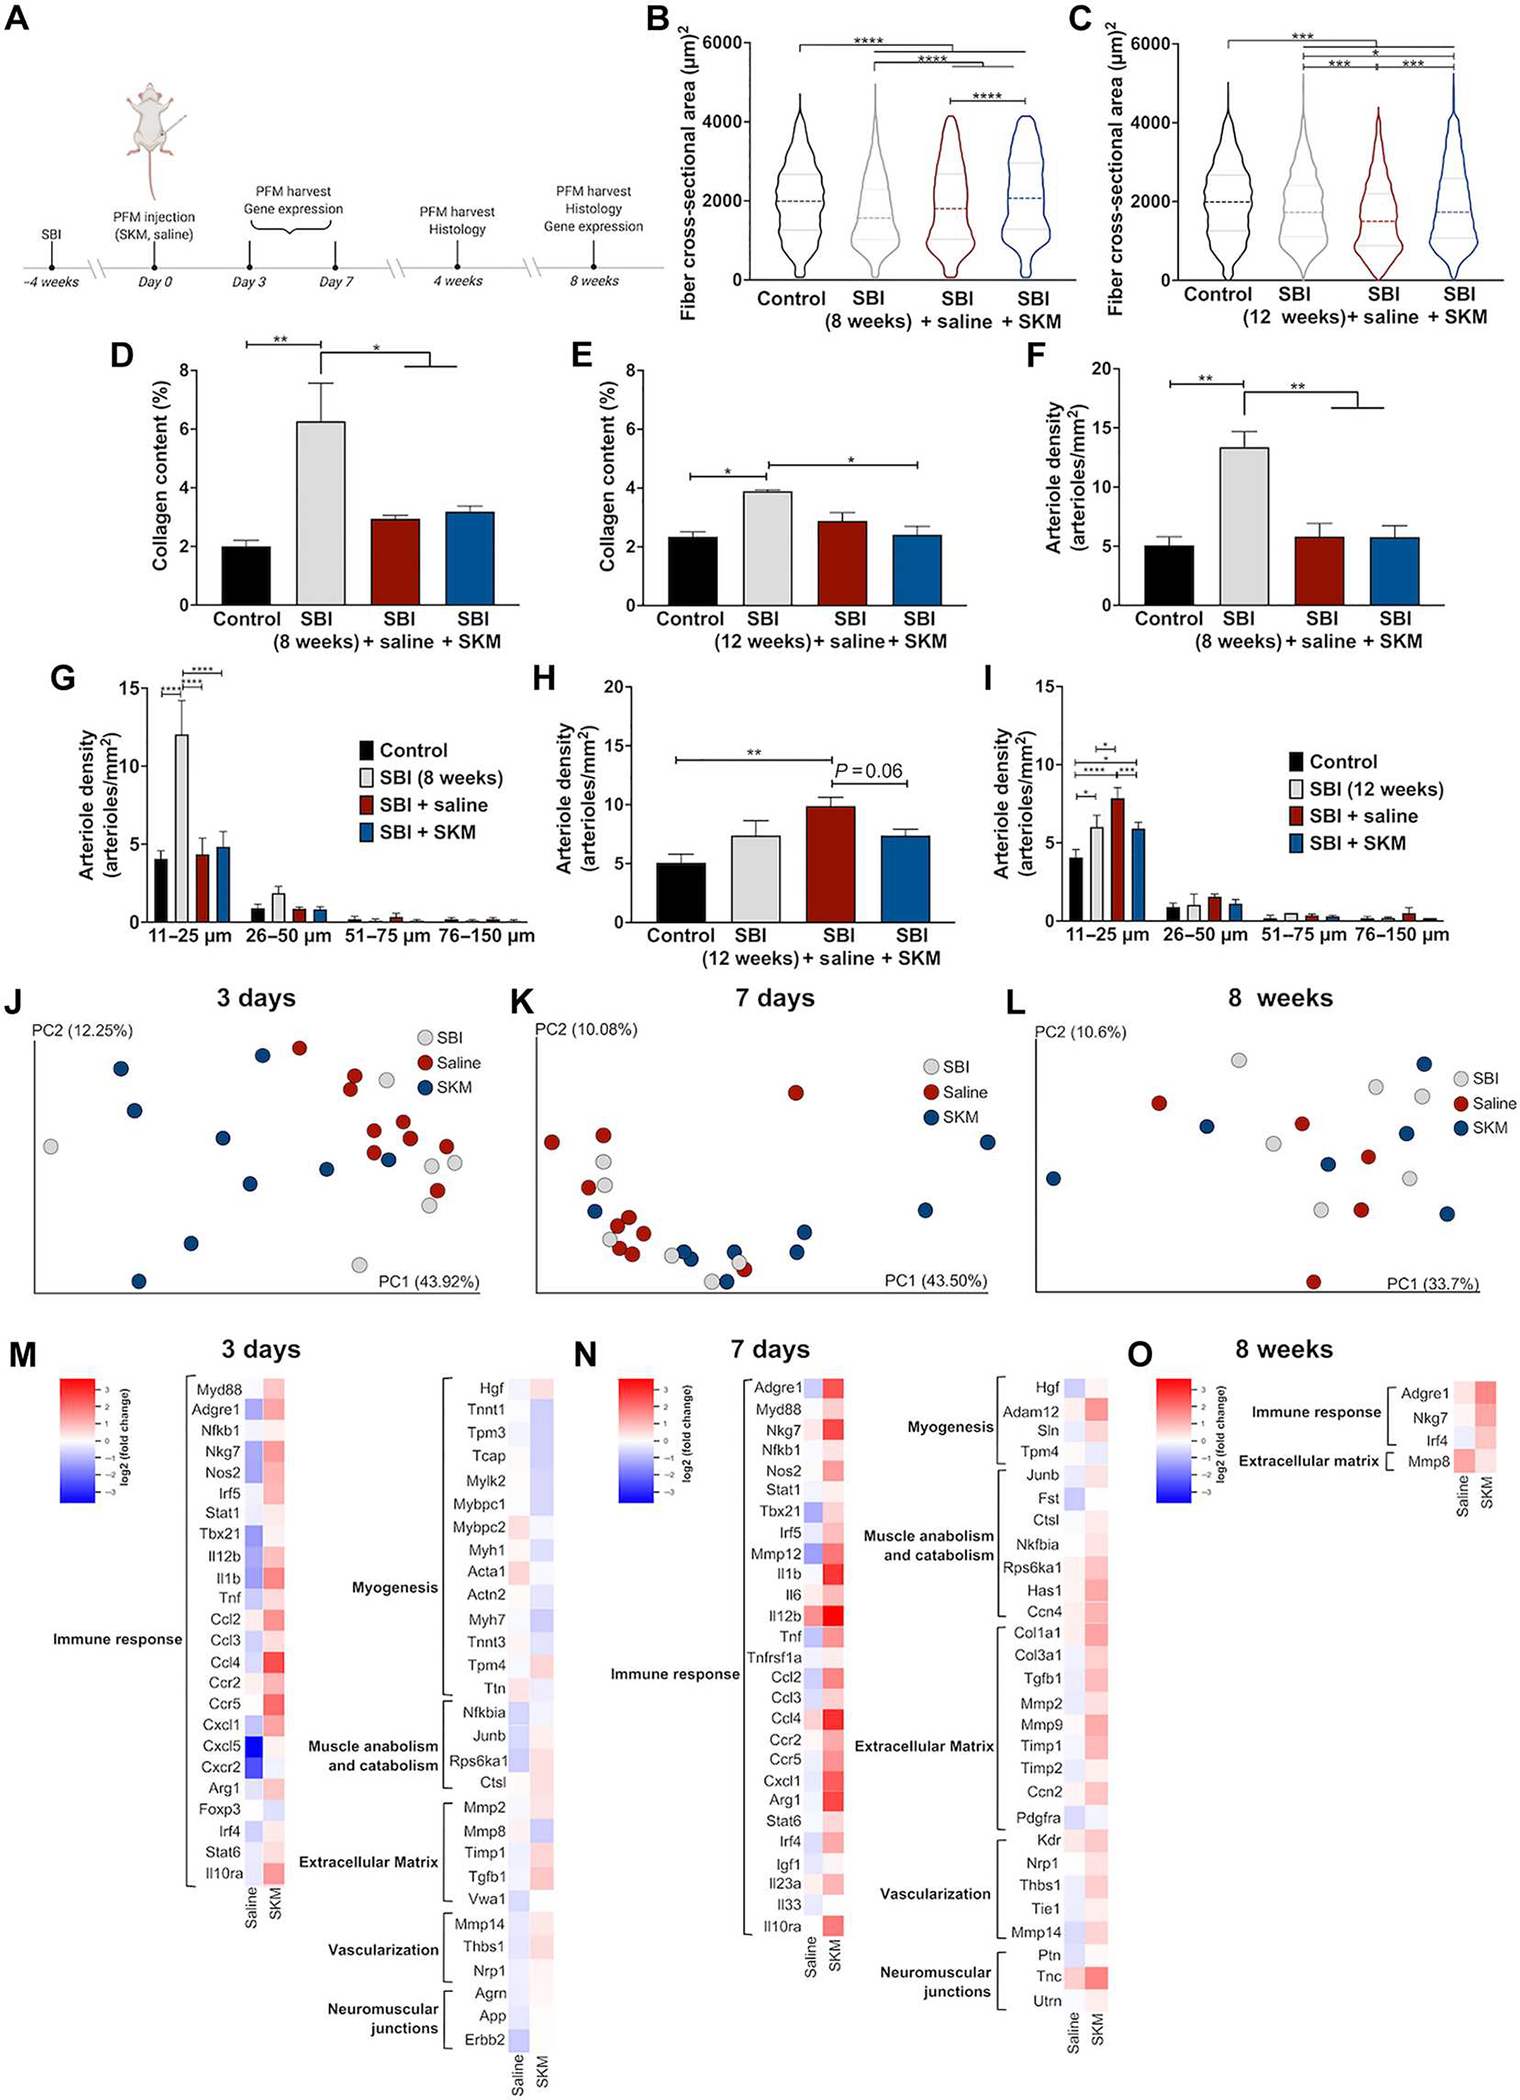
Pelvic floor disorders, including pelvic organ prolapse and urinary and fecal incontinence, affect millions of women globally and represent a major public health concern. Pelvic floor muscle (PFM) dysfunction has been identified as one of the leading risk factors for the development of these morbid conditions. Childbirth, specifically vaginal delivery, has been recognized as the most important potentially modifiable risk factor for PFM injury; however, the precise mechanisms of PFM dysfunction after parturition remain elusive. In this study, we demonstrated that PFMs exhibit atrophy and fibrosis in parous women with symptomatic pelvic organ prolapse. These pathological alterations were recapitulated in a preclinical rat model of simulated birth injury (SBI). The transcriptional signature of PFMs after injury demonstrated an impairment in muscle anabolism, persistent expression of genes that promote extracellular matrix (ECM) deposition, and a sustained inflammatory response. We also evaluated the administration of acellular injectable skeletal muscle ECM hydrogel for the prevention of these pathological alterations. Treatment of PFMs with the ECM hydrogel either at the time of birth injury or 4 weeks after injury mitigated PFM atrophy and fibrosis. By evaluating gene expression, we demonstrated that these changes are mainly driven by the hydrogel-induced enhancement of endogenous myogenesis, ECM remodeling, and modulation of the immune response. This work furthers our understanding of PFM birth injury and demonstrates proof of concept for future investigations of proregenerative biomaterial approaches for the treatment of injured pelvic soft tissues.


Conflict of interest statement

Competing interests: K.L.C. is cofounder, consultant, and board member of and holds equity interest in Ventrix Bio Inc. and Karios Technologies Inc. and is a consultant for Coloplast. M.A. and K.L.C. receive editorial stipends from American Journal of Obstetrics and Gynecology and npj Regenerative Medicine, respectively. K.L.C., M.A., and P.D. are inventors on a patent (US11376346B2, Extracellular Matrix for Treating Pelvic Floor Disorders and Skeletal Muscle Degeneration) related to this work. F.B.S., L.B., M.C., G.Z.-D., S.A.M., E.D., S.F., M.M.S., C.S., and M.S. declare that they have no competing interests.

Figures

Fig. 1.
Fig. 1.. PFMs in women with symptomatic pelvic floor disorders demonstrate an atrophic and fibrotic phenotype.
(A) Gomori’strichrome–stained (blue, intramuscular collagen content; red, muscle fibers) biopsy crosssections of the pubovisceralis portion of the levator ani muscle procured from VN and VP cadaveric donors without history of pelvic floor disorders and from parous women with POP. (B) Violin plots of fiber cross-sectional area. Shape of the plots demonstrates the distribution of the myofibers of varioussizes with a median indicated by the dash line. (C) Collagen content. (D) Centralized nuclei quantification. (E) Intramuscular fat content. n = 4 (VN); n = 7 (VP); n = 20 (POP) biological replicates. P values derived from one-way ANOVA followed by pairwise comparisons with Tukey’s range test for parametric and Kruskal-Wallis followed by pairwise comparisons with Dunn’s test for nonparametric data. **P < 0.01 and ****P < 0.0001; mean ± SEM, median (interquartile range); scale bars, 100 μm.
Fig. 2.
Fig. 2.. Rat model of SBI recapitulating atrophic and fibrotic PFM phenotype observed in parous women with symptomatic PFDs.
(A) Laminin (red)– and nuclei (blue)–stained cross sections of the pubocaudalis portion of the levator ani muscle in uninjured controls, and 4 and 8 weeks after SBI groups, used for fiber cross-sectional area (B) and centralized nuclei (C) quantification; scale bars, 100 μm. (D) Masson’s trichrome staining of pubocaudalis used for intramuscular collagen quantification (blue) (E); scale bars, 10 μm. (F) α–smooth muscle actin staining (red, arterioles; blue, nuclei) of the pubocaudalis, used for quantification of the total vessel (arteriole) density (G) and distribution of vessels by size (H); scale bars, 100 μm. n = 3 to 6 per group biological replicates. P values derived from one- or two-way ANOVA followed by pairwise comparisons with Tukey’s or Šidák range test, respectively, for parametric data and Kruskal-Wallis followed by pairwise comparisons with Dunn’s test for nonparametrically distributed data. *P < 0.05, ***P < 0.001, and ****P < 0.0001; mean ± SEM, median (interquartile range).
Fig. 3.
Fig. 3.. Myogenesis of the pelvic floor muscles takes place within 1 week after SBI.
(A) H&E staining of pubocaudalis cross sections along a 10-day continuum after SBI; scale bars, 200 μm (basal lamina, arrowheads; cellular infiltration, circle and unfilled arrows; centralized nuclei, white arrows; endomysium, square). Muscle cross sections were incubated with antimyogenin antibodies for in situ quantification of differentiated MuSCs and assessment of muscle stem pool, respectively; laminin (red), DAPI (blue); scale bars, 50 μm. n = 2 or 3 per group biological replicates. P values derived from one-way ANOVA followed by pairwise comparisons with Tukey’s range test. *P < 0.05 and ***P < 0.001; mean ± SEM.
Fig. 4.
Fig. 4.. SBI leads to sustained inflammatory response, up-regulation of ECM remodeling genes, and down-regulation of genes involved in muscle anabolism.
(A) Transcriptional signatures of the PFMs of the rat across different pathways were derived from the customized Nanostring nCounter panel with 150 genes. Principal components (PC) analysis includes gene expression in uninjured controls and at multiple time points during active muscle regeneration after SBI. (B to G) Unsupervised clustered heatmaps of fold changes at each time point with respect to control. Pathways examined include immune response (B), myogenesis (C), muscle anabolism and catabolism (D), extracellular matrix (E), vascularization (F), and neuromuscular junctions (G). n = 3 to 6 per group biological replicates. Gene expression analysis was analyzed on the basis of NanoStringDiff package in R.
Fig. 5.
Fig. 5.. Immune cellular dynamics indicate an increase of macrophages within a week after SBI with long-term increase of a CD45+CD4+GATA3 subpopulation of T helper cells.
(A) Representative plots for macrophage populations showing percentage of CD45+, CD45+CD68iNOS+ (Q1), CD45+CD68+iNOS+ (Q2), CD45+CD68+ iNOS (Q3), and CD45+CD68iNOS (Q4) cells. Percentage of CD45+ (B), CD45+CD68+ (C), CD45+CD68+iNOS+ (D), and CD45+CD68+iNOS (E) cells. (F) Representative plots of T helper cellular populations showing expression of CD45+, CD45+CD4+, CD45+CD4+GATA3, and CD45+CD4+GATA3+ cells. Percentage of CD45+CD4+ (G), CD45+ CD4+GATA3 (H), and CD45+CD4+GATA3+ (I) cells. n = 3 to 6 per group biological replicates. P values derived from one-way ANOVA followed by pairwise comparisons with Dunnett’s range test. *P < 0.05, **P < 0.01, and ****P < 0.0001; mean ± SEM.
Fig. 6.
Fig. 6.. Injection of SKM at the time of SBI prevents PFM atrophy and mitigates fibrosis.
(A) Study timeline. Pubocaudalis muscles of uninjured controls and animals subjected to SBI, SBI + saline injection, or SBI + SKM injection were compared with respect to fiber cross-sectional area (B); collagen content (C); overall vessel (arteriole) density (D); and vessel (arteriole) density separated by size (E). PC analysis of transcriptional signatures at 3 (F) and 7 (G) days after SBI with and without injection. Supervised heatmap of fold changes for SKM and saline with respect to untreated SBI at 3 (H) and 7 (I) days. n = 6 per group for histological assessments and 8 or 9 per group for gene expression analyses. P values derived from one- or two-way ANOVA followed by pairwise comparisons with Tukey’s or Šidák range test for parametric data, respectively, and Kruskal-Wallis followed by pairwise comparisons with Dunn’s test for nonparametrically distributed data. Gene expression analysis was analyzed on the basis of NanoStringDiff package in R. *P < 0.05, **P < 0.01, and ****P < 0.0001; mean ± SEM, median (interquartile range).
Fig. 7.
Fig. 7.. Delayed injection of SKM prevents PFM atrophy and mitigates fibrosis.
(A) Study timeline. Pubocaudalis muscles of uninjured controls and animals subjected to SBI, SBI + saline injection, or SBI + SKM injection were compared with respect to fiber cross-sectional area at 4 weeks (B) or 8 weeks (C) after injection; collagen content (D and E); overall vessel density and vessel density separated by size at 4 weeks (F and G) and 8 weeks (H and I) after injection. PC analysis of transcriptional signatures at 3 (J) and 7 (K) days and 8 weeks (L) after injection (31 and 35 days and 12 weeks after SBI) with and without injection. Supervised heatmap of fold changes for SKM and saline with respect to untreated SBI at 3 (M), 7 (N) days, and 8 weeks (O) after injection. n = 6 per group for histological assessments and 6 to 10 per group for gene expression analyses (both biological replicates). P values derived from one- or two-way ANOVA followed by pairwise comparisons with Tukey’s or Šidák range test, respectively, for parametric data and Kruskal-Wallis followed by pairwise comparisons with Dunn’s test for nonparametrically distributed data. Gene expression analysis was analyzed on the basis of NanoStringDiff package in R. *P < 0.05, **P < 0.01, ***P < 0.001, and ****P < 0.0001; mean ± SEM, median (interquartile range).

Similar articles

Cited by

References

    1. Shen L, Yang J, Bai X, Sun Z, Analysis of the current status of pelvic floor dysfunction in urban women in Xi’an City. Ann. Palliat. Med. 9, 979–984 (2020). - PubMed
    1. Wu JM, Vaughan CP, Goode PS, Redden DT, Burgio KL, Richter HE, Markland AD, Prevalence and trends of symptomatic pelvic floor disorders in U.S. women. Obstet. Gynecol. 123, 141–148 (2014). - PMC - PubMed
    1. Zeleke BM, Bell RJ, Billah B, Davis SR, Symptomatic pelvic floor disorders in community-dwelling older Australian women. Maturitas 85, 34–41 (2016). - PubMed
    1. Hasuda T, Ueda A, Wei C-N, Prevalence of symptomatic pelvic floor disorders among Japanese women. J. Women’s Health Care 6, 4 (2017).
    1. Blomquist JL, Carroll M, Munoz A, Handa VL, Pelvic floor muscle strength and the incidence of pelvic floor disorders after vaginal and cesarean delivery. Am. J. Obstet. Gynecol. 222, 62.e1–62.e8 (2020). - PubMed

Publication types