. 2023 Aug 2;15(707):eadf7006.
doi: 10.1126/scitranslmed.adf7006. Epub 2023 Aug 2.

Exportin 1 inhibition prevents neuroendocrine transformation through SOX2 down-regulation in lung and prostate cancers

Affiliations

Exportin 1 inhibition prevents neuroendocrine transformation through SOX2 down-regulation in lung and prostate cancers

Alvaro Quintanal-Villalonga et al. Sci Transl Med. .

Abstract

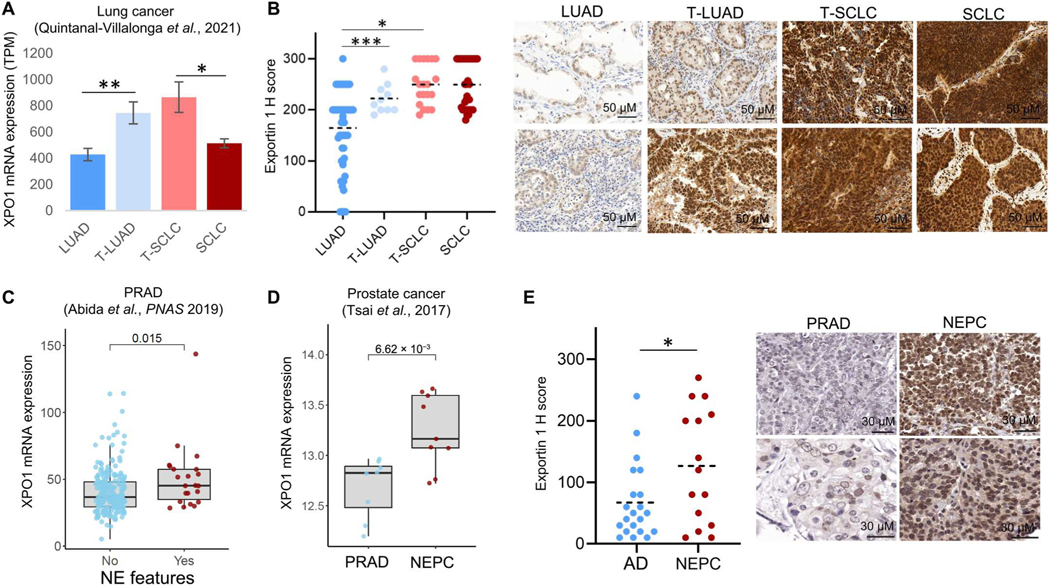
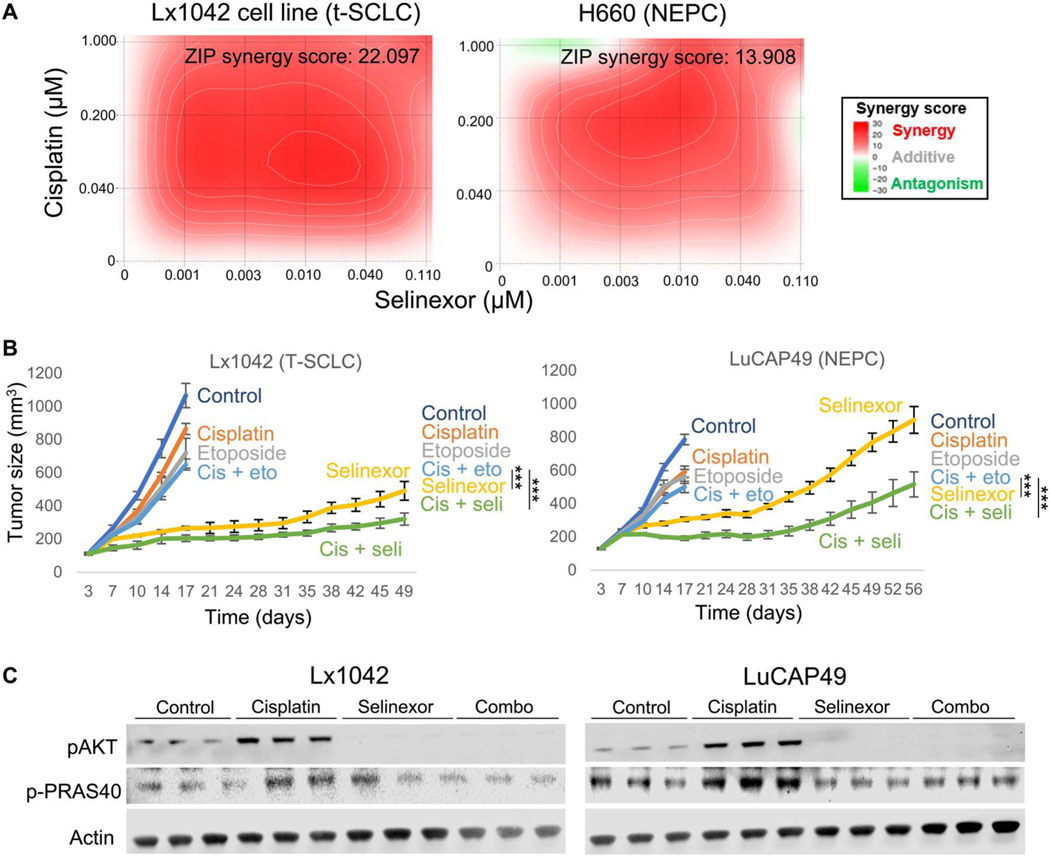
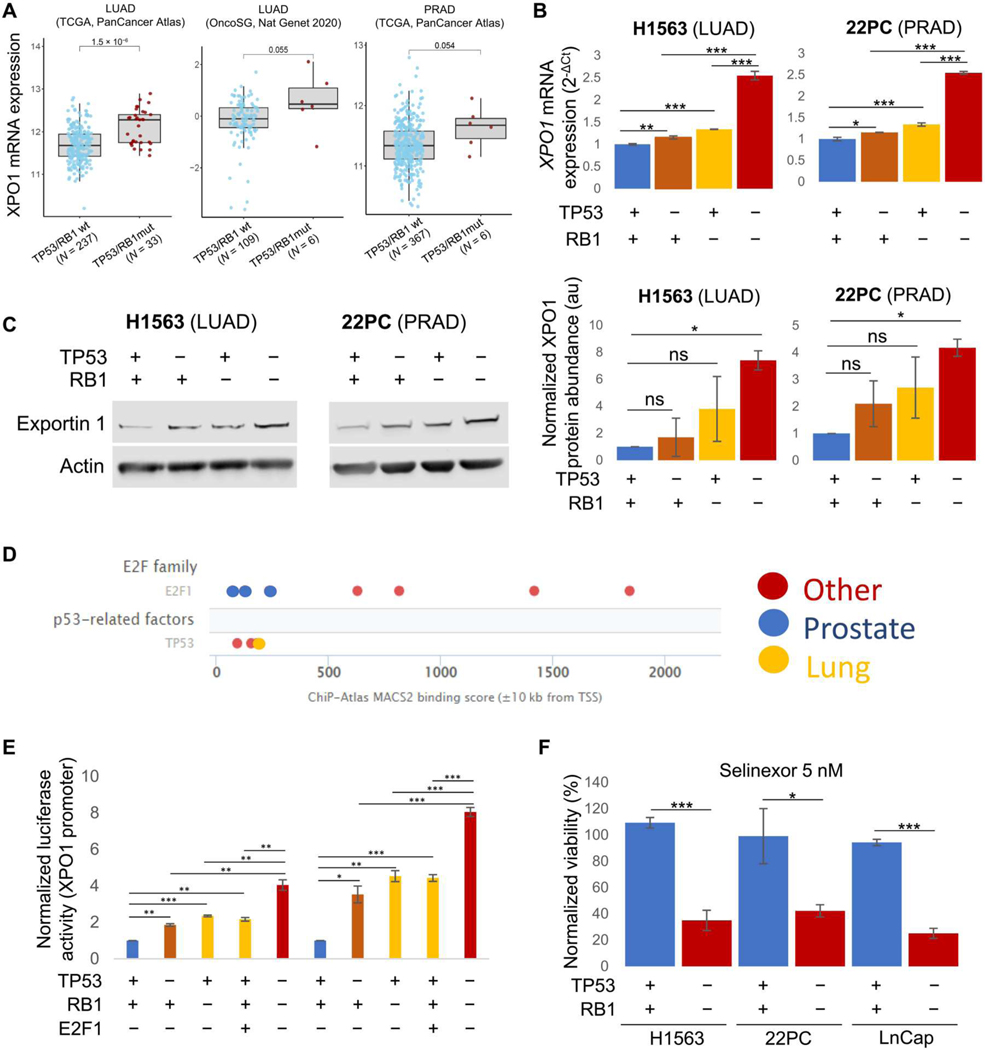
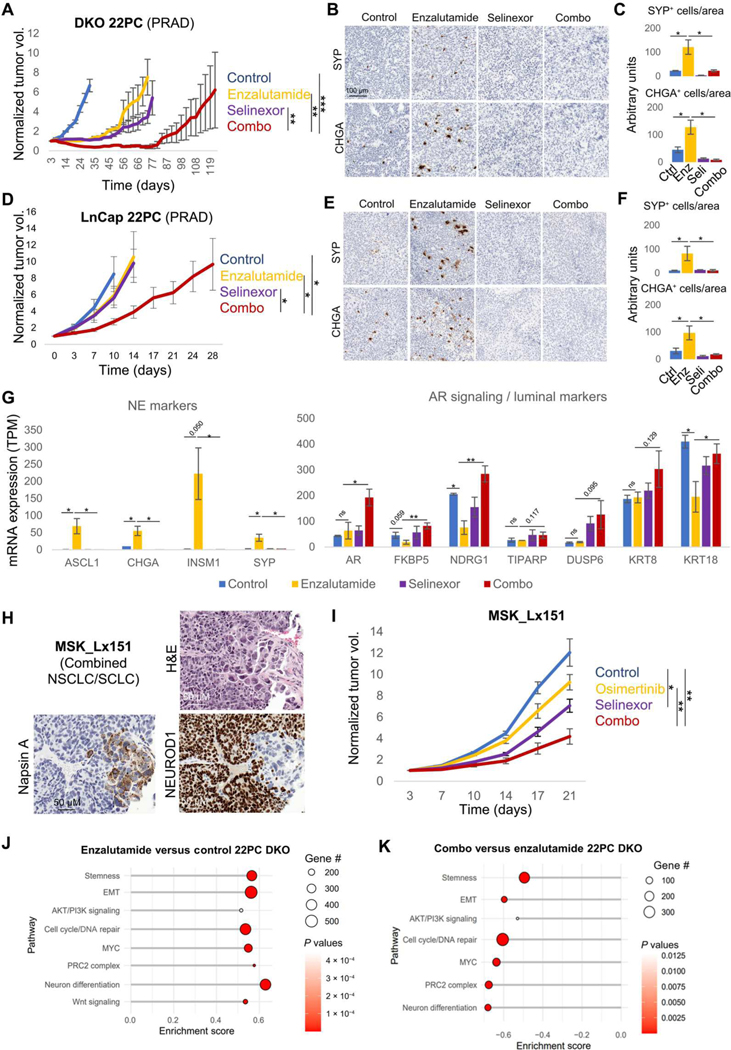
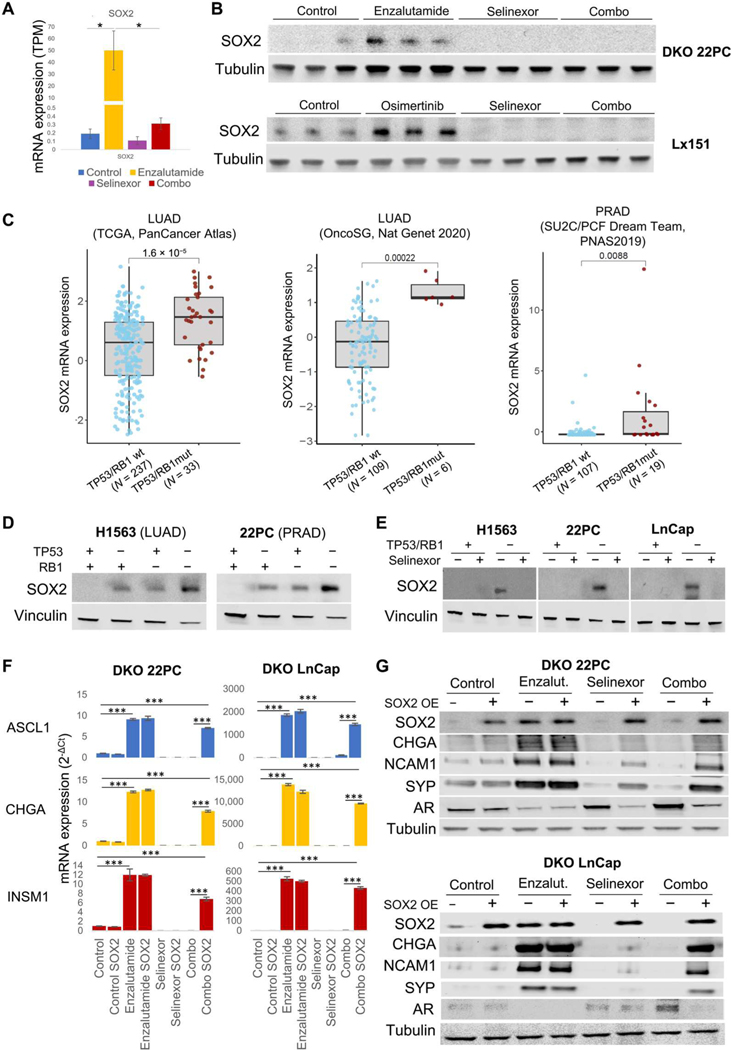
In lung and prostate adenocarcinomas, neuroendocrine (NE) transformation to an aggressive derivative resembling small cell lung cancer (SCLC) is associated with poor prognosis. We previously described dependency of SCLC on the nuclear transporter exportin 1. Here, we explored the role of exportin 1 in NE transformation. We observed up-regulated exportin 1 in lung and prostate pretransformation adenocarcinomas. Exportin 1 was up-regulated after genetic inactivation of TP53 and RB1 in lung and prostate adenocarcinoma cell lines, accompanied by increased sensitivity to the exportin 1 inhibitor selinexor in vitro. Exportin 1 inhibition prevented NE transformation in different TP53/RB1-inactivated prostate adenocarcinoma xenograft models that acquire NE features upon treatment with the aromatase inhibitor enzalutamide and extended response to the EGFR inhibitor osimertinib in a lung cancer transformation patient-derived xenograft (PDX) model exhibiting combined adenocarcinoma/SCLC histology. Ectopic SOX2 expression restored the enzalutamide-promoted NE phenotype on adenocarcinoma-to-NE transformation xenograft models despite selinexor treatment. Selinexor sensitized NE-transformed lung and prostate small cell carcinoma PDXs to standard cytotoxics. Together, these data nominate exportin 1 inhibition as a potential therapeutic target to constrain lineage plasticity and prevent or treat NE transformation in lung and prostate adenocarcinoma.


Figures

Fig. 1.
Fig. 1.. Exportin 1 is up-regulated during NE transformation in lung and prostate tumors.
Exportin 1 mRNA expression (4) (A) and protein (B) abundance in lung cancer clinical specimens, categorized as control never-transformed adenocarcinomas (LUAD, RNA n = 11, protein n = 46), transforming adenocarcinomas (T-LUAD, RNA n = 11, protein n = 10), small cell carcinomas (T-SCLC, RNA n = 11, protein n = 20), and control de novo small cell carcinomas (SCLC, RNA n = 16, protein n = 32). For (B), H-score medians and SDs (right) and representative immunohistochemistry (IHC) images (left) are shown. (C) Exportin 1 mRNA expression in prostate adenocarcinoma (PRAD) tumors with (n = 22) or without (n = 210) NE features [data from Abida et al. (16)]. (D) Exportin 1 mRNA expression in PRADs (n = 8) and small cell NE prostate cancer (NEPC) (n = 9) [data from Tzelepi et al. (15)]. (E) Exportin 1 protein expression in PRAD (n = 21) and NEPC (n = 15) clinical specimens, as assessed by IHC. H-score medians and SD (right) and representative images (left) are shown. *P < 0.05, **P < 0.01, and ***P < 0.001. TPM, transcripts per million.
Fig. 2.
Fig. 2.. Exportin 1 inhibition sensitizes NE-transformed lung and prostate cancers to chemotherapy.
(A) In vitro synergy assays in Lx1042 (T-SCLC, left) and H660 (NEPC, right) cell lines of the combination of selinexor and cisplatin with average synergy score displayed, as assessed by zero interaction potency (ZIP) and calculated using SynergyFinder. A representative plot is shown. (B) In vivo treatments of Lx1042 (T-SCLC) and LuCAP49 (NEPC) PDXs to compare the efficacy of the combination of cisplatin and selinexor versus that of cisplatin and etoposide. Four to eight female 6-week-old NOD.Cg-Prkdc<scid> Il2rg<tm1Wjl>/SzJ (NSG) mice (PDXs) were subcutaneously engrafted per treatment arm and were grown until tumors reached 100 to 150 mm3. At that point, mice were randomized into groups and treated with either vehicle (n = 8), cisplatin (2 mg/kg, i.p., once per week, n = 4 for Lx1042 and n = 5 for LuCAP49), etoposide (3 mg/kg, i.p., QDx3, n = 4 for Lx1042 and n = 5 for LuCAP49), selinexor (10 mg/kg, p.o., QDx3, n = 4 for Lx1042 and n = 5 for LuCAP49), or the combinations of cisplatin + etoposide (n = 8) or cisplatin + selinexor (n = 8). Mice weights and tumor volumes were measured twice a week, and mice were euthanized when tumors reached a humane end point (volume, 1000 mm3). P values were calculated using the Student’s t test (unpaired, heterogeneous variances, and two-tailed). (C) Representative Western blot images showing activation of the AKT/mTOR pathway in tumors derived from (B). ***P < 0.001.
Fig. 3.
Fig. 3.. Loss of TP53/RB1 function induces exportin 1 expression and sensitivity to selinexor.
(A) XPO1 mRNA expression in LUAD clinical specimens categorized by TP53/RB1 status. Data obtained from LUAD TCGA [PanCancer, n = 237 wild type (wt), 33 mutated], LUAD OncoSG (OncoSG, Nat Genetics 2020, n = 109 wt, 6 mutated), and PRAD TCGA (PanCancer, n = 367 wt, 6 mutated) (15, 16). (B) XPO1 mRNA expression in isogenic H1563 (LUAD) and 22PC (PRAD) cell lines with or without induced loss of function of TP53 and/or RB1 by short hairpin RNA against RB1 and dominant negative TP53 gene overexpression (H1563) or CRISPR-Cas9 knock out (22PC). (C) Western blot showing exportin 1 protein abundance in isogenic H1563 (LUAD) and 22PC (PRAD) cell lines with or without induced loss of function of TP53 and/or RB1 (left; see Materials and Methods) and Western blot quantification (n = 2, right). A representative Western blot image is shown. (D) Binding score for TP53 and E2F1 in the transcription start site (TSS) of the XPO1 gene in different experimental settings including specimens from lung, prostate, and other sites. Data obtained from the Signaling Pathways Project (ChIP-seq Atlas). (E) Barplot exhibiting data from XPO1 gene promoter reporter assays in isogenic H1563 (LUAD) and 22PC (PRAD) cell lines with or without induced loss of function of TP53 and/or RB, or with E2F1 overexpression. Normalized luciferase activity of a representative biological replicate is shown. (F) Barplot showing a representative biological replicate of an experiment assessing viability of control and TP53/RB1-inactivated H1563 (LUAD), 22PC, and LnCap/AR (PRAD) cells treated with 5 nM selinexor. Each of the conditions shown was normalized to their respective untreated condition and represented as a normalized viability percentage. For (B) and (C), P values were calculated using the Student’s t test (unpaired, heterogeneous variances, and two-tailed). *P < 0.05; **P < 0.01; ***P < 0.001; ns, not significant.
Fig. 4.
Fig. 4.. Exportin 1 inhibition interferes with NE transformation.
In vivo treatment of cell line xenografts for TP53/RB1 DKO 22PC (A) and LnCap/AR (B) PRAD cells with enzalutamide, selinexor, or their combination. Five to 10 female (22PC) or male (LnCap/AR) 6-week-old athymic nude mice were subcutaneously engrafted per treatment arm and grown until tumors reached 100 to 150 mm3. At that point, mice were randomized into groups and treated with either vehicle (n = 7 for 22PC and n = 4 for LnCap/AR), selinexor (10 mg/kg, p.o., QDx3, n = 7 for 22PC and n = 4 for LnCap/AR), enzalutamide (10 mg/kg, p.o., QDx5, n = 7 for 22PC and n = 5 for LnCap/AR), or the combinations of enzalutamide + selinexor at the previously mentioned doses (n = 9 for 22PC and n = 5 for LnCap/AR). Mice weights and tumor volumes were measured twice a week, and mice were euthanized when tumors reached a humane end point (volume, 1000 mm3). Tumor volumes are shown as normalized volume in arbitrary units (au). Each tumor was normalized to its volume at day 0 of treatment. Representative IHC images for synaptophysin (SYP) and chromogranin A (CHGA) staining in DKO 22PC (C) and LnCap/AR (D) tumors. Quantification of SYP- or CHGA-positive cells, normalized to tissue area, in immunohistochemical tissue stains in DKO 22PC (n = 6, 5, 4, and 4 tumors for control, selinexor-, enzalutamide, and combo-treated arms, respectively) (E) and LnCap/AR (n = 5, 5, 6, and 6 randomly selected tissue pieces for control, selinexor-, enzalutamide, and combo-treated arms, respectively) (F) tumors. Positive cells were counted, tissue area (viable tumor area) was estimated using the SketchAndCalc online app (https://sketchandcalc.com/), and positive-stained cells were normalized by estimated area. (G) RNA-seq data from tumors from (A) collected at control arm experimental end point (day 31), showing mRNA expression for genes of interest, involved in NE transformation, divided by treatment arm (n = 4, 3, 3, and 3 tumors for the control, enzalutamide-, selinexor-, and combo-treated tumors). mRNA expression values are shown as TPM. (H) H&E and IHC staining for markers of interest for the EGFR-mutant combined NSCLC/SCLC PDX tumor MSK_Lx151. (I) In vivo treatment of the MSK_Lx151 PDX with vehicle (n = 5), osimertinib (n = 5), selinexor (n = 5), or their combination (n = 5). Five to 10 female 6-week-old NOD.Cg-Prkdc<scid> Il2rg<tm1Wjl>/SzJ (NSG) mice were subcutaneously engrafted per treatment arm and grown until tumors reached 100 to 150 mm3. At that point, mice were randomized into groups and treated with either vehicle, selinexor (10 mg/kg, p.o. QDx3), enzalutamide (10 mg/kg, p.o. QDx5), osimertinib (25 mg/kg, p.o. QDx5), or the combination of osimertinib + selinexor at the previously mentioned doses. Mice weights and tumor volumes were measured twice a week, and mice were euthanized when tumors reached a humane end point (volume, 1000 mm3). Tumor volumes are shown as normalized volume in arbitrary units (au). Each tumor was normalized to its volume at day 0 of treatment. Pathway enrichment analysis on DEGs from enzalutamide versus control (J) and combination versus enzalutamide (K) conditions in the transcriptomic data from TP53/RB1 DKO 22PC xenografts treated in vivo and collected at control arm experimental end point (day 31). Categorized pathways of interest, previously involved in NE transformation (3, 4), are shown. For (A), (C), (D), and (E), P values were calculated using the Student’s t test (unpaired, heterogeneous variances, and two-tailed). *P < 0.05, **P < 0.01, and ***P < 0.001.
Fig. 5.
Fig. 5.. Exportin 1 inhibition down-regulates SOX2 expression, hindering the acquisition of NE features.
(A) SOX2 mRNA expression in tumors divided by treatment condition. mRNA expression values are shown as TPM (n = 4, 3, 3, and 3 tumors for the control, enzalutamide-, selinexor-, and combo-treated tumors, respectively). (B) Western blot showing SOX2 protein expression of TP53/RB1 DKO 22PC and Lx151 models treated in vivo (n = 3 per treatment condition). Five to 10 female 6-week-old NOD.Cg-Prkdc<scid> Il2rg<tm1Wjl>/SzJ (NSG) mice (Lx151) or female 6-week-old athymic nude mice (22PC xenografts) were subcutaneously engrafted per treatment arm and grown until tumors reached 100 to 150 mm3. At that point, mice were randomized into groups and treated with either vehicle (n = 7 for 22PC and n = 5 for Lx151) selinexor (10 mg/kg, p.o., QDx3, n = 7 for 22PC, and n = 5 for Lx151), enzalutamide (for 22PC, 10 mg/kg, p.o., QDx5, n = 7), osimertinib (for Lx151, 25 mg/kg, p.o., QDx5, n = 5), or the combinations of enzalutamide + selinexor (22PC, n = 9) or osimertinib + selinexor (Lx151, n = 5) at the previously mentioned doses. Mice weights and tumor volumes were measured twice a week, and mice were euthanized when tumors reached a humane end point (volume, 1000 mm3). (C) SOX2 mRNA expression in LUAD clinical specimens, categorized by their TP53/RB1 status. P values are shown. Data obtained from LUAD TCGA (PanCancer, n = 237 wt and 33 mutated), LUAD OncoSG (OncoSG, Nat Genetics 2020, n = 109 wt and mutated), and PRAD TCGA (PanCancer, n = 107 wt and 19 mutated) (15, 16). See also fig. S3. (D) Western blot showing SOX2 protein abundance in isogenic control and TP53-and/or RB1-inactivated H1563 (LUAD) and 22PC (PRAD) cell lines. (E) SOX2 protein abundance in control and TP53/RB1-inactivated H1563 (LUAD), 22PC, and LnCap/AR (PRAD) cell lines treated with selinexor (5 nM) for 4 days. ASCL1, CHGA, and INSM1 mRNA expression (F) and SOX2, CHGA, NCAM1, SYP, and AR protein abundance (G) in DKO 22PC cells treated with enzalutamide (150 nM), selinexor (5 nM), or their combination for 4 days. For Western blots and mRNA plots, representative images are shown. P values were calculated using the Student’s t test (unpaired, heterogeneous variances, and two-tailed). *P < 0.05, and ***P < 0.001.

References

    1. Marcoux N, Gettinger SN, O’Kane G, Arbour KC, Neal JW, Husain H, Evans TL, Brahmer JR, Muzikansky A, Bonomi PD, del Prete S, Wurtz A, Farago AF, DiasSantagata D, Mino-Kenudson M, Reckamp KL, Yu HA, Wakelee HA, Shepherd FA, Piotrowska Z, Sequist LV, EGFR-mutant adenocarcinomas that transform to small-cell lung cancer and other neuroendocrine carcinomas: Clinical outcomes. J. Clin. Oncol. 37, 278–285 (2019). - PMC - PubMed
    1. Aggarwal R, Huang J, Alumkal JJ, Zhang L, Feng FY, Thomas GV, Weinstein AS, Friedl V, Zhang C, Witte ON, Lloyd P, Gleave M, Evans CP, Youngren J, Beer TM, Rettig M, Wong CK, True L, Foye A, Playdle D, Ryan CJ, Lara P, Chi KN, Uzunangelov V, Sokolov A, Newton Y, Beltran H, Demichelis F, Rubin MA, Stuart JM, Small EJ, Clinical and genomic characterization of treatment-emergent small-cell neuroendocrine prostate cancer: A multi-institutional prospective study. J. Clin. Oncol. 36, 2492–2503 (2018). - PMC - PubMed
    1. Quintanal-Villalonga Á, Chan JM, Yu HA, Pe’er D, Sawyers CL, Sen T, Rudin CM, Lineage plasticity in cancer: A shared pathway of therapeutic resistance. Nat. Rev. Clin. Oncol. 17, 360–371 (2020). - PMC - PubMed
    1. Quintanal-Villalonga A, Taniguchi H, Zhan YA, Hasan MM, Chavan SS, Meng F, Uddin F, Manoj P, Donoghue MTA, Won HH, Chan JM, Ciampricotti M, Chow A, Offin M, Chang JC, Ray-Kirton J, Tischfield SE, Egger J, Bhanot UK, Linkov I, Asher M, Sinha S, Silber J, Iacobuzio-Donahue CA, Roehrl MH, Hollmann TJ, Yu HA, Qiu J, de Stanchina E, Baine MK, Rekhtman N, Poirier JT, Loomis B, Koche RP, Rudin CM, Sen T, Multi-omic analysis of lung tumors defines pathways activated in neuroendocrine transformation. Cancer Discov. 11, 3028–3047 (2021). - PMC - PubMed
    1. Rudin CM, Durinck S, Stawiski EW, Poirier JT, Modrusan Z, Shames DS, Bergbower EA, Guan Y, Shin J, Guillory J, Rivers CS, Foo CK, Bhatt D, Stinson J, Gnad F, Haverty PM, Gentleman R, Chaudhuri S, Janakiraman V, Jaiswal BS, Parikh C, Yuan W, Zhang Z, Koeppen H, Wu TD, Stern HM, Yauch RL, Huffman KE, Paskulin DD, Illei PB, Varella-Garcia M, Gazdar AF, De Sauvage FJ, Bourgon R, Minna JD, Brock MV, Seshagiri S, Comprehensive genomic analysis identifies SOX2 as a frequently amplified gene in small-cell lung cancer. Nat. Genet. 44, 1111–1116 (2012). - PMC - PubMed

Publication types