

Single-cell atlases of two lophotrochozoan larvae highlight their complex evolutionary histories
- PMID: 37531419
- PMCID: PMC10396302
- DOI: 10.1126/sciadv.adg6034
Single-cell atlases of two lophotrochozoan larvae highlight their complex evolutionary histories
Abstract
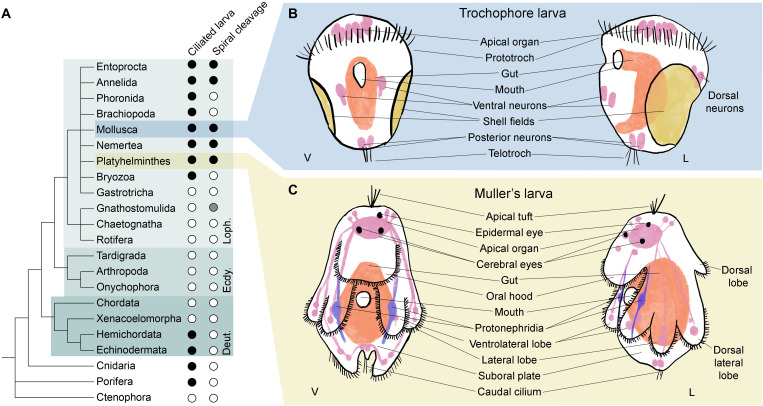
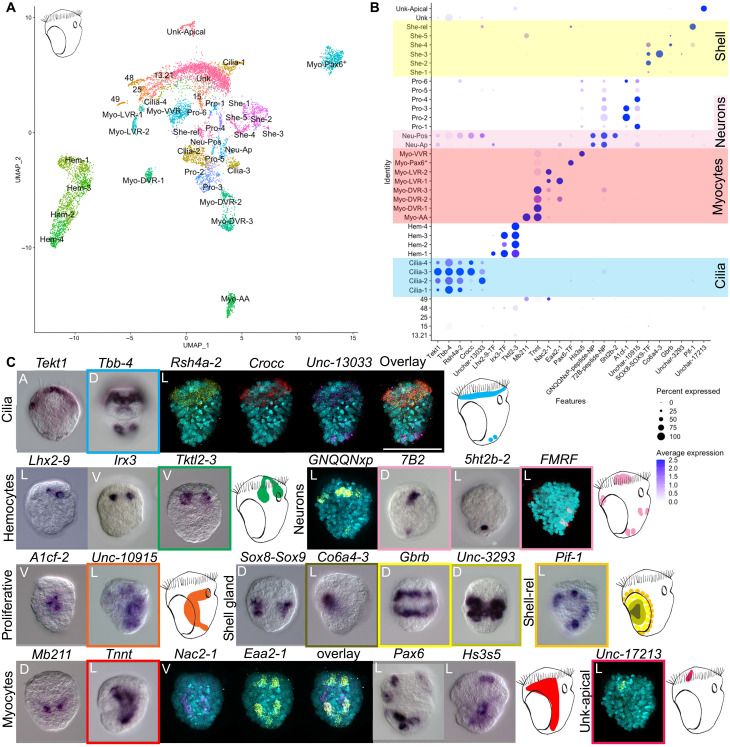
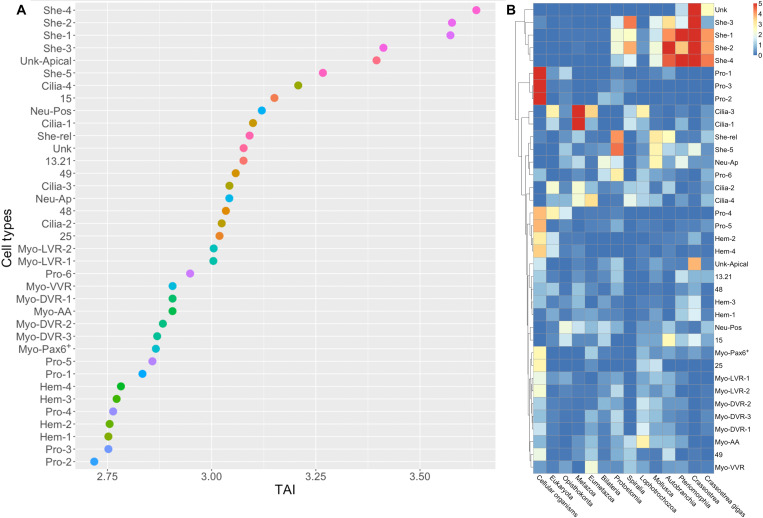
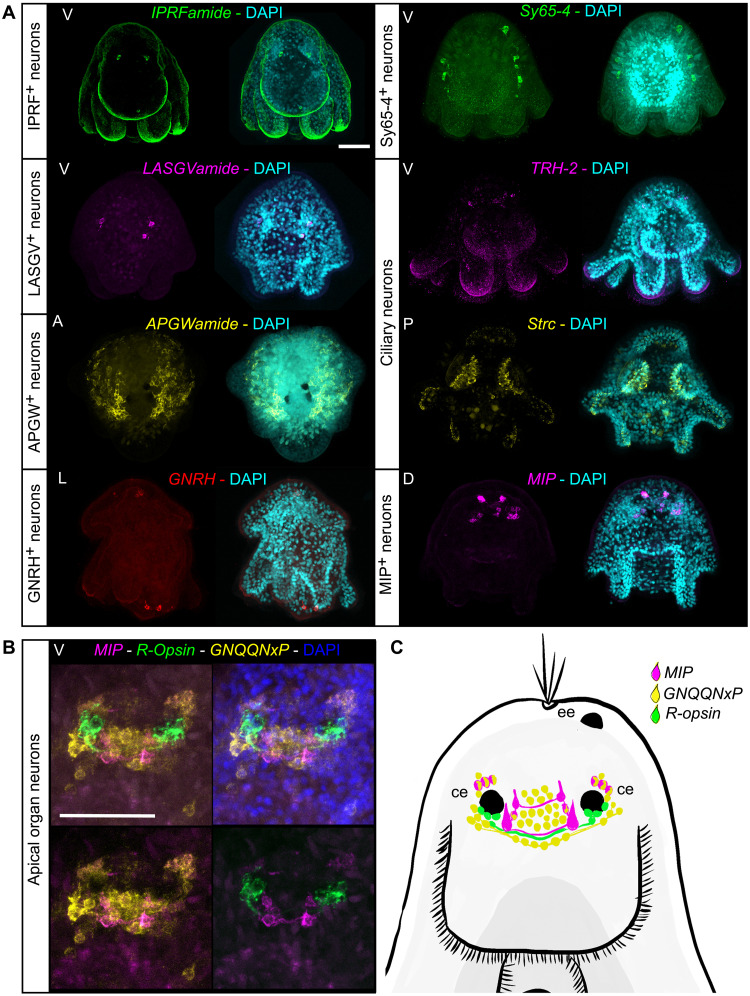
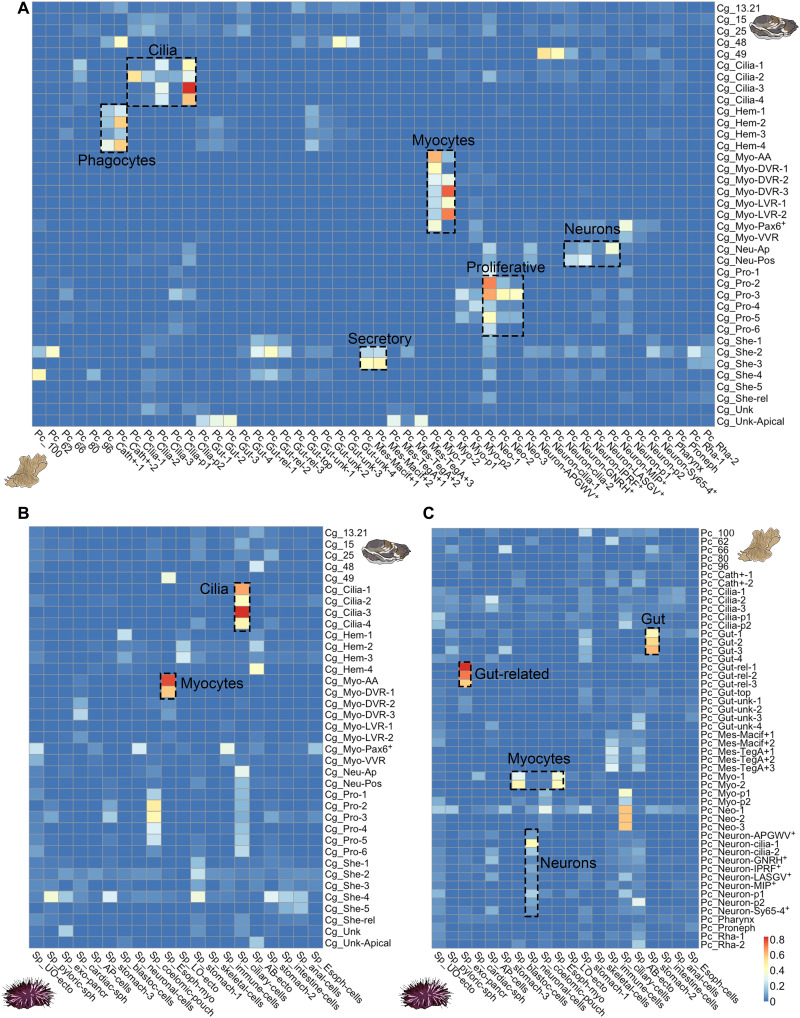
Pelagic larval stages are widespread across animals, yet it is unclear whether larvae were present in the last common ancestor of animals or whether they evolved multiple times due to common selective pressures. Many marine larvae are at least superficially similar; they are small, swim through the beating of bands of cilia, and sense the environment with an apical organ. To understand these similarities, we have generated single-cell atlases for marine larvae from two animal phyla and have compared their cell types. We found clear similarities among ciliary band cells and between neurons of the apical organ in the two larvae pointing to possible homology of these structures, suggesting a single origin of larvae within Spiralia. We also find several clade-specific innovations in each larva, including distinct myocytes and shell gland cells in the oyster larva. Oyster shell gland cells express many recently evolved genes that have made previous gene age estimates for the origin of trochophore larvae too young.
Figures

Similar articles
-
From trochophore to pilidium and back again - a larva's journey.Int J Dev Biol. 2014;58(6-8):585-91. doi: 10.1387/ijdb.140090sm. Int J Dev Biol. 2014. PMID: 25690972 Review.
-
The morphology and evolutionary significance of the ciliary fields and musculature among marine bryozoan larvae.J Morphol. 2008 Mar;269(3):349-64. doi: 10.1002/jmor.10592. J Morphol. 2008. PMID: 17960760
-
Evolutionary transcriptomics of metazoan biphasic life cycle supports a single intercalation origin of metazoan larvae.Nat Ecol Evol. 2020 May;4(5):725-736. doi: 10.1038/s41559-020-1138-1. Epub 2020 Mar 16. Nat Ecol Evol. 2020. PMID: 32203475
-
Larval body patterning and apical organs are conserved in animal evolution.BMC Biol. 2014 Jan 29;12:7. doi: 10.1186/1741-7007-12-7. BMC Biol. 2014. PMID: 24476105 Free PMC article.
-
Emerging trends in the study of spiralian larvae.Evol Dev. 2024 Jul;26(4):e12459. doi: 10.1111/ede.12459. Epub 2023 Oct 3. Evol Dev. 2024. PMID: 37787615 Review.
Cited by
-
Convergent evolution of the sensory pits in and within flatworms.BMC Biol. 2023 Nov 22;21(1):266. doi: 10.1186/s12915-023-01768-y. BMC Biol. 2023. PMID: 37993917 Free PMC article.
-
Applications and techniques of single-cell RNA sequencing across diverse species.Brief Bioinform. 2025 Jul 2;26(4):bbaf354. doi: 10.1093/bib/bbaf354. Brief Bioinform. 2025. PMID: 40698863 Free PMC article. Review.
-
Functional genomics in Spiralia.Brief Funct Genomics. 2023 Nov 17;22(6):487-497. doi: 10.1093/bfgp/elad036. Brief Funct Genomics. 2023. PMID: 37981859 Free PMC article.
-
Marine Invertebrates One Cell at A Time: Insights from Single-Cell Analysis.Integr Comp Biol. 2023 Dec 12;63(5):999-1009. doi: 10.1093/icb/icad034. Integr Comp Biol. 2023. PMID: 37188638 Free PMC article. Review.
-
Molecular evidence for pre-chordate origins of ovarian cell types and neuroendocrine control of reproduction.bioRxiv [Preprint]. 2025 Mar 28:2025.03.24.644836. doi: 10.1101/2025.03.24.644836. bioRxiv. 2025. PMID: 40196654 Free PMC article. Preprint.
References
-
- C. Nielsen, Trochophora larvae: Cell-lineages, ciliary bands, and body regions. 1. Annelida and Mollusca. J. Exp. Zool. B Mol. Dev. Evol. 302, 35–68 (2004). - PubMed
-
- A. Hejnol, M. Q. Martindale, J. Q. Henry, High-resolution fate map of the snail Crepidula fornicata: The origins of ciliary bands, nervous system, and muscular elements. Dev. Biol. 305, 63–76 (2007). - PubMed
-
- C. Nielsen, Trochophora larvae: Cell-lineages, ciliary bands and body regions. 2. Other groups and general discussion. J. Exp. Zool. B Mol. Dev. Evol. 304, 401–447 (2005). - PubMed
-
- J. Wang, L. Zhang, S. Lian, Z. Qin, X. Zhu, X. Dai, Z. Huang, C. Ke, Z. Zhou, J. Wei, P. Liu, N. Hu, Q. Zeng, B. Dong, Y. Dong, D. Kong, Z. Zhang, S. Liu, Y. Xia, Y. Li, L. Zhao, Q. Xing, X. Huang, X. Hu, Z. Bao, S. Wang, Evolutionary transcriptomics of metazoan biphasic life cycle supports a single intercalation origin of metazoan larvae. Nat. Ecol. Evol. 4, 725–736 (2020). - PubMed
MeSH terms
LinkOut - more resources
Full Text Sources
Molecular Biology Databases
