. 2023 Aug 2;9(31):eadg8163.
doi: 10.1126/sciadv.adg8163. Epub 2023 Aug 2.

Inducible nonhuman primate models of retinal degeneration for testing end-stage therapies

Affiliations

Inducible nonhuman primate models of retinal degeneration for testing end-stage therapies

Divya Ail et al. Sci Adv. .

Abstract

The anatomical differences between the retinas of humans and most animal models pose a challenge for testing novel therapies. Nonhuman primate (NHP) retina is anatomically closest to the human retina. However, there is a lack of relevant NHP models of retinal degeneration (RD) suitable for preclinical studies. To address this unmet need, we generated three distinct inducible cynomolgus macaque models of RD. We developed two genetically targeted strategies using optogenetics and CRISPR-Cas9 to ablate rods and mimic rod-cone dystrophy. In addition, we created an acute model by physical separation of the photoreceptors and retinal pigment epithelium using a polymer patch. Among the three models, the CRISPR-Cas9-based approach was the most advantageous model in view of recapitulating disease-specific features and its ease of implementation. The acute model, however, resulted in the fastest degeneration, making it the most relevant model for testing end-stage vision restoration therapies such as stem cell transplantation.


Figures

Fig. 1.
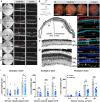
Fig. 1.. Optogenetic strategy for rod ablation and proof of concept in mouse.
(A) Schematic representation of the experiment protocol—KillerRed under the control of rhodopsin promoter is packaged into AAV vectors and delivered by subretinal injection to the retina and activation of KR by light results in toxicity. (B) Immunolabeling of retinal flatmounts of KR-injected mice with KR (red), rhodopsin (green), DAPI (blue), and overlay of the three channels. Images are acquired at the level of the segments and the ONL. (C) Immunolabeling of the retinal section from the KR-injected eye with KR (red), short-wavelength opsin (green), and DAPI (blue). (D to G′) Fundus images (D and D′), fundus images in the red channel (E and E′), eye OCT (F and F′), and retinal OCT (G and G′) in KR-injected (control) (D to G) and KR-injected and illuminated mice (D′ to G′). The red dotted line demarcates the injected area, and the white dotted line demarcates the area of damage after illumination. (H) Immunolabeling of retinal flatmount from KR-injected and illuminated mice. Region of degeneration is demarcated by the dotted white line. (I to J′) KR immunolabeling of retina from KR-injected (KR) (I and I′) and KR-injected and illuminated mice (KR + Illu) (J and J′). (K) Scotopic a- and b-wave amplitudes and photopic b-wave amplitude shown as a function of stimulus intensity (x axis) from mice before illumination (gray bars) and 4 months after illumination (red bars); all values are shown as mean ± SD for N = 12 eyes. Scale bars, 50 μm. ONL, outer nuclear layer, OCT, optical coherence tomography.
Fig. 2.
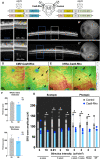
Fig. 2.. Expression of KillerRed and loss of PRs induced by illumination in NHP.
(A) Fundus image of the KR-injected NHP eye. (B and B′) KR immunolabeling in (B) retinal flatmount and (B′) retinal section of the KR-injected eye showing rod PR-specific expression. (C) Immunolabeling of the KR-injected and illuminated eye. (D to D″) OCT images of the KR-injected and illuminated eye. Areas with (D′) PR loss and an adjacent (D″) control region are demarcated by the yellow dotted line and magnified in the corresponding panels. (E) Histological sections of the KR-injected and illuminated eye. Regions of damage are demarcated by the yellow dotted line and arrows point to degenerated areas of the ONL. Immunolabeling with rhodopsin (yellow) and DAPI for nuclear staining (blue) in (F and F′) KR-injected control eyes and (G and G′) KR-injected and illuminated eyes. (H) Schematic representation of the experiment protocol—KR under the control of rhodopsin promoter is packaged into AAV and delivered by subretinal injection to the NHP retina, and KR is activated by illumination with green light in one eye. Scale bars, 100 μm.
Fig. 3.
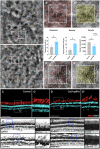
Fig. 3.. Optogene-mediated retinal degeneration in the NHP retina.
(A) Heatmaps from the area of injection of eye injected with KR before (KR) and after illumination (KR + Illu). Arrows point toward regions of degeneration and thinner areas of the retina. (B) Thickness of the whole retina and the outer retina 6 months (6M) after illumination. (C) Schematic representation of the injected and illuminated eye with the ROI used for measurements in AO images. (D and D′) AO images from the ROI selected from the injected eye (KR) and the injected and illuminated eye (KR + Illu) showing the PR distribution and segmentation in live animals at 6 months after illumination; (E) quantification of the dispersion, spacing, and density of PRs in the injected eye (KR, gray bars) and the injected and illuminated eye (KR + Illu, red bars). The KR controls (gray bars) are set to 100%, and the KR + Illu (red bars) are normalized against the controls. All values are shown as mean ± SD for N = 3 ROIs, *P < 0.05, **P < 0.001, and ***P < 0.0001 with unpaired Student’s t test. (F) Scotopic and photopic a- and b-wave amplitudes shown as a function of stimulus intensity (x axis) from NHPs before [baseline (BL), gray bars] and after illumination [3 months (3M), red bars]; all values are shown as mean ± SD for N = 4 NHPs.
Fig. 4.
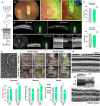
Fig. 4.. CRISPR-Cas9 strategy for rod ablation and proof of concept in mouse.
(A) OCT images of mouse injected with Cas9 and Rhodopsin sgRNA and control mouse at the ventral (V), dorsal (D), central (C), temporal (T), and nasal (N) regions. Red arrows point to the regions of degeneration. (B) Schematic representation of the experiment protocol in mouse. Cas9 and guide RNA targeting Rhodopsin under the control of the CMV promoter is packaged into AAV vectors and delivered by subretinal injection to the retina. (C) Fundus images of three mice after injection. The white dotted line demarcates the injected area, and the yellow dotted line demarcates the area of damage. (D) Histology of the eye injected with Cas9-Rho showing the injected and noninjected region. Magnified images of the areas demarcated within the boxes are shown below—(D′) injected area and (D″) noninjected area. (E to H″) Immunolabeling of the (E and F) control eye and the eye injected with (F and H) Cas9-Rho with (E to F′) rhodopsin (in red) and (G to H″) short-wavelength (SW) cone opsin (G and H) (in yellow) and nuclear staining by DAPI (in cyan blue or blue). The box demarcated with the white dotted line in (H) is shown in (H′) and further magnified in (H″). White arrows point to cell bodies labeled with cone opsin. (I) Scotopic (a and b wave) and photopic b-wave amplitudes shown as a function of stimulus intensity (x axis) of control (gray bars) and Cas9-Rho–injected (blue bars) eyes. Values are shown as mean ± SD for N = 3 for control and N = 12 for Cas9-Rho eyes, and each group was compared by Student’s t test, *P < 0.05, **P < 0.001, and ***P < 0.0001. Scale bars, 100 μm.
Fig. 5.
Fig. 5.. CRISPR-Cas9 loss of structure and function of NHP retina.
(A) Schematic representation of the injection in NHP. Cas9 and guide RNA targeting Rhodopsin under the control of CMV or rhodopsin promoter is packaged into AAV vectors and delivered by subretinal injection to the retina. (B to C′) OCT images of NHP eyes injected with Cas9-Rho under the control of (B and B′) a ubiquitous (CMV) or a (C and C′) rod-specific (rhodopsin) promoter. The area demarcated by the dotted line and the corresponding magnified images show the unaffected regions (blue boxes as control) and the degenerated areas (white boxes). (B′ and C′) The injection bleb (white dotted line) and the focal regions of degeneration (yellow dotted line) are demarcated on the eye fundus image. (D and E) Heatmaps from the (D) CMV-Cas9-Rho–injected eye and (E) Rho-Cas9-Rho–injected eye at baseline before injection (BL) and 3 months after injection (3M). (F) Thickness of the whole retina and the outer retina 3M after injection. (G) Scotopic (a and b waves), photopic (a and b waves), flicker ERG, and oscillatory potential (OP) amplitudes shown as a function of stimulus intensity (x axis) from control eyes injected with Cas9-scrambled-sgRNA (BL, gray bars) and Cas9-Rho (blue bars); all values are shown as mean ± SD for N = 3 NHPs, and each group was compared by Student’s t test, *P < 0.05.
Fig. 6.
Fig. 6.. CRISPR-Cas9–mediated retinal degeneration in NHP.
(A to B″) Adaptive optics images from the (A and B) ROI selected from the (A to A″) control eye and (B to B″) Cas9-Rho eye showing the PRs (A′ and B′) distribution and (A″ and B″) segmentation in live animals at 3 months after injection. Dispersion, spacing, and density of PRs are quantified in the control eye (gray bars) and Cas9-Rho–injected eye (blue bars). All values are shown as mean ± SD for N = 3 ROIs, *P < 0.05 with unpaired Student’s t test. (C to D′) Immunolabeling of rhodopsin in (C and C′) Control and (D and D′) Cas9-Rho eyes from the area of injection. (E and E′) Histological sections of the control and Cas9-Rho eyes from the (E) injected area and (E′) a distal region (E′). ROIs are demarcated within blue dotted lines and magnified in adjacent panels. Scale bars, 100 μm.
Fig. 7.
Fig. 7.. Physical barrier strategy and proof of concept in rat.
(A) Schematic representation of the experiment protocol—a polymer patch is surgically placed between the RPE and the PRs of rat retinas. (B to E′) Fundus (B to E) and OCT images (B′ to E′) acquired before surgery (B and B′) and 4 weeks after surgery (C′ to E′) with polyimide patch (C and C′), parylene-coated polyimide patch (C and C′), and SU8 patch (E and E′); arrow points to the patch. (F and G) Histology of the eye with the red arrow pointing toward the polymer patch. (H) Magnified images of an area distal from the patch (control) and the area proximal to the patch (Patch). (I) Immunolabeling of different regions with rhodopsin (in red) and nuclear staining by DAPI (in blue). Undamaged area: distal region from the patch; control: contralateral eye without a patch. Scale bars, 100 μm.
Fig. 8.
Fig. 8.. Physical barrier–mediated retinal degeneration in NHP.
(A) Schematic representation of the experiment protocol—a polymer patch is surgically placed between the RPE and the PRs of the NHP retina. (B) Fundus image of the NHP retina showing the placement of the polymer patch in proximity of the fovea. (C) Heatmaps from the area of eye with the polymer patch before surgery and 1 month after surgery; black arrows point toward regions of degeneration and thinner areas of the retina, and blue arrow points to the fovea. (D and D′) Thickness of the (D) whole retina and the (D′) outer retina 1 month (1M) after injection. (E) OCT images from a region distal from patch (patch area 1), showing cross section of the patch (patch area 2) and in close proximity of the patch (patch area 3). The bright green lines show the exact region of the OCT images, and magnified images from each area are shown in the panels on the right. Red arrows point to punctuate retinal disorganization. (F) Adaptive optics image from the eye with patch showing the ROI in an area within the patch and control region as white boxes. The PR distribution and segmentation from the patch and control ROI are shown 1M and 6M after surgery. Dispersion, spacing, and density of PRs are quantified in the control region (gray bars) and patch ROI (green bars) at 1M and 6M after surgery. All values are shown as mean ± SD for N = 3 ROIs, *P < 0.05, **P < 0.001, and ***P < 0.0001 with unpaired Student’s t test. (G) Histological sections of the control eye and the eye with patch. ROIs are demarcated by the green dotted lines and shown magnified.
Fig. 9.
Fig. 9.. Rod and cone loss in NHP retina induced by physical strategy.
(A) Immunolabeling with rhodopsin (in red) and nuclear staining with DAPI (in cyan blue) of the eye with the patch. The different ROIs are demarcated within white boxes and magnified in (A1) to (A4); (A1) region proximal to the patch, (A2) area with the patch, (A3) ONL just below the patch, and (A4) region distal to the patch. (B and B′) Immunolabeling with short-wavelength cone opsin (in red) and nuclear staining with DAPI (in blue) of the eye with the patch in a (B) proximal control area near the region in A4 and (B′) patch area near the region in A3. (C and C′) Coimmunolabeling with rhodopsin (in green), short-wavelength cone opsin (in red), and nuclear staining with DAPI (in blue) of the eye with the patch in a (B) proximal control area near the region in A1 and (B′) patch area near the region in A3. Scale bars, 100 μm.

References

    1. A. P. Marques, J. Ramke, J. Cairns, T. Butt, J. H. Zhang, I. Jones, M. Jovic, A. Nandakumar, H. Faal, H. Taylor, A. Bastawrous, T. Braithwaite, S. Resnikoff, P. T. Khaw, R. Bourne, I. Gordon, K. Frick, M. J. Burton, The economics of vision impairment and its leading causes: A systematic review. eClinicalMedicine 46, 101354 (2022). - PMC - PubMed
    1. B. Roska, J. A. Sahel, Restoring vision. Nature 557, 359–367 (2018). - PubMed
    1. S. Picaud, D. Dalkara, K. Marazova, O. Goureau, B. Roska, J.-A. Sahel, The primate model for understanding and restoring vision. Proc. Natl. Acad. Sci. U.S.A. 116, 26280–26287 (2019). - PMC - PubMed
    1. A. Hendrickson, A morphological comparison of foveal development in man and monkey. Eye 6, 136–144 (1992). - PubMed
    1. K. Viets, K. C. Eldred, R. J. Johnston, Mechanisms of photoreceptor patterning in vertebrates and invertebrates. Trends Genet. 32, 638–659 (2016). - PMC - PubMed