. 2023 Sep:65:102825.
doi: 10.1016/j.redox.2023.102825. Epub 2023 Jul 24.

EP1 activation inhibits doxorubicin-cardiomyocyte ferroptosis via Nrf2

Affiliations

EP1 activation inhibits doxorubicin-cardiomyocyte ferroptosis via Nrf2

Bei Wang et al. Redox Biol. 2023 Sep.

Abstract

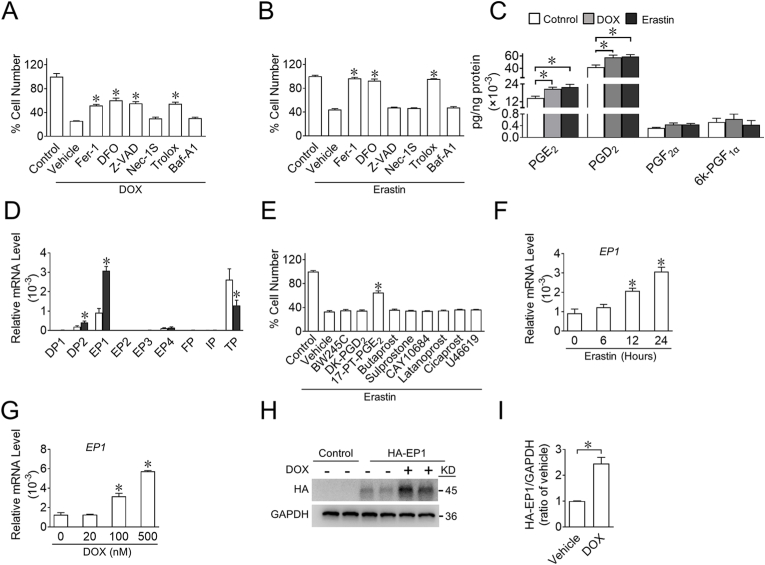
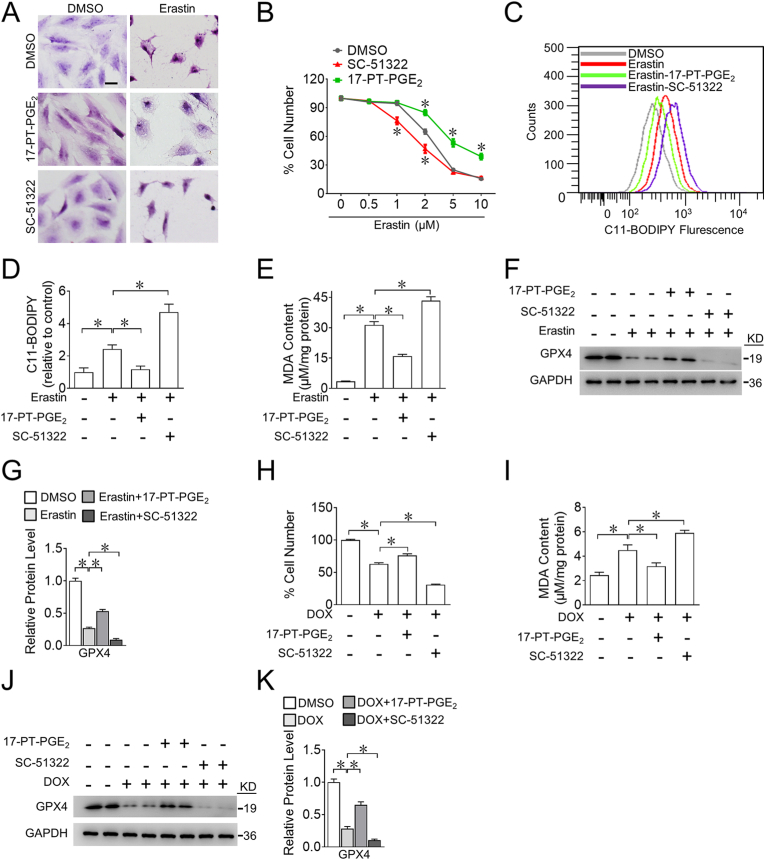
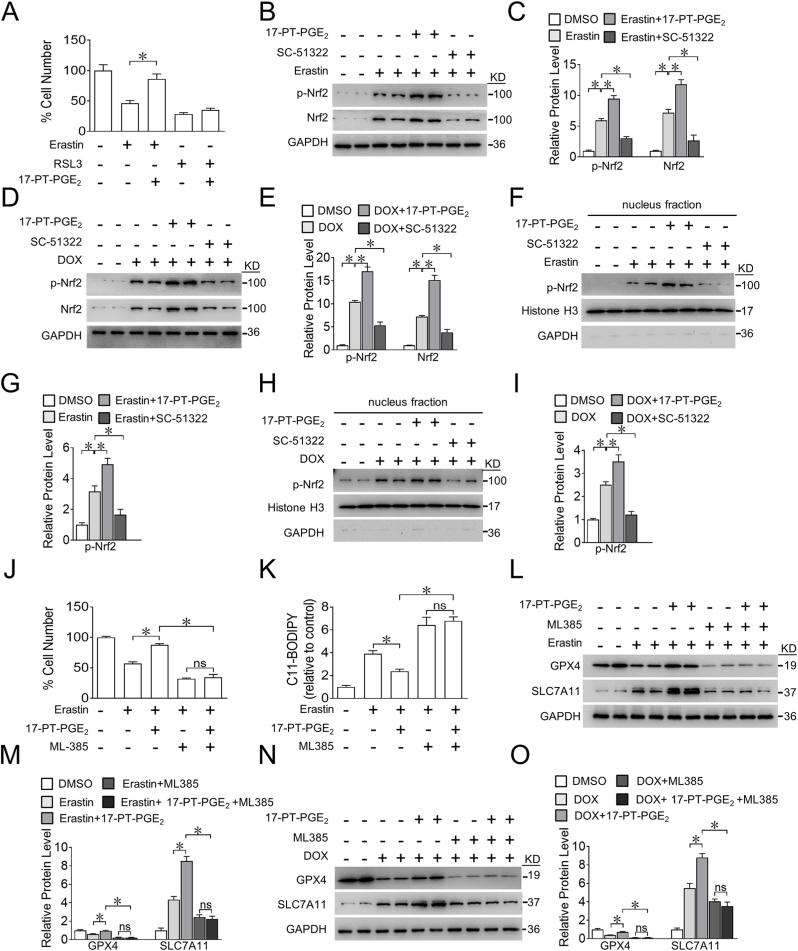
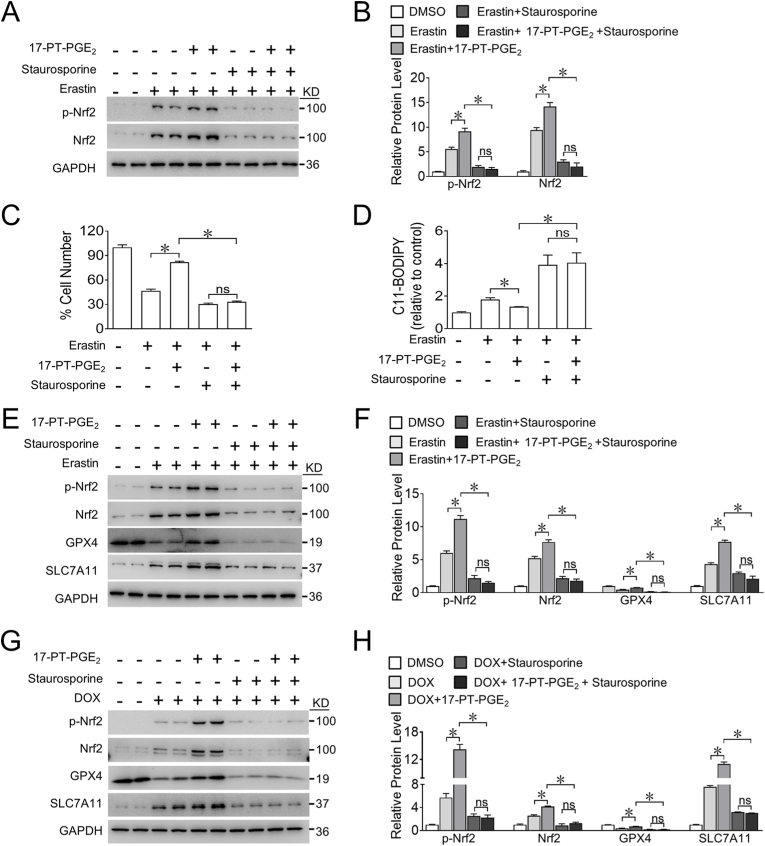
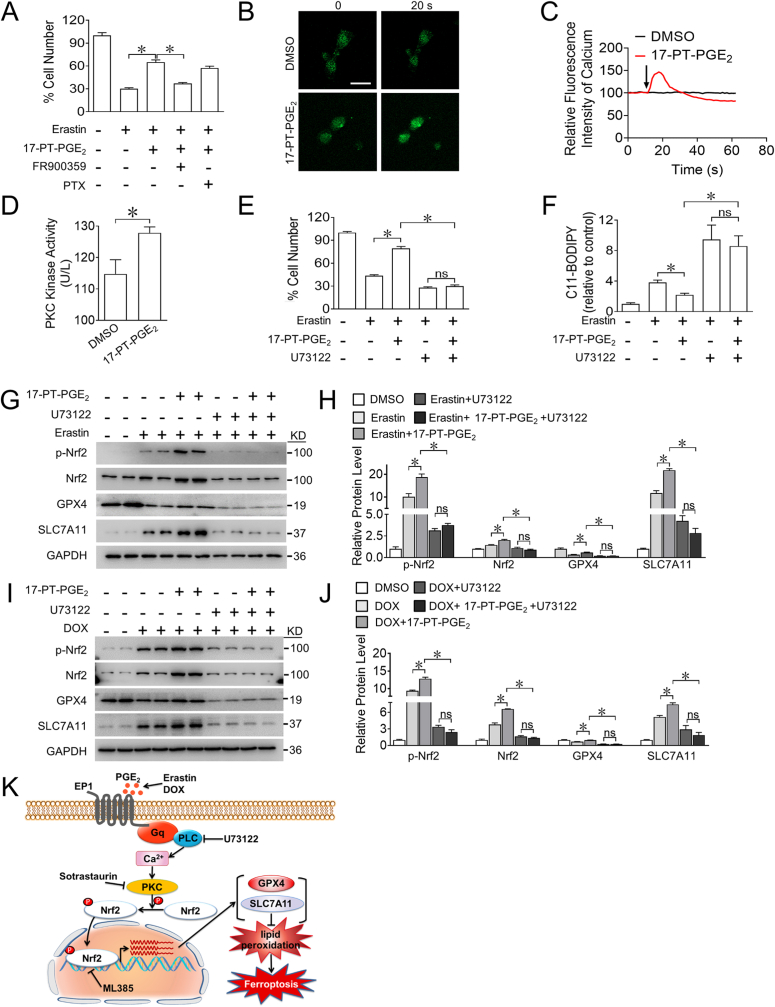
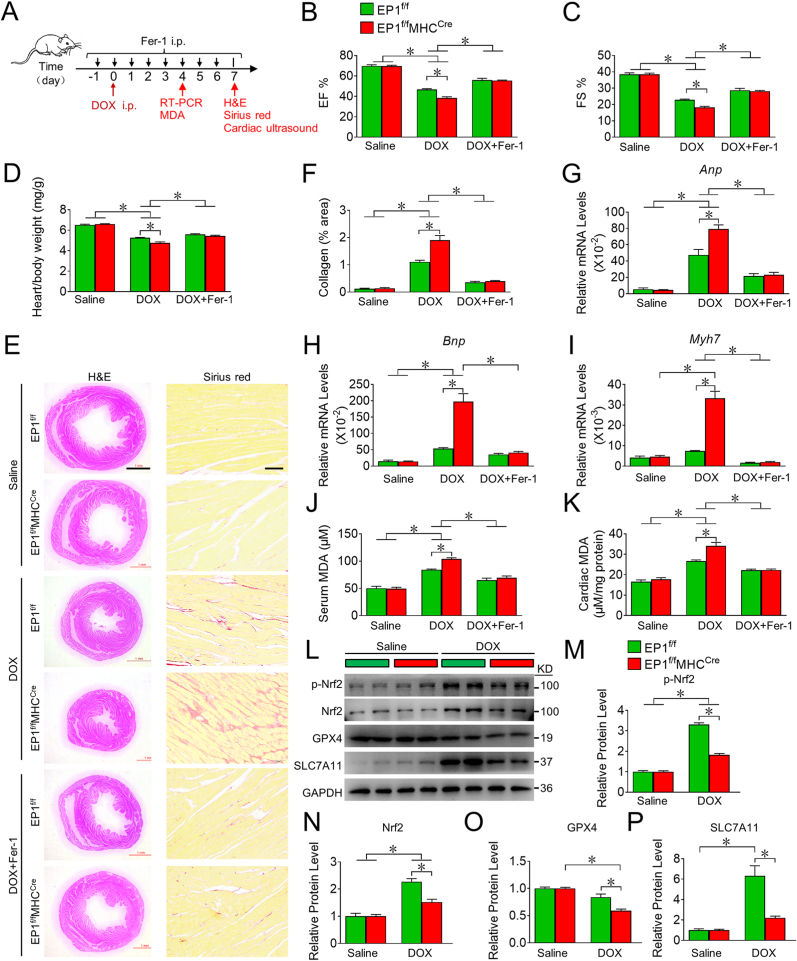
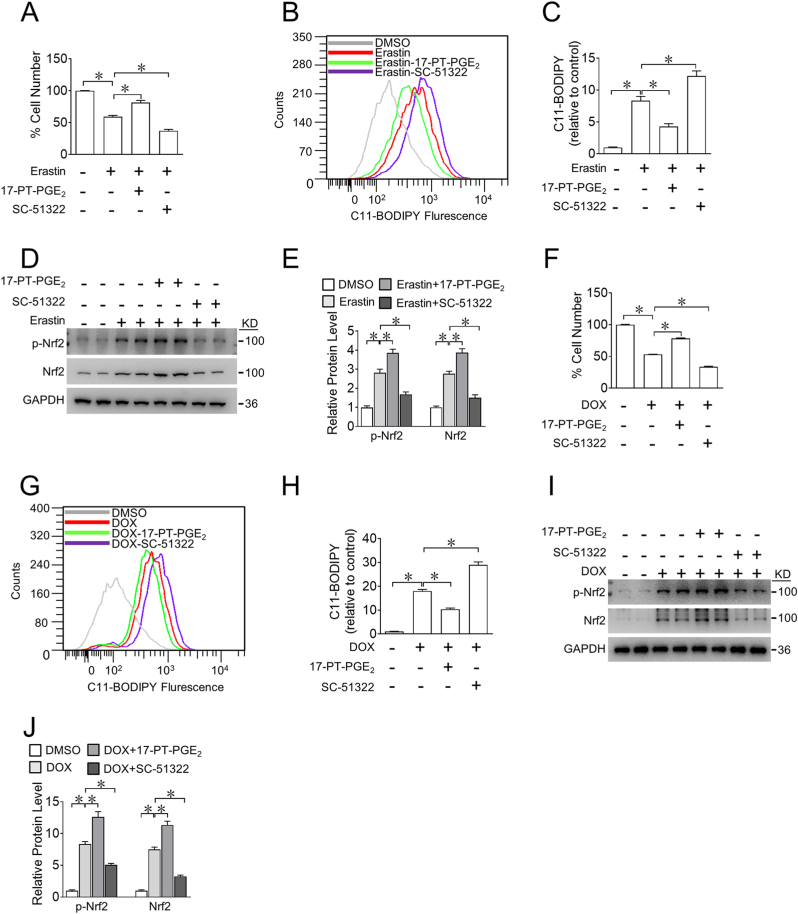
Chemotherapeutic agents, such as doxorubicin (DOX), may cause cardiomyopathy, even life-threatening arrhythmias in cancer patients. Ferroptosis-an iron-dependent oxidative form of programmed necrosis, plays a pivotal role in DOX-induced cardiomyopathy (DIC). Prostaglandins (PGs) are bioactive signaling molecules that profoundly modulate cardiac performance in both physiologic and pathologic conditions. Here, we found that PGE2 production and its E-prostanoid 1 receptor (EP1) expression were upregulated in erastin (a ferroptosis inducer) or DOX-treated cardiomyocytes. EP1 inhibition markedly aggravated erastin or DOX-induced cardiomyocyte ferroptosis, whereas EP1 activation exerted opposite effect. Genetic depletion of EP1 in cardiomyocytes worsens DOX-induced cardiac injury in mice, which was efficiently rescued by the ferroptosis inhibitor Ferrostatin-1 (Fer-1). Mechanistically, EP1 activation protected cardiomyocytes from DOX-induced ferroptosis by promoting nuclear factor erythroid 2-related factor 2 (Nrf2)-driven anti-oxidative gene expression, such as glutathione peroxidase 4 (GPX4) and solute carrier family 7 member 11 (SLC7A11). EP1 was coupled with Gαq to elicit intracellular Ca2+ flux and activate the PKC/Nrf2 cascade in ferroptotic cardiomyocytes. EP1 activation also prevents DOX-induced ferroptosis in human cardiomyocytes. Thus, PGE2/EP1 axis protects cardiomyocytes from DOX-induced ferroptosis by activating PKC/Nrf2 signaling and activation of EP1 may represent an attractive strategy for DIC prevention and treatment.

Keywords: Cardiomyocyte ferroptosis; DOX-induced cardiomyopathy; EP1; Nrf2.


Conflict of interest statement

Declaration of competing interest The authors declare that there is no conflict of interest

Figures

Fig. 1
Fig. 1
EP1 expression is upregulated in cardiomyocyte in response to erastin or DOX treatment A, B. Effect of Fer-1 (2 μM, ferroptosis inhibitor), DFO (100 μM, iron chelator), Z-VAD (10 μM, apoptosis inhibitor), Nec-1S (10 μM, necroptosis inhibitor), Trolox (100 μM, antioxidant) or Baf-A1 (1 nM, autophagy inhibitor) on living H9C2 cells treated with DOX (2 μM) (A) or erastin (3 μM) (B). *P < 0.05 vs vehicle; A, n = 5; B, n = 8. C. The PG profiles of H9C2 cells challenged by erastin or DOX. H9C2 cells were treated with erastin or DOX; and arachidonic acid (30 μM) was added into culture after washing for additional 30 min, culture supernatants were collected for PG measurement. *P < 0.05 vs control; n = 6. D. Relative mRNA levels of various prostaglandin receptors in H9C2 cells in response to erastin. *P < 0.05 vs control; n = 6. E. Effect of various prostaglandin receptors agonist (BW245C (10 μM), DP1 agonist; DK-PGD2 (1 μM), DP2 agonist; 17-PT-PGE2 (2.5 μM), EP1 agonist; Butaprost (5 μM), EP2 agonist; Sulprostone (1 μM), EP3 agonist; CAY10684 (1 μM), EP4 agonist; Latanoprost (2 μM), FP agonist; Cicaprost (1 μM), IP agonist; U46619 (1 μM), TP agonist) on living H9C2 cells treated with erastin. *P < 0.05 vs vehicle; n = 8. F. Time-dependent EP1 expression in H9C2 cells in response to erastin. *P < 0.05 vs 0 h; n = 6. G. Dose-dependent EP1 expression in H9C2 cells in response to DOX. *P < 0.05 vs 0 nM; n = 4. H. Western blot analysis of HA-EP1 expression in heart tissue from EP1-N-HA mice treated with DOX. I. Quantification of the HA-EP1 expression in H. *P < 0.05 vs vehicle; n = 4.
Fig. 2
Fig. 2
Activation of EP1 inhibits DOX-induced ferroptosis in H9C2 cells A. Representative H&E images of H9C2 cells treated with 17-PT-PGE2 or SC-51322 in the presence of erastin. Scale bars: 20 μm B. Effect of 17-PT-PGE2 or SC-51322 on living H9C2 cells treated with different concentrations of erastin. *P < 0.05 vs DMSO; n = 4–6. C. Representative flow cytometric plots showing intracellular ROS levels of H9C2 cells treated with 17-PT-PGE2 or SC-51322 in the presence of erastin. D. Quantification of ROS production in (C). *P < 0.05 vs indicated; n = 5. E. MDA levels in H9C2 cells treated with 17-PT-PGE2 or SC-51322 in the presence of erastin. *P < 0.05 vs indicated; n = 4. F. Western blot analysis of GPX4 expression in H9C2 cells treated with 17-PT-PGE2 or SC-51322 in the presence of erastin. G. Quantification of relative protein expression levels of GPX4 in (F). *P < 0.05 as indicated; n = 4. H. Effect of 17-PT-PGE2 or SC-51322 of living H9C2 cells in the presence of DOX. *P < 0.05 vs DMSO; n = 8. I. MDA levels in H9C2 cells treated with 17-PT-PGE2 and SC-51322 in the presence of DOX. *P < 0.05 vs indicated; n = 4–5. J. Western blot analysis of GPX4 expression in H9C2 cells treated with 17-PT-PGE2 or SC-51322 in the presence of DOX. K. Quantification of relative protein expression levels of GPX4 in (J) *P < 0.05 as indicated; n = 4.
Fig. 3
Fig. 3
EP1 activation reduces DOX-induced ferroptosis in cardiomyocytes through evoking Nrf2 activity A. Effect of GPX4 inhibitor RSL3 on erastin-induced ferroptosis of H9C2 cells after17-PT-PGE2 treatment. *P < 0.05 vs indicated; n = 8. B. Western blot analysis of p-Nrf2 and Nrf2 expression in H9C2 cells treated with 17-PT-PGE2 or SC-51322 in the presence of erastin. C. Quantification of relative protein expression levels in (B). *P < 0.05 as indicated; n = 4. D. Western blot analysis of p-Nrf2 and Nrf2 expression in H9C2 cells treated with 17-PT-PGE2 or SC-51322 in the presence of DOX. E. Quantification of relative protein expression levels in (D). *P < 0.05 as indicated; n = 4. F. Western blot analysis of nuclear p-Nrf2 and Nrf2 expression in H9C2 cells treated with17-PT-PGE2 or SC-51322 in the presence of erastin. G. Quantification of relative protein expression levels in (F). *P < 0.05 as indicated; n = 4. H. Western blot analysis of nuclear p-Nrf2 and Nrf2 expression in H9C2 cells treated with 17-PT-PGE2 or SC-51322 in the presence of DOX. I. Quantification of relative protein expression levels in (H). *P < 0.05 as indicated; n = 4. J, K. Effect of ML-385 (5 μM) on cell viability (J) and intracellular ROS production (K) in H9C2 cells treated with 17-PT-PGE2 in the presence of erastin. *P < 0.05 as indicated; (J), n = 8; (K), n = 6. L. Western blot analysis of effect of ML-385 on the expression of GPX4 and SLC7A11 in H9C2 cells treated with 17-PT-PGE2 in the presence of erastin. M. Quantification of relative protein expression levels in (L). *P < 0.05 as indicated; n = 4. N. Western blot analysis of effect of ML-385 on the expression of GPX4 and SLC7A11 in H9C2 cells treated with 17-PT-PGE2 in the presence of DOX. O. Quantification of relative protein expression levels in (N). *P < 0.05 as indicated; n = 4.
Fig. 4
Fig. 4
Blockage of PKC abolishes EP1-mediated anti-ferroptosis effect on DOX-treated cardiomyocytes through suppressing Nrf2 A. Western blot analysis of effect of staurosporine (20 nM) on the expression of p-Nrf2 and Nrf2 in H9C2 cells treated with 17-PT-PGE2 in the presence of erastin. B. Quantification of relative protein expression levels in (A). *P < 0.05 as indicated; n = 4. C, D. Effect of staurosporine on the cell viability (C) and intracellular ROS production (D) in H9C2 cells treated with 17-PT-PGE2 in the presence of erastin. *P < 0.05 as indicated; (C), n = 8; (D), n = 7. E. Western blot analysis of effect of staurosporine on the expression of p-Nrf2, Nrf2, GPX4 and SLC7A11 in H9C2 cells treated with17-PT-PGE2 in the presence of erastin. F. Quantification of relative protein expression levels in (E). *P < 0.05 as indicated; n = 4. G. Western blot analysis of effect of staurosporine on the expression of p-Nrf2, Nrf2, GPX4 and SLC7A11 in H9C2 cells treated with 17-PT-PGE2 in the presence of DOX. H. Quantification of relative protein expression levels in (G). *P < 0.05 as indicated; n = 4.
Fig. 5
Fig. 5
EP1 activation protects cardiomyocytes from DOX-induced ferroptosis by mobilizing Ca2+ to activate PKC/Nrf2 signaling A. Effect of FR900359 (1 μM) or PTX (10 μM) on the cell viability of H9C2 cells treated with 17-PT-PGE2 in the presence of erastin. *P < 0.05 as indicated; n = 8. B. Representative fluorescence images showing the intracellular Ca2+ spark in neonatal rat cardiomyocytes treated with 17-PT-PGE2. Scale bars: 10 μm C. The intracellular Ca2+ flux in neonatal rat cardiomyocytes treated with 17-PT-PGE2. The arrow indicates the injection of 17-PT-PGE2. D. PKC kinase activity in H9C2 cells after 17-PT-PGE2 treatment. *P < 0.05 as indicated; n = 5–6. E, F. The effect of U73122 (5 μM) on the cell viability (E) and intracellular ROS production (F) in H9C2 cells treated with 17-PT-PGE2 in the presence of erastin. *P < 0.05 as indicated; E, n = 8; F, n = 5–6. G. Western blot analysis of effect of U73122 on the expression of p-Nrf2, Nrf2, GPX4 and SLC7A11 in H9C2 cells treated with 17-PT-PGE2 in the presence of erastin. H. Quantification of relative protein expression levels in (G). *P < 0.05 as indicated; n = 4. I. Western blot analysis of effect of U73122 on the expression of p-Nrf2, Nrf2, GPX4 and SLC7A11 in H9C2 cells treated with 17-PT-PGE2 in the presence of DOX. J. Quantification of relative protein expression levels in (I). *P < 0.05 as indicated; n = 4. K. Schematic illustration of EP1-mediated myocardial protection in DOX-induced cardiomyocytes ferroptosis through Ca2+/PKC/Nrf2 signaling pathway.
Fig. 6
Fig. 6
EP1 deletion in cardiomyocytes exacerbates DOX-induced cardiac injury in mice through promoting cardiac ferroptosis A. Schematic diagram of the treatment of Fer-1 in DOX-challenged mice. B, C. Quantitative analysis of cardiac EF (B) and FS (C) in EP1f/f and EP1f/fMHCCre mice treated with DOX in the presence or absence of Fer-1. *P < 0.05 vs indicated; n = 8. D. The heart/body weight ratio of EP1f/f and EP1f/fMHCCre mice treated with DOX in the presence or absence of Fer-1. *P < 0.05 vs indicated; n = 8. E. Representative images of H&E and Sirius red staining of heart form EP1f/f and EP1f/fMHCCre mice treated with DOX in the presence or absence of Fer-1. H&E Scale bars: 1 mm; Sirius red Scale bars: 50 μm F. Quantification of collagen content in (E). *P < 0.05 vs indicated; n = 8. G, I. The gene expressions of Anp (G), Bnp (H), Myh7 (I) in the cardiac tissue from EP1f/f and EP1f/fMHCCre mice treated with DOX in the presence or absence of Fer-1. *P < 0.05 vs indicated; (G), n = 8; (H), n = 5–8; (I), n = 5–8. J, K. MDA levels in the serum (J) and cardiac tissue (K) from EP1f/f and EP1f/fMHCCre mice treated with DOX in the presence or absence of Fer-1. *P < 0.05 vs indicated; (J), n = 6; (K), n = 5–8. L. Western blot analysis of p-Nrf2, Nrf2, GPX4 and SLC7A11 expression in cardiac tissues from DOX-treated EP1f/f and EP1f/fMHCCre mice. M-P. Quantification of protein expression of p-Nrf2 (M), Nrf2 (N), GPX4 (O), SLC7A11 (P) in (L). *P < 0.05 as indicated; n = 6. (For interpretation of the references to colour in this figure legend, the reader is referred to the Web version of this article.)
Fig. 7
Fig. 7
EP1 activation prevents DOX-induced ferroptosis in human cardiomyocytes A. Cell viability of AC16 cells treated with 17-PT-PGE2 (2.5 μM) or SC-51322 (10 μM) in the presence of erastin (5 μM). *P < 0.05 vs indicated; n = 8. B. Representative flow cytometric plots showing the intracellular ROS levels in AC16 cells treated with 17-PT-PGE2 or SC-51322 in the presence of erastin. C. Quantification of ROS production in (B). *P < 0.05 vs indicated; n = 5–8. D. Western blot analysis of p-Nrf2 and total Nrf2 expression in AC16 cells treated with 17-PT-PGE2 or SC-51322in the presence of erastin. E. Quantification of relative protein expression levels in (D). *P < 0.05 as indicated; n = 4. F. Cell viability of AC16 cells treated with 17-PT-PGE2 or SC-51322 in the presence of DOX. *P < 0.05 vs indicated; n = 8. G. Representative flow cytometric plots showing the intracellular ROS levels in AC16 cells treated with 17-PT-PGE2 or SC-51322 in the presence of DOX. H. Quantification of ROS production in (G). *P < 0.05 vs indicated; n = 6. I. Western blot analysis of p-Nrf2 and total Nrf2 expression in AC16 cells treated with 17-PT-PGE2 or SC-51322 in the presence of DOX. J. Quantification of relative protein expression levels in (I). *P < 0.05 as indicated; n = 4.

References

    1. Ewer M.S., Ewer S.M. Cardiotoxicity of anticancer treatments. Nat. Rev. Cardiol. 2015;12(11):620. - PubMed
    1. Raisi-Estabragh Z., Kobo O., Freeman P., Petersen S.E., Kolman L., Miller R.J.H., Roguin A., Van Spall H.G.C., Vuong J., Yang E.H., Mamas M.A. Temporal trends in disease-specific causes of cardiovascular mortality amongst patients with cancer in the USA between 1999 and 2019. Eur Heart J Qual Care Clin Outcomes. 2022;9(1):54–63. - PMC - PubMed
    1. Singal P.K., Iliskovic N. Doxorubicin-induced cardiomyopathy. N. Engl. J. Med. 1998;339(13):900–905. - PubMed
    1. Zhang S., Liu X.B., Bawa-Khalfe T., Lu L.S., Lyu Y.L., Liu L.F., Yeh E.T.H. Identification of the molecular basis of doxorubicin-induced cardiotoxicity. Nat. Med. 2012;18(11):1639–1642. - PubMed
    1. Ichikawa Y., Ghanefar M., Bayeva M., Wu R., Khechaduri A., Naga Prasad S.V., Mutharasan R.K., Naik T.J., Ardehali H. Cardiotoxicity of doxorubicin is mediated through mitochondrial iron accumulation. J. Clin. Invest. 2014;124(2):617–630. - PMC - PubMed

Publication types

LinkOut - more resources