. 2023 Aug 10;20(4):10.1088/1741-2552/aceca1.
doi: 10.1088/1741-2552/aceca1.

The seizure severity score: a quantitative tool for comparing seizures and their response to therapy

Affiliations

The seizure severity score: a quantitative tool for comparing seizures and their response to therapy

Akash R Pattnaik et al. J Neural Eng. .

Abstract

Objective.Epilepsy is a neurological disorder characterized by recurrent seizures which vary widely in severity, from clinically silent to prolonged convulsions. Measuring severity is crucial for guiding therapy, particularly when complete control is not possible. Seizure diaries, the current standard for guiding therapy, are insensitive to the duration of events or the propagation of seizure activity across the brain. We present a quantitative seizure severity score that incorporates electroencephalography (EEG) and clinical data and demonstrate how it can guide epilepsy therapies.Approach.We collected intracranial EEG and clinical semiology data from 54 epilepsy patients who had 256 seizures during invasive, in-hospital presurgical evaluation. We applied an absolute slope algorithm to EEG recordings to identify seizing channels. From this data, we developed a seizure severity score that combines seizure duration, spread, and semiology using non-negative matrix factorization. For validation, we assessed its correlation with independent measures of epilepsy burden: seizure types, epilepsy duration, a pharmacokinetic model of medication load, and response to epilepsy surgery. We investigated the association between the seizure severity score and preictal network features.Main results.The seizure severity score augmented clinical classification by objectively delineating seizure duration and spread from recordings in available electrodes. Lower preictal medication loads were associated with higher seizure severity scores (p= 0.018, 97.5% confidence interval = [-1.242, -0.116]) and lower pre-surgical severity was associated with better surgical outcome (p= 0.042). In 85% of patients with multiple seizure types, greater preictal change from baseline was associated with higher severity.Significance.We present a quantitative measure of seizure severity that includes EEG and clinical features, validated on gold standard in-patient recordings. We provide a framework for extending our tool's utility to ambulatory EEG devices, for linking it to seizure semiology measured by wearable sensors, and as a tool to advance data-driven epilepsy care.

Keywords: epilepsy; intracranial EEG; seizure spread.


Conflict of interest statement

Conflict of interest

Erin Conrad performs consulting work for Epiminder, an EEG device company. The remaining authors have no conflicts of interest.

Figures
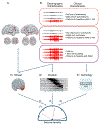
Figure 1.
Figure 1.
The seizure severity score combines quantitative seizure spread, duration, and semiology. (A) iEEG was recorded from implanted electrodes in each patient at the epilepsy monitoring unit (EMU). Red spheres overlayed on the brain surface show an example implantation for one patient. (B) We analyzed 256 seizures from 54 patients in the EMU, and characterized each seizure by seizure detections on iEEG recordings and simultaneous notes of clinical semiology. The attending neurologist documented clinical semiology in the EMU by monitoring patients during the seizure and from video-EEG recordings. (C) From the electrographic signals, we quantified seizure spread as the number of brain regions recruited during seizures by applying algorithms to quantify seizure spread and incorporating measures to correct biases due to limited iEEG sampling. (D) We quantified seizure duration from annotations that measured time elapsed from the earliest electrographic change to seizure offset and converted seizure duration on a log scale to reconcile the longest and the shortest seizure episode on a comparable scale. (E) We quantified the clinical semiology of each seizure by applying the National Hospital Seizure Severity Scale (NHS3). (F) We quantitatively combined seizure spread, duration, and semiology from panels (D)–(F) by applying non-negative matrix factorization to develop the seizure severity score.
Figure 2.
Figure 2.
Seizure severity scores highlight the variability of seizures within patients. (A) The rain cloud plot shows the distribution of severity values, which range from 0.03 to 2.3. Each point represents one seizure and example patients are highlighted in red and blue, respectively. The blue cloud shows a kernel density estimate. Panel (B) shows patient specific severity values. Patients are sorted by severity value and example patients are highlighted in red and blue, respectively. The range of seizure severity scores within each patient varied substantially (median range = 0.33, IQR = 0.79). (C) Seizure recordings of HUP162 with three labeled sub-clinical seizures (SCS). (D) Seizure recordings of HUP139 with a focal aware seizure (FAS), focal impaired aware seizure (FIAS), and a focal-to-bilateral-tonic–clonic seizure (FBTCS). Channels in red were detected as being part of the seizure and channels in black were detected as being spared from the seizure by a validated absolute slope seizure detector. (E) The median seizure severity scores within clinical seizure classification increase monotonically by clinical severity. Kruskal–Wallis test with post-hoc Dunn’s test, p < 0.05 for all pairs.
Figure 3.
Figure 3.
Seizure severity scores are sensitive to changes in disease severity and clinical response. (A) Seizure severity correlated with epilepsy duration (one-tailed Spearman’s r = 0.23, p = 0.049). Individual points represent patients. Linear regression line and 95% confidence interval are shown in black and gray. (B) A linear mixed effects model was fit with anti-seizure medication (ASM) as the covariate, patient as the random effect, and seizure severity score as the response variable. Lower ASM loads were associated with more severe seizures (p = 0.018, 97.5% confidence interval = [ −1.242, −0.116]). The thick purple line shows the fixed effects intercept and slope, and the thin purple lines show each patient’s random intercept. Individual data points represent each seizure and are plotted in gray. (C) Poor outcome patients are associated with more severe seizures in the EMU than good outcome patients. The most severe seizure within each patient was used to measure patient-level severity (Mann–Whitney U = 264, Cohen’s d = 0.46, p = 0.04).
Figure 4.
Figure 4.
Deviations in preictal iEEG network node strength from baseline are associated with seizure severity within patients. (A) A linear mixed effects model was fit with preictal bivariate features as the covariate, patient as the random effect, and seizure severity score as the response variable. At the group level, there was a significant positive association between preictal deviation in node strength and seizure severity (p = 0.034, 97.5% confidence interval = [0.013, 0.352]). The thick dashed line shows the fixed effects intercept and slope, and the thin lines show each patient’s random intercept and slope. Individual data points represent each seizure and are plotted in gray. (B) Electrode-level features from the patient with the largest positive slope (red) show increasing z-score as severity increases. Boxplots summarize electrode-level features and seizures are sorted by increasing severity. Each overlayed dot represents the preictal z-score for one electrode. (C) Same layout as (B) for the patient with the largest negative slope (blue) and decreasing z-score as severity increases.

References

    1. Kwan P, Schachter SC and Brodie MJ 2011. Drug-resistant epilepsy New Engl. J. Med 365 919–26 - PubMed
    1. Cook MJ et al. 2013. Prediction of seizure likelihood with a long-term, implanted seizure advisory system in patients with drug-resistant epilepsy: a first-in-man study Lancet Neurol. 12 563–71 - PubMed
    1. Fisher RS, Blum DE, DiVentura B, Vannest J, Hixson JD, Moss R, Herman ST, Fureman BE and French JA 2012. Seizure diaries for clinical research and practice: limitations and future prospects Epilepsy Behav. 24 304–10 - PubMed
    1. Haut SR, Hall CB, LeValley AJ and Lipton RB 2007. Can patients with epilepsy predict their seizures? Neurology 68 262–6 - PubMed
    1. Szaflarski M, Meckler JM, Privitera MD and Szaflarski JP 2006. Quality of life in medication-resistant epilepsy: the effects of patient’s age, age at seizure onset, and disease duration Epilepsy Behav. 8 547–51 - PubMed

Publication types