. 2023 Sep 1;20(4):046044.
doi: 10.1088/1741-2552/aceca5.

Aberrant accumulation of age- and disease-associated factors following neural probe implantation in a mouse model of Alzheimer's disease

Affiliations

Aberrant accumulation of age- and disease-associated factors following neural probe implantation in a mouse model of Alzheimer's disease

Steven M Wellman et al. J Neural Eng. .

Abstract

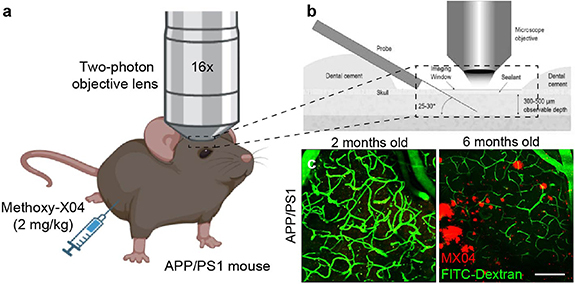
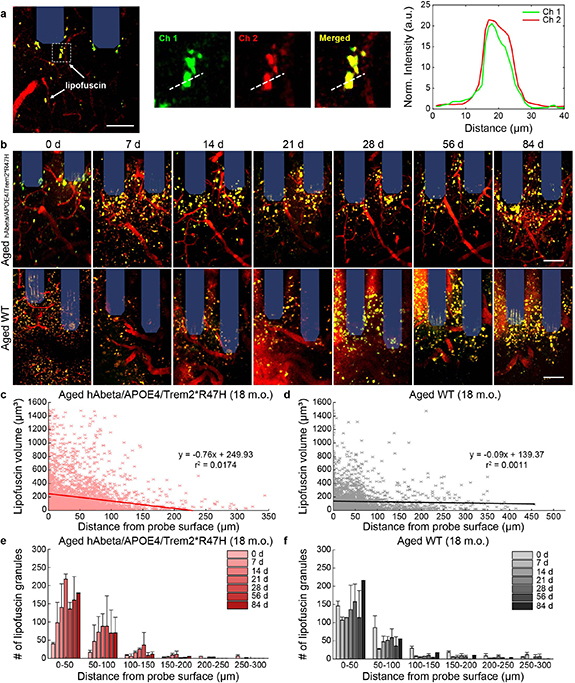
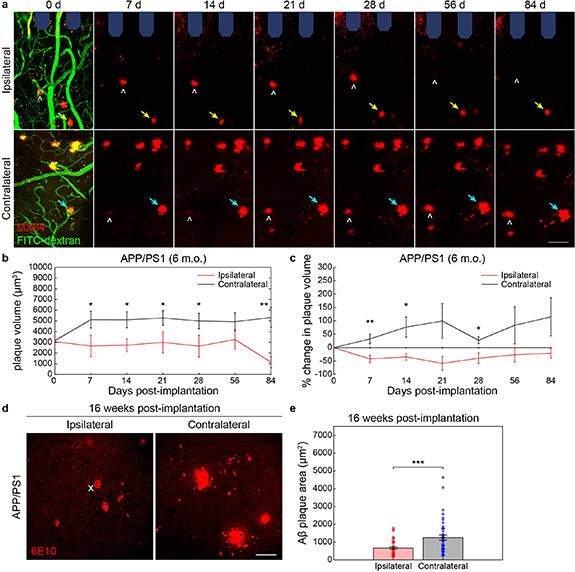
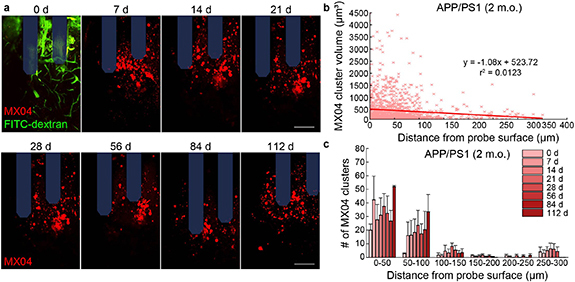
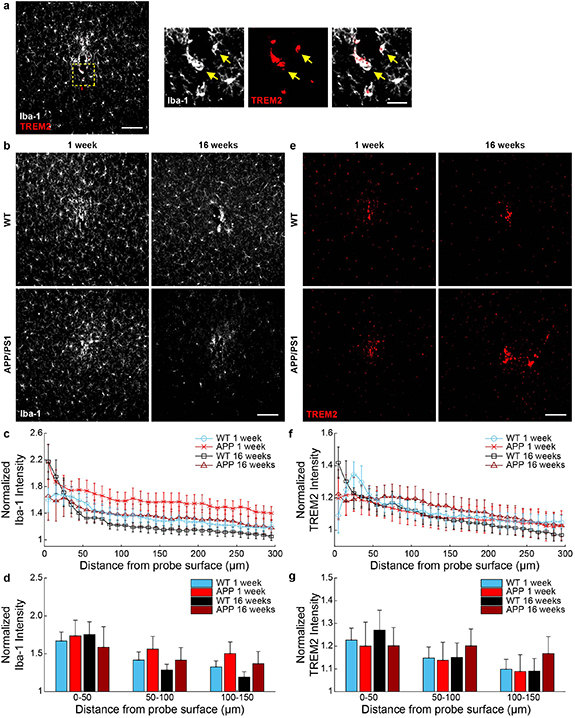
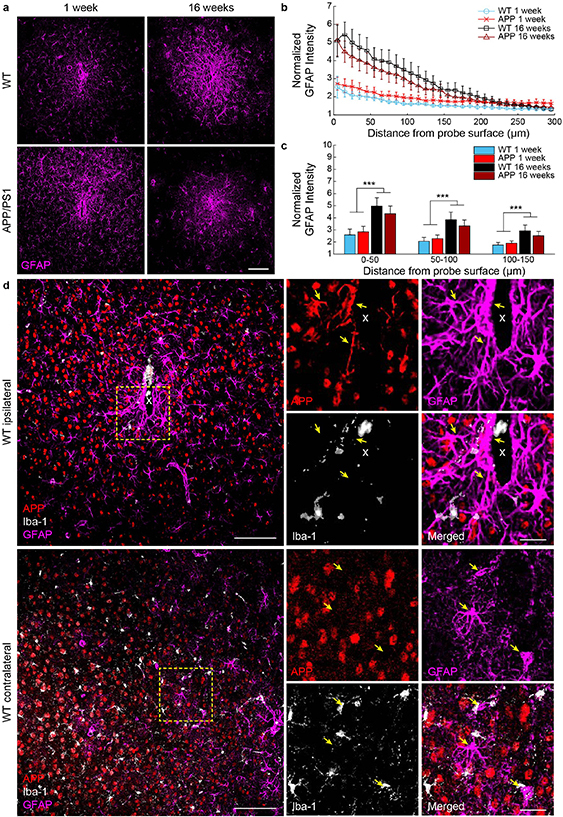
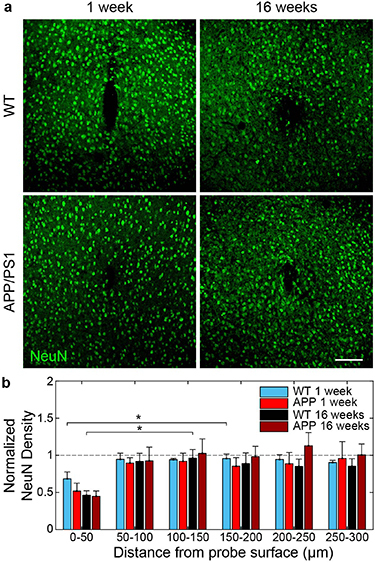
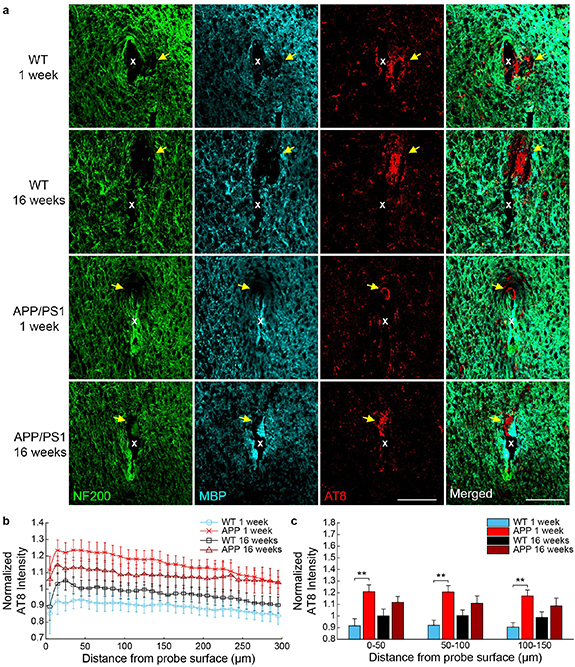
Objective. Electrical stimulation has had a profound impact on our current understanding of nervous system physiology and provided viable clinical options for addressing neurological dysfunction within the brain. Unfortunately, the brain's immune suppression of indwelling microelectrodes currently presents a major roadblock in the long-term application of neural recording and stimulating devices. In some ways, brain trauma induced by penetrating microelectrodes produces similar neuropathology as debilitating brain diseases, such as Alzheimer's disease (AD), while also suffering from end-stage neuron loss and tissue degeneration. The goal of the present study was to understand whether there may be any parallel mechanisms at play between brain injury from chronic microelectrode implantation and those of neurodegenerative disorder.Approach. We used two-photon microscopy to visualize the accumulation, if any, of age- and disease-associated factors around chronically implanted electrodes in both young and aged mouse models of AD.Main results. We determined that electrode injury leads to aberrant accumulation of lipofuscin, an age-related pigment, in wild-type and AD mice alike. Furthermore, we reveal that chronic microelectrode implantation reduces the growth of pre-existing Alzheimer's plaques while simultaneously elevating amyloid burden at the electrode-tissue interface. Lastly, we uncover novel spatial and temporal patterns of glial reactivity, axonal and myelin pathology, and neurodegeneration related to neurodegenerative disease around chronically implanted microelectrodes.Significance. This study offers multiple novel perspectives on the possible neurodegenerative mechanisms afflicting chronic brain implants, spurring new potential avenues of neuroscience investigation and design of more targeted therapies for improving neural device biocompatibility and treatment of degenerative brain disease.

Keywords: amyloid beta; foreign body response; lysosome; metabolism; neural interfaces; tauopathy.


Figures

Figure 1.
Figure 1.
Two-photon visualization of age- and disease-related factors in a mouse model of Alzheimer’s disease. (a) Methoxy-X04 (2 mg kg−1) was administered to APP/PS1 mice in order to visualize Alzheimer’s plaque deposition within the mouse brain using two-photon microscopy. (b) Schematic of microelectrode implantation within the mouse cortex underneath an optical window for longitudinal imaging of chronic tissue response. (c) Representative two-photon image demonstrating age-dependency of plaque visualization (MX04, red) in APP/PS1 mice. Vasculature is labeled with FITC-dextran (green). Scale bar = 100 μm.
Figure 2.
Figure 2.
Lipofuscin accumulation around chronically implanted microelectrodes in aged WT and hAbeta/APOE4/Trem2*R47H mice. (a) Example two-photon image of lipofuscin signal detected across multiple wavelength emission filters. Lipofuscin can be detected by a 1:1 fluorescence intensity overlap in both red and green filtered channels. (b) Representative two-photon images of accumulated lipofuscin granules (yellow) around multi-shank microelectrode array (shaded blue) over 12 week post-implantation in aged (18 m.o.) WT and hAbeta/APOE4/Trem2*R47H mice. Scale bars = 50 μm. (c)–(d) Scatter plots demonstrating trend in volume of lipofuscin granules with respect to distance from probe surface (aged hAbeta/APOE4/Trem2*R47H: 3173 lipofuscin granules across seven timepoints; aged WT: 2757 lipofuscin granules across seven timepoints). (e)–(f) Average number of lipofuscin granules with binned distance from the probe in aged hAbeta/APOE4/Trem2*R47H and WT mice (n = 2 mice per group). All data is reported as mean ± SEM.
Figure 3.
Figure 3.
Chronic microelectrode implantation reduces the growth of local amyloid plaques in adult APP/PS1 mice. (a) Representative two-photon images of methoxy-X04 labeled plaques (MX04, red) and blood vessels (FITC-dextran, green) in ipsilateral hemisphere around multi-shank microelectrode array (shaded blue) over 12 weeks post-implantation in adult (6 m.o.) APP/PS1 mice compared to contralateral (uninjured) hemisphere. Ipsilateral hemisphere demonstrates plaques which do not visually change in size with chronic implantation (yellow arrow) whereas plaques on the contralateral hemisphere appear to increase in size over time (cyan arrow). NOTE: some plaques move into and out of frame over time (white hat) due to tissue drift between subsequent chronic imaging sessions. Scale bar = 50 μm. (b) Change in plaque volume over a 12 week implantation period between ipsilateral and contralateral hemispheres in adult APP/PS1 mice (25 Aβ plaques on ipsilateral hemisphere and 27 plaques on contralateral hemisphere tracked longitudinally over seven time points across n= 3 mice). (c) Percent change in plaque volume with respect to plaque size on day 0 of electrode insertion over a 12 week implantation period between ipsilateral and contralateral hemispheres in adult APP/PS1 mice. (d) Representative immunohistology stain for 6E10, an Aβ marker, following 16 weeks post-implantation in adult (6 m.o.) APP/PS1 mice demonstrating visually reduced Aβ plaque sizes in ipsilateral hemisphere around the site of probe insertion (denoted by white ‘x’) compared to contralateral side. Scale bar = 100 μm. (e) Average Aβ plaque area measured by 6E10 stain between ipsilateral and contralateral hemispheres (n= 42 Aβ plaques on ipsilateral hemisphere over 13 histological tissue sections and n = 45 Aβ plaques on contralateral hemisphere over 17 histological sections across 6 mice total). * p < 0.05, ** p < 0.01, *** p < 0.001. All data is reported as mean ± SEM.
Figure 4.
Figure 4.
Accumulation of amyloid clusters around chronically implanted microelectrodes in young APP/PS1 mice. (a) Representative two-photon images of methoxy-X04 labeled clusters (MX04, red) and blood vessels (FITC-dextran, green) around multi-shank microelectrode array (shaded blue) over 16 weeks post-implantation in young (2 m.o.) APP/PS1 mice. Scale bars = 50 μm. (b) Scatter plot demonstrating a trend in increased volume of MX04 clusters with respect to distance from probe surface (1407 MX04 clusters across seven timepoints). (c) Average number of MX04 clusters with binned distance from the probe in young APP/PS1 mice (n = 3). All data is reported as mean ± SEM.
Figure 5.
Figure 5.
Microglial expression of phagocytic receptors around chronically implanted microelectrodes at 1 and 16 weeks post-implantation in WT and APP/PS1 mice. (a) Immunohistological representation demonstrating co-localization of Iba-1 + microglia (white) with triggering receptor expressed on myeloid cells 2 (TREM2, red) around the site of electrode implantation (yellow arrows). Scale bar = 100 μm, 10 μm (inset). (b) Representative images of Iba-1 fluorescence staining around implanted microelectrodes. Scale bar = 100 μm. (c) Normalized Iba-1 fluorescence intensity with respect to distance from microelectrodes. (d) Average Iba-1 fluorescence intensity within 50 μm bins up to 150 μm around chronically implanted microelectrodes. (e) Representative images of TREM2 fluorescence staining around implanted microelectrodes. Scale bar = 100 μm. (f) Normalized TREM2 fluorescence intensity with respect to distance from microelectrodes. (g) Average TREM2 fluorescence intensity within 50 μm bins up to 150 μm around microelectrodes (n = 6 mice per group at 1 week, n = 7 mice per group at 16 weeks). All data is reported as mean ± SEM.
Figure 6.
Figure 6.
Reactive astrocytes express amyloid precursor protein around chronically implanted microelectrode arrays at 1 and 16 weeks post-implantation in WT and APP/PS1 mice. (a) Representative images of GFAP+ reactive astrocyte staining (magenta) around implanted microelectrodes. Scale bar = 100 μm. (b) Normalized GFAP fluorescence intensity with respect to distance from the implanted microelectrode. (c) Average GFAP fluorescence intensity within 50 μm bins up to 150 μm around chronically implanted microelectrodes (n= 6 mice per group at 1 week, n= 7 mice per group at 16 weeks). (d) Immunohistological example demonstrating expression of amyloid precursor protein (APP, red) in GFAP+ astrocytes (magenta) but not Iba-1 + microglia (white) on the ipsilateral, but not contralateral hemisphere, near the site of a chronically implanted microelectrode in a WT mouse. Scale bar = 100 μm, 25 μm (inset). *** p < 0.001. All data is reported as mean ± SEM.
Figure 7.
Figure 7.
Reduced neuronal densities near chronically implanted microelectrodes at 1 and 16 weeks post-implantation in WT and APP/PS1 mice. (a) Histological representation of neurons (NeuN, green) around chronically implanted microelectrodes. Scale bar = 100 μm. (b) Average NeuN density within 50 μm bins up to 300 μm around chronically implanted microelectrodes (n= 6 mice per group at 1 week, n= 7 mice per group at 16 weeks). * p < 0.05. All data is reported as mean ± SEM.
Figure 8.
Figure 8.
Axon and myelin pathology is associated with abnormal tau phosphorylation around chronically implanted microelectrodes at 1 and 16 weeks post-implantation in WT and APP/PS1 mice. (a) Immunostaining for axons (NF200, green), myelin (MBP, cyan), and phospho-tau (AT8, red) reveals abnormal tau phosphorylation in areas of axon and myelin loss (yellow arrows) around 1 and 16 week implanted probes (white ‘x’) in WT and APP/PS1 mice. Scaler bar = 100 μm. (b) Normalized AT8 fluorescence intensity with respect to distance around chronically implanted microelectrodes. (c) Average AT8 fluorescence intensity within 50 μm bins up to 150 μm around chronically implanted microelectrodes (n = 6 mice per group at 1 week, n = 7 mice per group at 16 weeks). ** p < 0.01. All data is reported as mean ± SEM.

Update of

References

    1. Schwartz A B, Cui X T, Weber D J, Moran D W. Brain-controlled interfaces: movement restoration with neural prosthetics. Neuron. 2006;52:205–20. doi: 10.1016/j.neuron.2006.09.019. - DOI - PubMed
    1. Flesher S N, Collinger J L, Foldes S T, Weiss J M, Downey J E, Tyler-Kabara E C, Bensmaia S J, Schwartz A B, Boninger M L, Gaunt R A. Intracortical microstimulation of human somatosensory cortex. Sci. Trans. Med. 2016;8:361ra141. doi: 10.1126/scitranslmed.aaf8083. - DOI - PubMed
    1. Hughes C L, Flesher S N, Weiss J M, Boninger M, Collinger J L, Gaunt R A. Perception of microstimulation frequency in human somatosensory cortex. Elife. 2021;10:e65128. doi: 10.7554/eLife.65128. - DOI - PMC - PubMed
    1. Kozai T D, Jaquins-Gerstl A S, Vazquez A L, Michael A C, Cui X T. Brain tissue responses to neural implants impact signal sensitivity and intervention strategies. ACS Chem. Neurosci. 2015;6:48–67. doi: 10.1021/cn500256e. - DOI - PMC - PubMed
    1. Michelson N J, Vazquez A L, Eles J R, Salatino J W, Purcell E K, Williams J J, Cui X T, Kozai T D Y. Multi-scale, multi-modal analysis uncovers complex relationship at the brain tissue-implant neural interface: new emphasis on the biological interface. J. Neural Eng. 2018;15:033001. doi: 10.1088/1741-2552/aa9dae. - DOI - PMC - PubMed

Publication types