. 2023 Oct 19;30(10):1235-1247.e6.
doi: 10.1016/j.chembiol.2023.07.001. Epub 2023 Aug 1.

Small molecule targeting of transcription-replication conflict for selective chemotherapy

Affiliations

Small molecule targeting of transcription-replication conflict for selective chemotherapy

Long Gu et al. Cell Chem Biol. .

Abstract

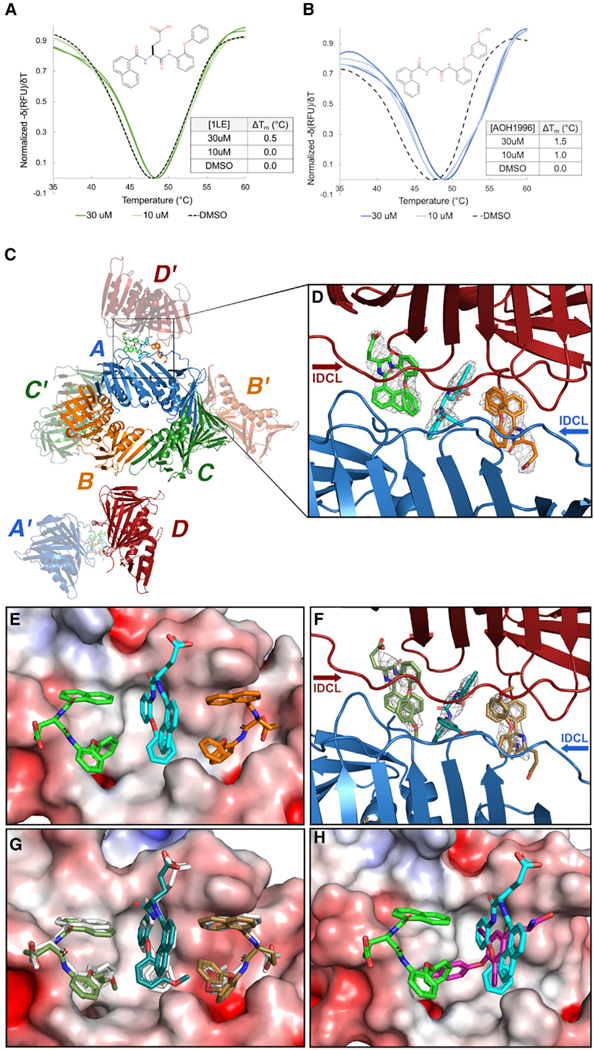
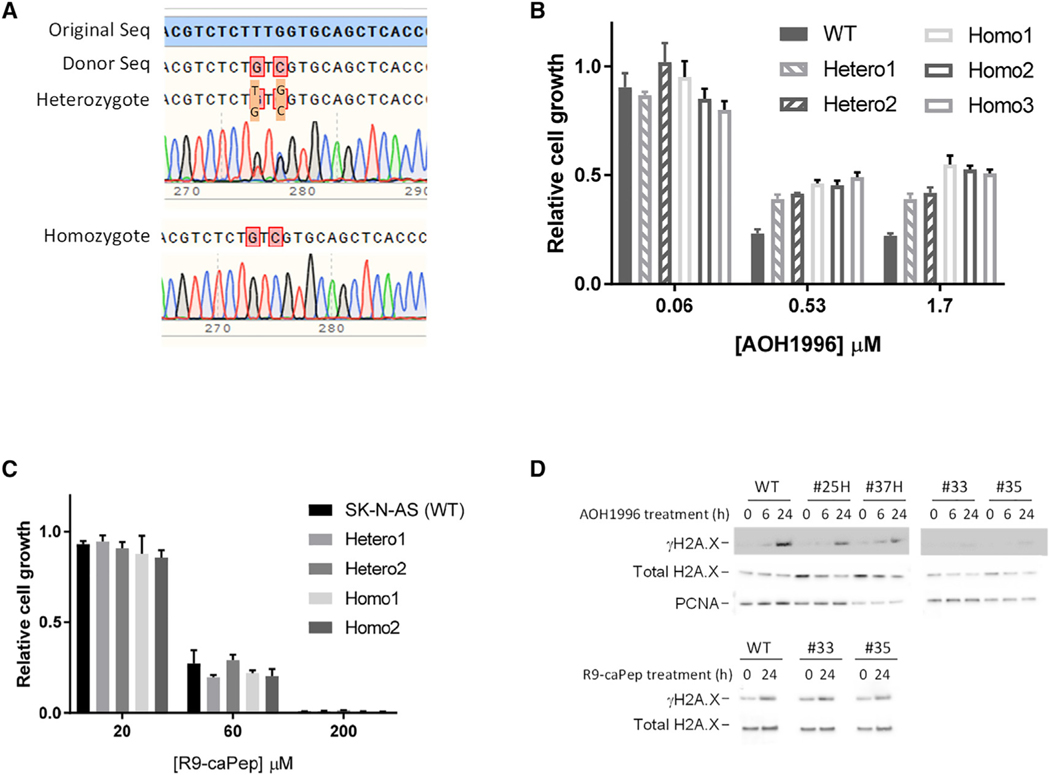
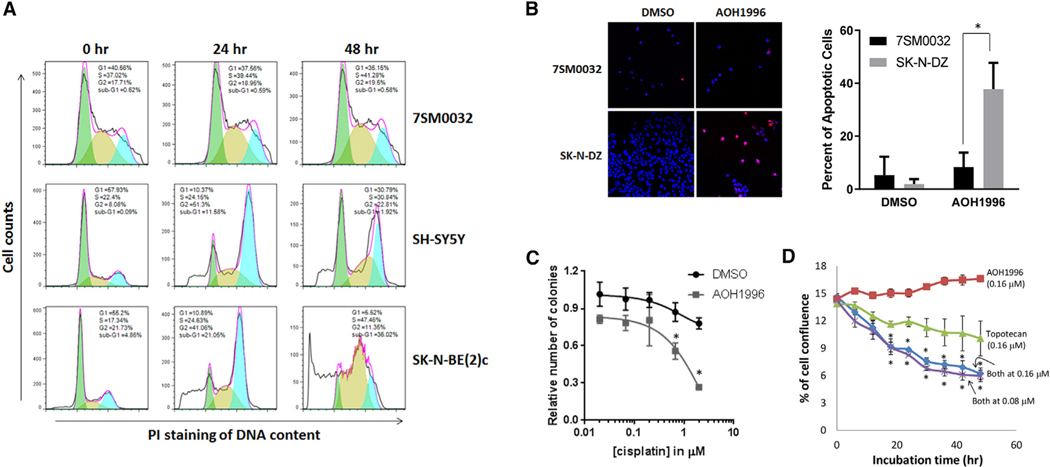
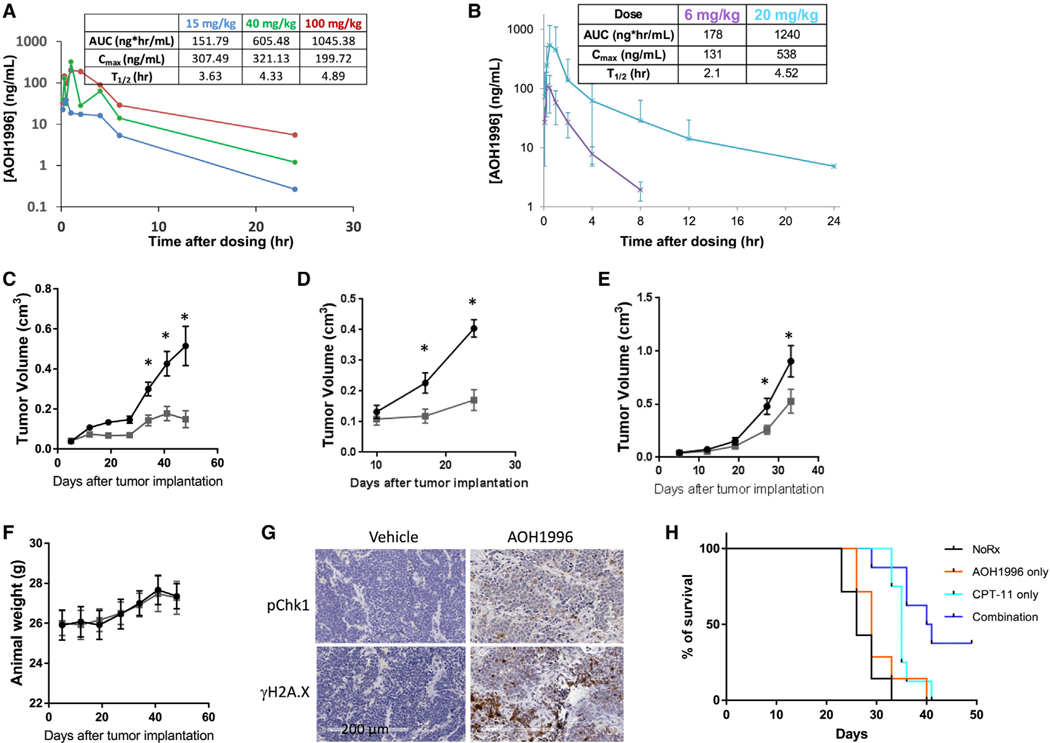
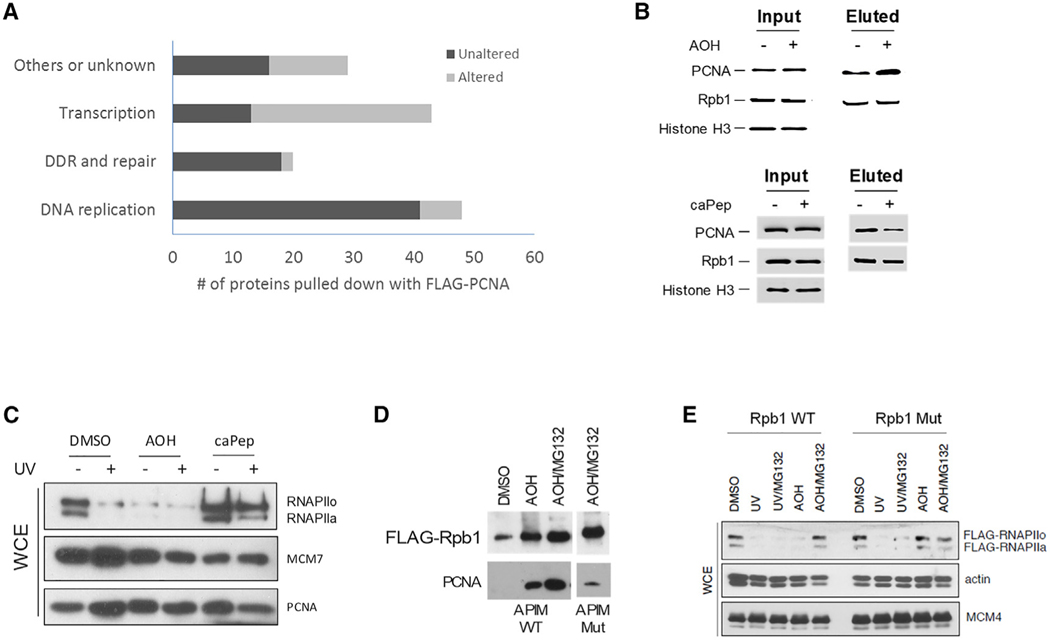
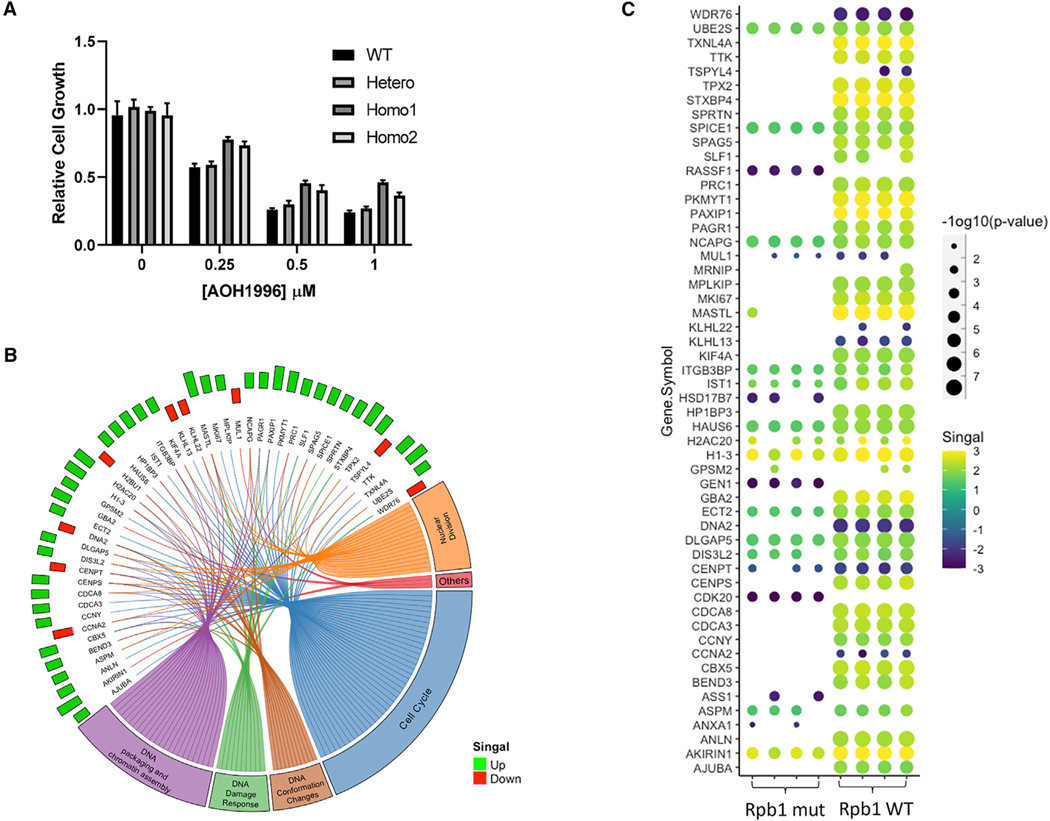
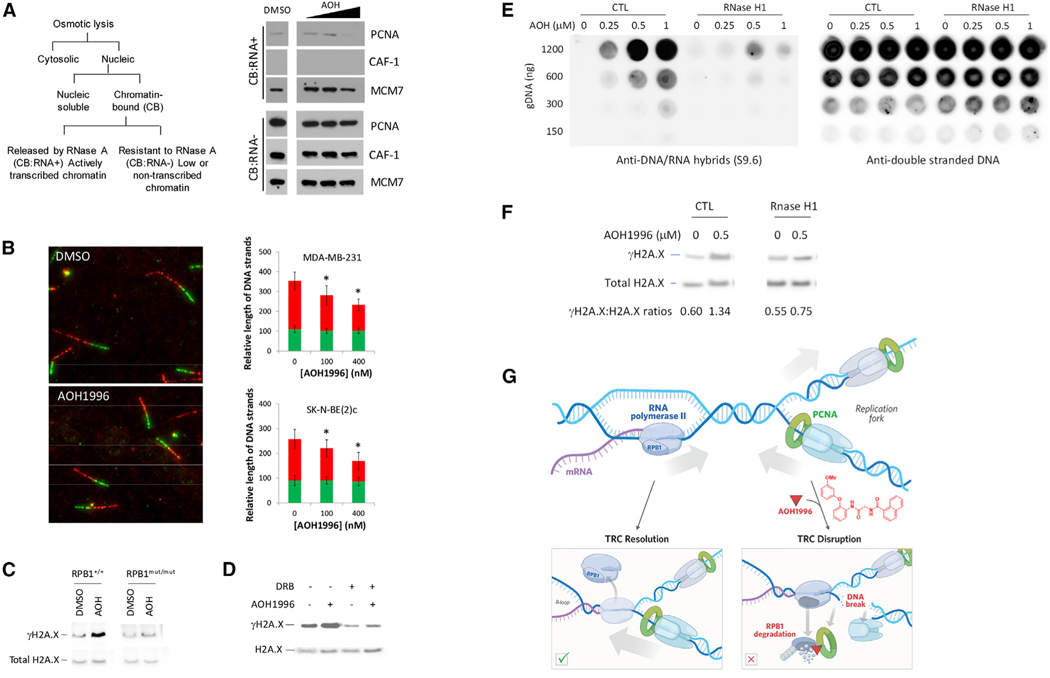
Targeting transcription replication conflicts, a major source of endogenous DNA double-stranded breaks and genomic instability could have important anticancer therapeutic implications. Proliferating cell nuclear antigen (PCNA) is critical to DNA replication and repair processes. Through a rational drug design approach, we identified a small molecule PCNA inhibitor, AOH1996, which selectively kills cancer cells. AOH1996 enhances the interaction between PCNA and the largest subunit of RNA polymerase II, RPB1, and dissociates PCNA from actively transcribed chromatin regions, while inducing DNA double-stranded breaks in a transcription-dependent manner. Attenuation of RPB1 interaction with PCNA, by a point mutation in RPB1's PCNA-binding region, confers resistance to AOH1996. Orally administrable and metabolically stable, AOH1996 suppresses tumor growth as a monotherapy or as a combination treatment but causes no discernable side effects. Inhibitors of transcription replication conflict resolution may provide a new and unique therapeutic avenue for exploiting this cancer-selective vulnerability.

Keywords: DNA repair; DNA replication stress; PCNA; transcription-replication conflict.


Conflict of interest statement

Declaration of interests The authors declare the following competing financial interest(s): City of Hope’s Office of Technology Licensing has been awarded a patent on AOH1996 and its analogs. L.H. Malkas, R.J. Hickey, D. Horne, and L. Gu are listed as inventors.

Figures

Figure 1.
Figure 1.. AOH1160 analog interactions with PCNA
(A) Thermal shift assay: Normalized inverse derivative thermal denaturation plots of 9 μM apo-PCNA with DMSO control is depicted with a black dashed line and PCNA; in the presence of 10 μM AOH1160–1LE is shown in light green; and 30 μM AOH1160–1LE is shown in dark green. ΔTm values are provided. (B) As described in A, in the presence of 10 μM AOH1996 is depicted in cyan and 30 μM AOH1996 is depicted in blue. (C) Four monomers (chains A–D) of PCNA are presentin the asymmetric unit of the crystal. Chains A, B, and C form the homotrimer planar biological unit, while chain D is orientated perpendicular to, and below the plane of, the ring between chains B and C. Chain D belongs to an adjacent PCNA ring structure. (D) Three molecules of AOH1160–1LE bind in and adjacent to the PIP box cavity of each of the PCNA ring subunits. The OMIT map, gray mesh, is contoured to 1.5σ. Two PCNA monomer subunits from adjacent rings stack against each other, placing the PIP box and IDCLs of each subunit in opposing directions. (E) The three AOH1160–1LE molecules, with carbon atom colored in green, cyan (central compound) and orange, are shown as stick figure representations. Two of the compounds, in green and cyan, bind into the PIP box cavity at known PCNA-partner/compound interaction sites. (F) Three molecules of AOH1996–1LE also bind in and adjacent to the PIP box cavity of each of the PCNA ring subunits. The OMIT map, gray mesh, is contoured to 1.5σ. (G) Superimposition of the PCNA:AOH1160–1LE and the PCNA:AOH1996–1LE complexes, centered on the PIP box cavity, with AOH1160–1LE molecules colored in white. (H) Superimposition of the PCNA:T2AA and the PCNA:AOH1160–1LE complexes, centered on the PIP box cavity, with T2AA carbons colored in magenta. The electrostatic surface maps are depicted with Poisson-Boltzmann electrostatic surface potentials shown in red and blue, corresponding to −5 to +5 kT/e respectively.
Figure 2.
Figure 2.. Interaction of AOH1996 with PCNA
(A) The PCNA gene was mutated using CRISPR, resulting in codon substitution of the Leucine 47 residue to a Valine. Shown are the DNA sequencing results of cell lines heterozygous or homozygous for the mutated gene. (B and C) Cell lines heterozygous or homozygous for the mutated PCNA gene were treated by the indicated concentrations of AOH1996 or R9-caPep, respectively, for 72 h. The unmodified parent SK-N-AS cells were used as a control. Relative cell growth in triplicate was averaged and graphed ±S.D. (D) Expression of γH2A.X was determined by quantification of Western blots utilizing cell lines heterozygous (#25H and #37H) or homozygous (#33 and #35) for the mutated PCNA allele after cells were treated by 500 nM AOH1996 or 30 μM R9-caPep for the times indicated.
Figure 3.
Figure 3.. Therapeutic properties of AOH1996
(A) Normal neural crest stem cells (7SM0032) or cancer cells (SH-SY5Y and SK-N-BE(2)c) cells were fixed, stained with PI, and analyzed by flow cytometry following treatment with 500 nM AOH1996 for the indicated time. (B) SK-N-DZ neuroblastoma cells and nonmalignant 7SM0032 stem cells were incubated with 500 nM AOH1996 for 24 h. Then, after being fixed on slides, cell apoptosis was analyzed by a TUNEL assay. Left: TMR fluorophore (red) attached to the free ends of DNA indicates cells undergoing apoptosis. Blue indicates DAPI stained nuclei. Right: Average abundance ±S.D. of apoptotic 7SM0032 (black histogram) and SK-N-DZ (gray histogram) cells relative to the total number of cells are shown in 5 randomly selected fields. *p < 0.01. (C) Human SK-N-DZ neuroblastoma cells were treated for 18 h with or without the indicated concentrations of cisplatin in the absence or presence of 500 nM AOH1996. Cells were washed twice with growth medium and cultured in fresh media for 18 days to allow colony formation. The colony counts in dishes treated with cisplatin but not AOH1996 (black) were normalized to the colony counts in dishes untreated by either agent. The colony counts in dishes treated by both cisplatin and AOH1996 (gray) were normalized to the colony counts in dishes treated with 500 nM AOH1996 alone. The relative number of colonies determined in triplicates for each treatment condition were averaged and graphed ± SDs (*p < 0.01). (D) SK-N-AS cells were treated with the indicated concentrations of AOH1996, topotecan, or both agents in combination. Cell growth was measured as the percentage of cell confluence by imaging every 6 h for a total of 48 h. Percent of cell confluences was averaged and graphed ± SDs. *p < 0.01 in comparison with cells treated with either single agent.
Figure 4.
Figure 4.. Pharmacokinetics and anti-tumor growth activity of AOH1996 in vivo
(A) After oral administration, the plasma concentrations of AOH1996 from three male and three female ES1e/SCID mice at the indicated time points were averaged and graphed ±S.D. The inset contains PK parameters determined by a standard non-compartmental method. (B) A similar PK study of AOH1996 was performed in dogs. (C–E) ES1e/SCID mice bearing the xenograft tumors of neuroblastoma (C: SK-N-BE(2)c), breast cancer (D: MDA-MB-468), and small-cell lung cancer (E: H82) were given vehicle only (black) or 40 mg/kg of AOH1996 (gray) twice daily immediately after the first measurement. Tumor sizes were measured by a dial caliper each week. Tumor volumes (0.4 3 L × W2) were averaged and graphed ± S.E. (*, p < 0.01). (F) Animal body weight was monitored throughout the studies as an indicator of toxicity. Shown are typical study results (average ± S.E.) from the study of the SK-N-BE(2)c tumor model described in (C). (G) The levels of phosphor-Chk1 (pChk1) and γH2A.X in SK-N-BE(2)c derived tumor samples were analyzed by IHC. Shown are representative images taken from tumors treated by vehicle only or by 40 mg/kg AOH1996. (H) ES1e/SCID mice bearing SK-N-AS derived xenograft tumors were treated with either 80 mg/kg of AOH1996 (black, n = 7) for 8 days beginning 8 days after tumor implantation, 15 mg/kg of CPT-11 (n = 8) for 3 days beginning 12 days after tumor implantation, or both agents (combination, n = 8) under the same dosages and schedules as they were dosed alone. Mice implanted with the same tumor and left untreated were used as control (n = 8). Shown are the survival graphs. The p values determined by the Log rank (Mantel-Cox) test between combination treatment and each of the control groups are p = 0.0003 (Combination vs. NoRx), p = 0.005 (Combination vs. AOH1996 alone), and p = 0.024 (Combination vs. CPT-11 alone).
Figure 5.
Figure 5.. Modulation of PCNA interaction with RNA polymerase II
(A) Chromatin-bound (CB) proteins were fractioned from HEK293T cells expressing FLAG-tagged PCNA after the cells were treated with or without 500 nM AOH1996. Proteins in complex with FLAG-PCNA were immune-precipitated and analyzed by mass spectrometry. Shown are numbers of proteins whose abundances were unaltered (black) or altered (gray) by more than 2-fold following AOH1996 treatment. (B) SK-N-AS cells exogenously expressing an FLAG-tagged RPB1 gene were fractioned prior to, and after, being treated overnight with 500 nM AOH1996. PCNA in complex with chromatin-bound (CB) FLAG-RBP1 was analyzed by Western blotting. (C) Human SK-N-AS cells were treated with UV in the presence or absence of AOH1996 (AOH) or R9-caPep (caPep). Whole cell extracts were analyzed by Western blotting. (D) Cells exogenously expressing FLAG-tagged wildtype RPB1 or FLAG-tagged APIM-mutant RPB1 gene were fractioned. PCNA in complex with chromatin-bound (CB) FLAG-RBP1 was analyzed by Western blotting. (E) HEK293T cells were transiently transfected with an FLAG-tagged wildtype RPB1 (APIM WT) gene or mutant RPB1 gene (APIM mutant). The intracellular MCM7 and RBP1 (both the hypo-phosphorylated RNAPIIa and hyper-phosphorylated RNAPIIo forms) was analyzed by Western blotting after cells were treated by the indicated agents and/or UV.
Figure 6.
Figure 6.. The effect of AOH1996 is mediated through PCNA interaction with RPB1
(A) Cell lines heterozygous or homozygous for the APIM-mutant RPB1 gene were treated for 72 h with the indicated concentrations of AOH1996. The parent SK-N-AS cells were used as control. Relative cell growth in triplicate was averaged and graphed ±S.D. (B) Whole cell proteome from SK-N-AS cells homozygous for the APIM-mutant RPB1 gene was analyzed by mass spectrometry before and after the cells were treated overnight in quadruplicate with 500 nM AOH1996. To average out any clonal differences unrelated to the RPB1 mutation, the quadruplicated samples were derived from 2 independent RPB1 mutant clones. The unmodified parent SK-N-AS cells in quadruplicates were used as the control. The enrichment of proteins in cells of either genotype, whose expression was altered by AOH1996 treatment by at least 2-fold, and exhibited a p value less than 0.05, was analyzed by MetaCore’s gene ontology program, (Clarivate Analytics, Philadelphia, PA). Shown in the Cricos diagram are the enriched GO processes these proteins associated with and the average fold change of their expression induced by AOH1996 treatment. (C) The fold change in the expression of the proteins identified in B was calculated for each AOH1996-treated sample, relative to the average expression level inthe corresponding untreated cells and then visualized in the dot plot heatmap. Also shown in the dot plot heatmap is the statistical significance expressed in −log10(p value) between treated and untreated samples of the same genotype.
Figure 7.
Figure 7.. Transcription dependent effect on DNA replication and damage
(A) Left: Schematic of the cell fractionation procedure. Right: MDA-MB-468 cells were treated with increasing concentrations of AOH1996 (5, 50, or 500 nM) for24 h. Cells treated with only the equivalent concentration of DMSO were used as the control. Whole cell extract (WCE) and protein fractions associated with actively transcribed chromatin (CB:RNA+) or with low or non-transcribed chromatin (CB:RNA-) were analyzed by Western blot using antibodies against PCNA, CAF-1, and MCM7. (B) Synchronized cancer cells by serum starvation were sequentially incubated in the presence of CldU (green) and IdU (red) before and after AOH1996 treatment, respectively. Cells sequentially incubated with the same two nucleotide analogs but without AOH1996 were used as the control. Left: Representative images of labeled DNA strands from untreated cells or cells treated with AOH1996. Middle and Right: Lengths of CldU (green) and IdU (red) incorporated DNA segments measured for more than 30 independent DNA strands from the indicated cancer cell type were averaged and graphed ±S.D. *p < 0.01 in comparison with the corresponding samples untreated by AOH1996. (C) Whole cell lysates were extracted from SK-N-AS cells homozygous for the wildtype RPB1 allele or the APIM-mutant allele. Histone H2A.X and γH2A.X was analyzed by Western blot following overnight incubation with AOH1996 in DMSO or with just DMSO, which served as the control. t. (D) Histone H2A.X and gH2A.X in whole cell lysates from SK-N-AS cells were analyzed by Western blot after treatment with 500 μM AOH1996 and/or 50 mM DRB overnight. (E) SK-N-AS cells were transiently transfected with a plasmid expressing the human RNase H1 gene. Cells transfected with an empty vector were used as control(CTL). Left panel: R-loop levels in genomic DNAs extracted from cells treated by AOH1996 at the indicated concentration were analyzed by dot blotting with S9.6 antibody, Right panel: Double-stranded DNA levels of the same samples were measured by an antibody specific to double-stranded DNAs. (F) The histone H2A.X and gH2A.X levels in SK-N-AS cells transiently transfected by the RNase H1 expression plasmid or an empty vector were measured byWestern blot before and 24 h after AOH1996 treatment. (G) A working model of the mechanism of action of AOH1996: binding of AOH1996 to PCNA stabilizes PCNA interaction with RNA polymerase II and interferes with TRC resolution leading to dissociation of PCNA from chromatin in a transcription dependent manner. By exploiting this cancer vulnerability, AOH1996 selectively inhibits tumor growth without causing any discernible side effect.

References

    1. Krishna TS, Kong XP, Gary S, Burgers PM, and Kuriyan J. (1994). Crystal structure of the eukaryotic DNA polymerase processivity factor PCNA. Cell 79, 1233–1243. - PubMed
    1. Tsutakawa SE, Van Wynsberghe AW, Freudenthal BD, Weinacht CP, Gakhar L, Washington MT, Zhuang Z, Tainer JA, and Ivanov I. (2011). Solution X-ray scattering combined with computational modeling reveals multiple conformations of covalently bound ubiquitin on PCNA. Proc. Natl. Acad. Sci. USA 108, 17672–17677. - PMC - PubMed
    1. Tsutakawa SE, Yan C, Xu X, Weinacht CP, Freudenthal BD, Yang K, Zhuang Z, Washington MT, Tainer JA, and Ivanov I. (2015). Structurally distinct ubiquitin- and sumo-modified PCNA: implications for their distinct roles in the DNA damage response. Structure 23, 724–733. - PMC - PubMed
    1. Chapados BR, Hosfield DJ, Han S, Qiu J, Yelent B, Shen B, and Tainer JA (2004). Structural basis for FEN-1 substrate specificity and PCNA-mediated activation in DNA replication and repair. Cell 116, 39–50. - PubMed
    1. Sebesta M, Cooper CDO, Ariza A, Carnie CJ, and Ahel D. (2017). Structural insights into the function of ZRANB3 in replication stress response. Nat. Commun 8, 15847. - PMC - PubMed

Publication types

LinkOut - more resources