. 2023 Sep;10(9):668-681.
doi: 10.1016/S2215-0366(23)00193-1. Epub 2023 Jul 30.

Age of onset and cumulative risk of mental disorders: a cross-national analysis of population surveys from 29 countries

Collaborators, Affiliations

Age of onset and cumulative risk of mental disorders: a cross-national analysis of population surveys from 29 countries

John J McGrath et al. Lancet Psychiatry. 2023 Sep.

Abstract

Background: Information on the frequency and timing of mental disorder onsets across the lifespan is of fundamental importance for public health planning. Broad, cross-national estimates of this information from coordinated general population surveys were last updated in 2007. We aimed to provide updated and improved estimates of age-of-onset distributions, lifetime prevalence, and morbid risk.

Methods: In this cross-national analysis, we analysed data from respondents aged 18 years or older to the World Mental Health surveys, a coordinated series of cross-sectional, face-to-face community epidemiological surveys administered between 2001 and 2022. In the surveys, the WHO Composite International Diagnostic Interview, a fully structured psychiatric diagnostic interview, was used to assess age of onset, lifetime prevalence, and morbid risk of 13 DSM-IV mental disorders until age 75 years across surveys by sex. We did not assess ethnicity. The surveys were geographically clustered and weighted to adjust for selection probability, and standard errors of incidence rates and cumulative incidence curves were calculated using the jackknife repeated replications simulation method, taking weighting and geographical clustering of data into account.

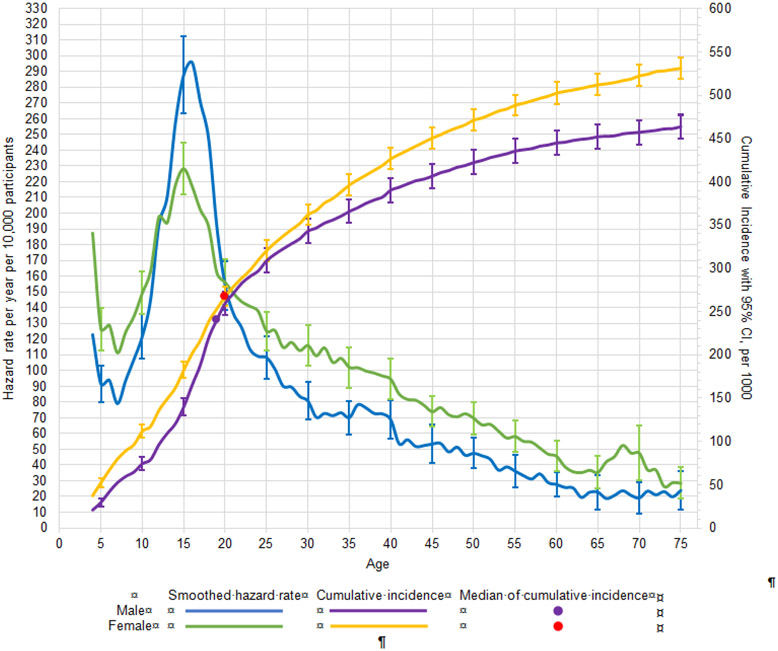
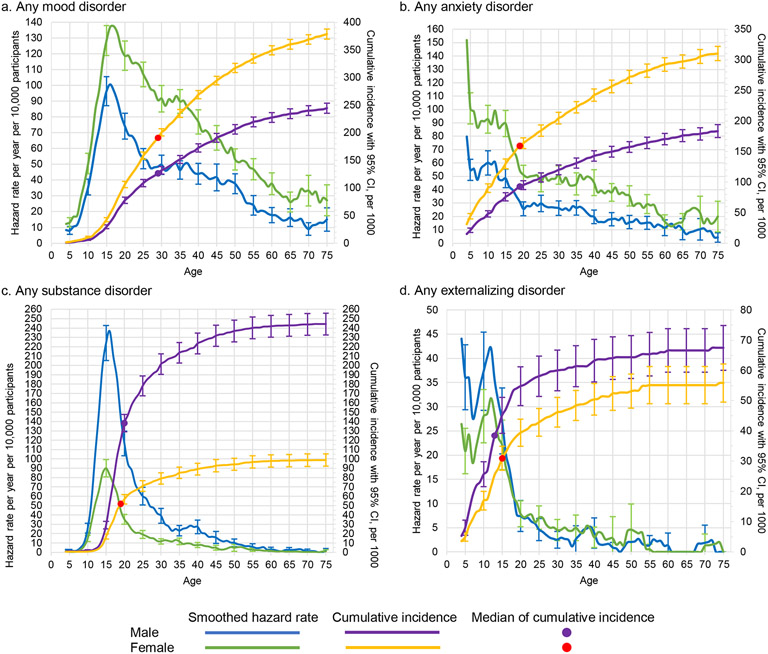
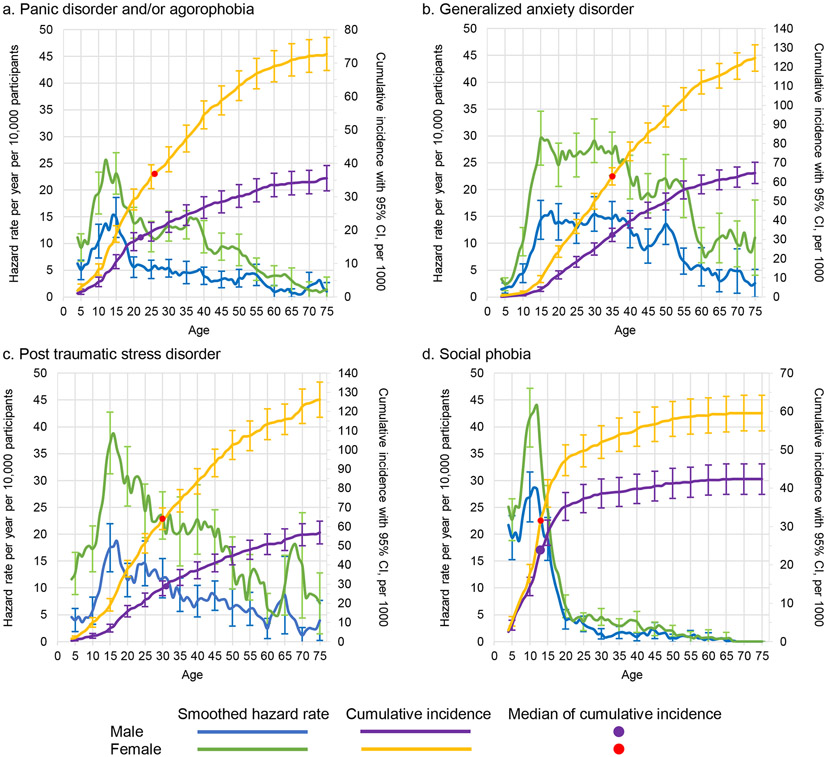
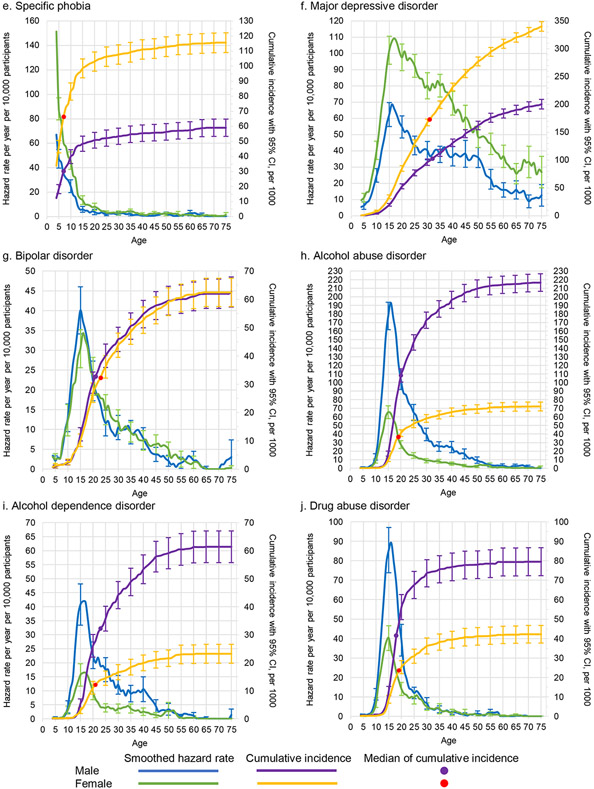
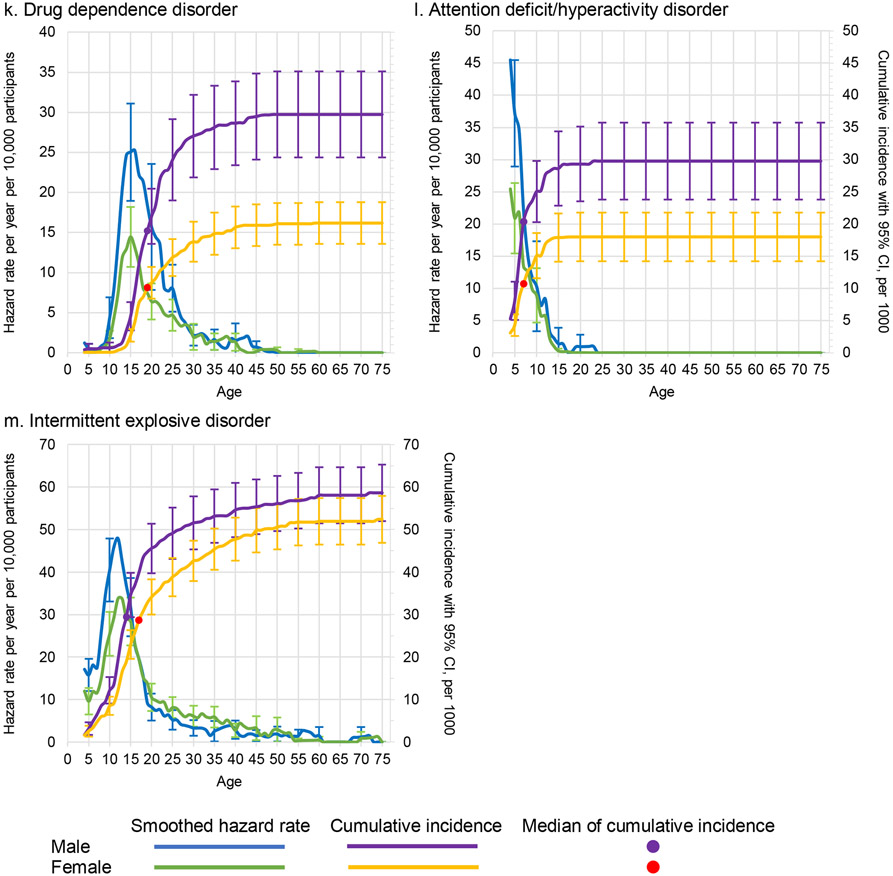
Findings: We included 156 331 respondents from 32 surveys in 29 countries, including 12 low-income and middle-income countries and 17 high-income countries, and including 85 308 (54·5%) female respondents and 71 023 (45·4%) male respondents. The lifetime prevalence of any mental disorder was 28·6% (95% CI 27·9-29·2) for male respondents and 29·8% (29·2-30·3) for female respondents. Morbid risk of any mental disorder by age 75 years was 46·4% (44·9-47·8) for male respondents and 53·1% (51·9-54·3) for female respondents. Conditional probabilities of first onset peaked at approximately age 15 years, with a median age of onset of 19 years (IQR 14-32) for male respondents and 20 years (12-36) for female respondents. The two most prevalent disorders were alcohol use disorder and major depressive disorder for male respondents and major depressive disorder and specific phobia for female respondents.

Interpretation: By age 75 years, approximately half the population can expect to develop one or more of the 13 mental disorders considered in this Article. These disorders typically first emerge in childhood, adolescence, or young adulthood. Services should have the capacity to detect and treat common mental disorders promptly and to optimise care that suits people at these crucial parts of the life course.

Funding: None.


Conflict of interest statement

Declaration of interests LD receives educational grants from Indivior and Seqirus. OVD receives funding from Kowa Research Institute and has been an advisor in the PROMINENT trial. SMK and PWW receive grant funding from Hamad Medical Corporation through the Cambridgeshire and Peterborough National Health Service Foundation trust and from Qatar University. PWW has received financial support from the Qatar National Research Fund and an honorarium from Gresham College. RCK has been a consultant for Cambridge Health Alliance, Canandaigua Veterans Affairs Medical Center, Holmusk, Partners Healthcare, RallyPoint Networks, and Sage Therapeutics. He holds stock options in Cerebral, Mirah, Prepare Your Mind, Roga Sciences, and Verisense Health. DN receives honoraria from AIG General Insurance and Takeda Pharmaceutical and financial support from Startia, En-power, and MD.net. DJS receives royalties from American Psychiatric Press, Cambridge University Press, and Elsevier–Academic Press. He has received honoraria from Discovery Vitality, Johnson & Johnson, Kanna, L'Oreal, Lundbeck, Orion, Sanofi, Servier, Takeda, and Vistagen. He was the president of the African College of Neuropsychopharmacology and is financially supported by the Medical Research Council of South Africa. All other authors declare no competing interests.

Figures

Figure 1.
Figure 1.. Smoothed hazard rate per year of age and cumulative incidence, with 95% confidence intervals by age and sex for any mental disordera
a Left y-axis curves, with blue for males and green for females, are hazard rate (incidence rate) curves. These are calculated per year of age per 10,000 people, defined as a ratio of the number of disorder onsets at a given age among people who never had the disorder at any time up to that age and who lived through that age. For a given age t we used information only from respondents in the age range t to t + 10 to minimize the effects of recall bias. Right y-axis curves, with purple for males and yellow for females, are cumulative incidence (or morbid risk) curves. These are calculated based on the age-specific incidence rates at each year of life using the standard exponential formula.
Figure 2:
Figure 2:. Smoothed hazard rates and cumulative incidence, with 95% confidence intervals by age and sex for any mood disorder, any anxiety disorder, any substance use disorder, and any externalizing disordera
a Left y-axis curves, with blue for males and green for females, are hazard rate (incidence rate) curves. These are calculated per year of age per 10,000 people, defined as a ratio of the number of disorder onsets at a given age among people who never had the disorder at any time up to that age and who lived through that age. For a given age t we used information only from respondents in the age range t to t + 10 to minimize the effects of recall bias. Right y-axis curves, with purple for males and yellow for females, are cumulative incidence (or morbid risk) curves. These are calculated based on the age-specific incidence rates at each year of life using the standard exponential formula.
Figure 3.
Figure 3.. Smoothed Hazard Rate and cumulative incidence, with 95% confidence intervals by age and sex for thirteen specific disordersa
a Left y-axis curves, with blue for males and green for females, are hazard rate (incidence rate) curves. These are calculated per year of age per 10,000 people, defined as a ratio of the number of disorder onsets at a given age among people who never had the disorder at any time up to that age and who lived through that age. For a given age t we used information only from respondents in the age range t to t + 10 to minimize the effects of recall bias. Right y-axis curves, with purple for males and yellow for females, are cumulative incidence (or morbid risk) curves. These are calculated based on the age-specific incidence rates at each year of life using the standard exponential formula.

References

    1. Kessler RC, Angermeyer M, Anthony JC, et al. Lifetime prevalence and age-of-onset distributions of mental disorders in the World Health Organization's World Mental Health Survey initiative. World Psychiatry 2007; 6: 168–76. - PMC - PubMed
    1. Solmi M, Radua J, Olivola M, et al. Age at onset of mental disorders worldwide: Large-scale meta-analysis of 192 epidemiological studies. Mol Psychiatry 2022; 27: 281–95. - PMC - PubMed
    1. Kendler KS, Ohlsson H, Sundquist J, Sundquist K. Family genetic risk scores and the genetic architecture of major affective and psychotic disorders in a Swedish national sample. JAMA Psychiatry 2021; 78: 735–43. - PMC - PubMed
    1. Pedersen EM, Agerbo E, Plana-Ripoll O, et al. Accounting for age of onset and family history improves power in genome-wide association studies. Am J Hum Genet 2022; 109: 417–32. - PMC - PubMed
    1. Murray CJL, Lopez AD, editors. The global burden of disease: A comprehensive assessment of morality and disability from diseases, injuries, risk factors in 1990 and projected to 2020. Cambridge, MA: Published by the Harvard School of Public Health on behalf of the World Health Organization and the World Bank, Distributed by Harvard Unviersity Press; 1996.