. 2023 Sep;33(9):1568-1581.
doi: 10.1101/gr.277430.122. Epub 2023 Aug 2.

Genetic inhibitors of APOBEC3B-induced mutagenesis

Affiliations

Genetic inhibitors of APOBEC3B-induced mutagenesis

Tony M Mertz et al. Genome Res. 2023 Sep.

Abstract

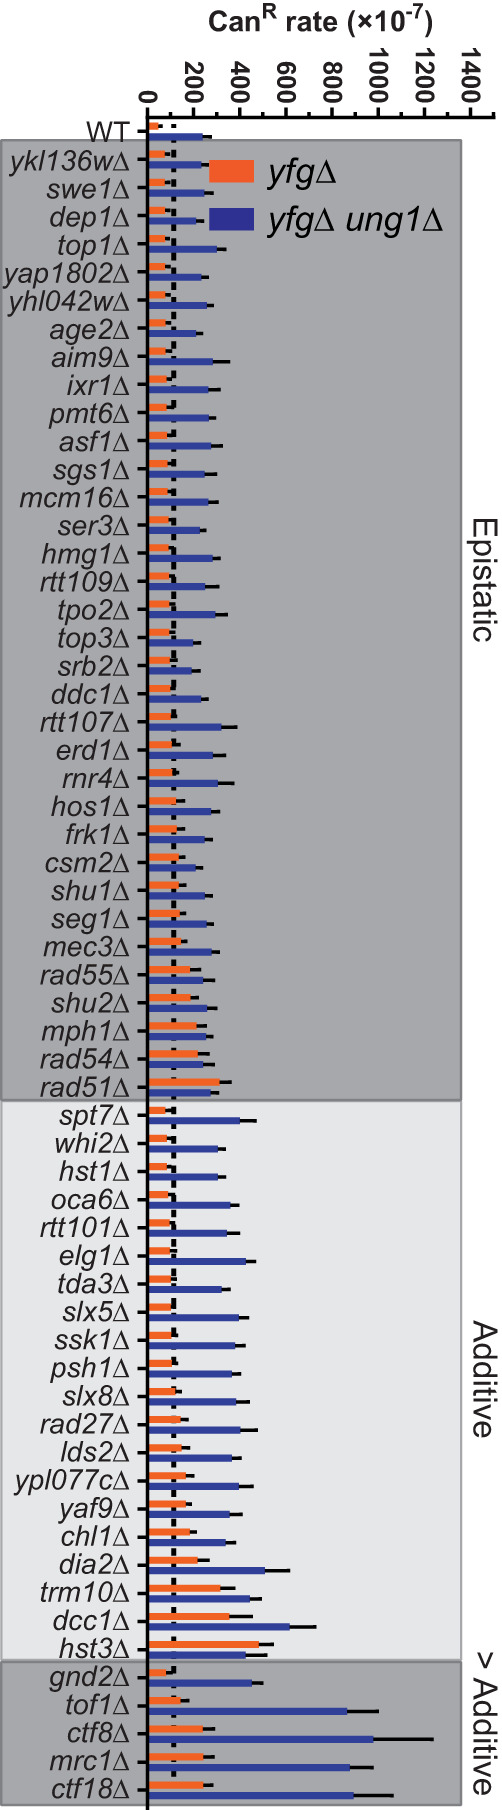
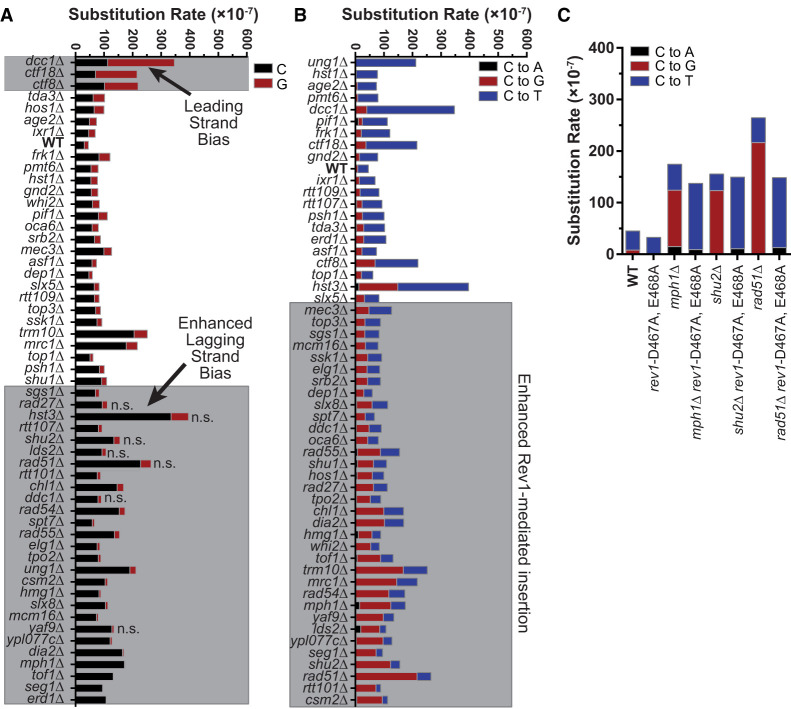
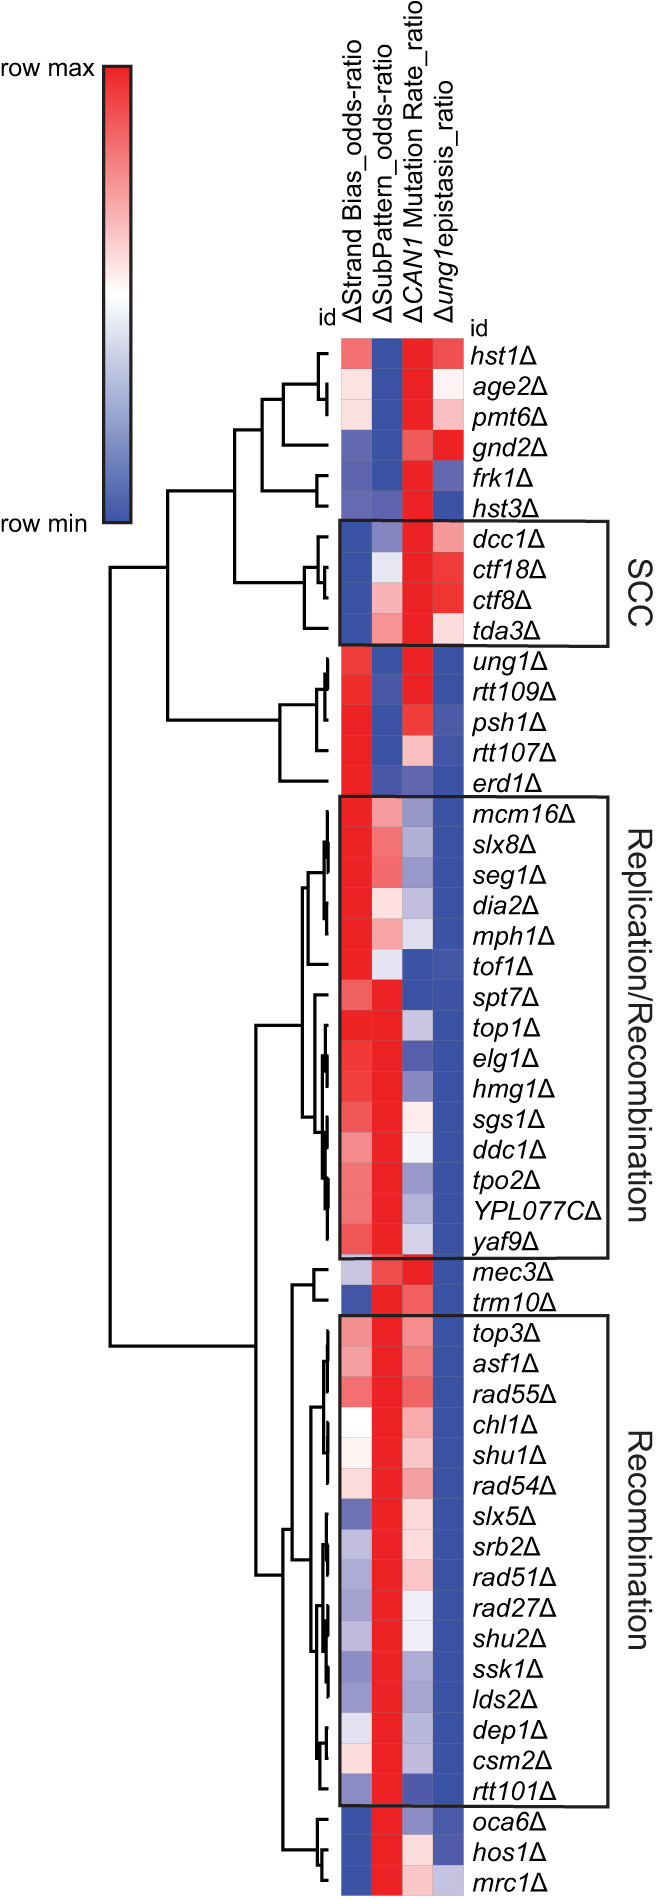
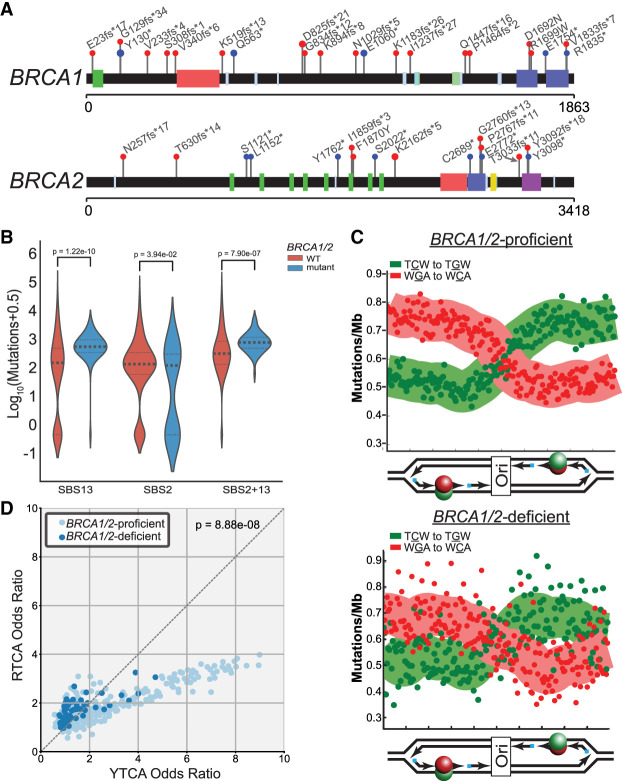
The cytidine deaminases APOBEC3A (A3A) and APOBEC3B (A3B) are prominent mutators of human cancer genomes. However, tumor-specific genetic modulators of APOBEC-induced mutagenesis are poorly defined. Here, we used a screen to identify 61 gene deletions that increase A3B-induced mutations in yeast. We also determined whether each deletion was epistatic with Ung1 loss, which indicated whether the encoded factors participate in the homologous recombination (HR)-dependent bypass of A3B/Ung1-dependent abasic sites or suppress A3B-catalyzed deamination by protecting against aberrant formation of single-stranded DNA (ssDNA). We found that the mutation spectra of A3B-induced mutations revealed genotype-specific patterns of strand-specific ssDNA formation and nucleotide incorporation across APOBEC-induced lesions. Combining these three metrics, we were able to establish a multifactorial signature of APOBEC-induced mutations specific to (1) failure to remove H3K56 acetylation, (2) defective CTF18-RFC complex function, and (3) defective HR-mediated bypass of APOBEC-induced lesions. We extended these results by analyzing mutation data for human tumors and found BRCA1/2-deficient breast cancers display three- to fourfold more APOBEC-induced mutations. Mirroring our results in yeast, Rev1-mediated C-to-G substitutions are mainly responsible for increased APOBEC-signature mutations in BRCA1/2-deficient tumors, and these mutations associate with lagging strand synthesis during replication. These results identify important factors that influence DNA replication dynamics and likely the abundance of APOBEC-induced mutation during tumor progression. They also highlight a novel role for BRCA1/2 during HR-dependent lesion bypass of APOBEC-induced lesions during cancer cell replication.


Figures

Figure 1.
Figure 1.
Identification of yeast gene deletions that increase APOBEC3B-induced mutations. (A) Schematic of the yeast screen used to identify gene deletions that elevate A3B-induced mutagenesis. Haploid yeast containing a single-gene deletion and the A3B expression plasmid was obtained by mating MATα yeast carrying the A3B expression plasmid with each MATa strain of the yeast gene deletion library, sporulating the resulting diploid cells, and selecting the desired haploid genotype. The resulting haploid cells were used for three rounds of CanR frequency measurements to identify gene deletions that likely augment A3B-induced mutagenesis. We were unable to generate 21 haploid strains for the screening process that represent potential (unvalidated) synthetic lethal interactions with A3B expression (Supplemental Table S1). To confirm these deletions resulted in increased A3B-induced mutations we recreated each deletion strain expressing A3B de novo and measured CanR mutation rates. (B) CanR rates for 61 yeast gene deletions that elevate A3B-induced mutation more than 1.55-fold over the A3B-induced CanR rate in wild-type yeast (gray dashed line) without overlapping 95% confidence intervals and 1.55-fold higher than additive for spontaneous deletion-dependent CanR and wild type with A3B CanR rates. Error bars indicate 95% confidence intervals. For all mutation rate data, see Supplemental Table S2.
Figure 2.
Figure 2.
Molecular processes enriched among gene deletions that increase A3B-induced mutagenesis. (A) Gene Ontology (GO) analysis for molecular processes that are enriched among gene deletions that increase A3B-induced mutation. Only categories with strengths equal to or greater than one and having at least three genes represented in the category are shown. Categories for similar processes are represented with the specific GO process with the lowest FDR-corrected P-value. (B) Functional association network for proteins that limit A3B-induced mutation as created by STRINGdb. The 61 gene deletion strains that were confirmed to increase A3B-induced mutagenesis were used in creating the network, with highest-confidence linkage settings and k-means clustering with eight nodes. Proteins without connections to other proteins in the network are hidden. Each k-means clustering node is indicated by a unique color. (C) Gene deletions that elevate A3B-induced mutation function in multiple GO processes. The specific enriched GO processes that each gene contributes to are indicated in green.
Figure 3.
Figure 3.
Impact of ung1Δ in mutants showing increased A3B-induced mutation. A3B-induced CanR rates in yeast that contains genes that limit A3B-induced mutation (yfgΔ; orange bars) or in yeast with genes that limit A3B-induced mutation codeleted with UNG1 (yfgΔ ung1Δ; blue bars). Error bars indicated 95% confidence intervals. Double-deletion strains (yfgΔ ung1Δ) that maintain similar A3B-induced CanR rates to the single-deletion strain and ung1Δ strains (black dashed line) are considered epistatic with ung1Δ and likely contribute to the repair or error-free bypass of A3B-induced lesions. yfgΔ ung1Δ strains with A3B-induced CanR rates higher than ung1Δ strains are either additive or greater than additive with UNG1 deletion and likely increase the amount of ssDNA that A3B acts upon.
Figure 4.
Figure 4.
Spectra of A3B-induced mutations in CAN1. The CAN1 gene of independent CanR isolates was amplified and sequenced to determine the spectra of A3B-induced mutations in yeast with specific gene deletions. Note that A3B-induced CAN1 mutants were not sequenced from the aim9Δ, rnr4Δ, ser3Δ, swe1Δ, yap1802Δ, YKL136WΔ, and YHL042WΔ strains. (A) Strand bias of A3B-induced mutations in CAN1 is influenced by specific gene deletions. The rate of C (black bars) or G (red bars) substitutions in each genotype of yeast expressing A3B. Wild-type yeast expressing A3B favors C substitutions over G substitutions, indicating that the lagging strand template is the top DNA strand of CAN1 at its location on ChrV. The ratio of A3B-induced C-to-G substitutions in wild-type yeast was compared to the same ratio for each yeast deletion strain by two-sided Fisher's exact test. Genotypes with P-values < 0.00083 (based on Bonferroni multiple hypothesis testing correction) were considered to have altered strand bias. (B) The rates of C-to-A, C-to-T, and C-to-G substitutions (complementary substitutions were combined) in CAN1 for yeast expressing A3B and containing various gene deletions. The ratio of C-to-T and C-to-G substitutions were compared pairwise between wild-type yeast expressing A3B and each specific gene deletion strain by two-sided Fisher's exact test. Gene deletion strains displaying P-values < 0.00083 (for Bonferroni correction) were deemed to have more A3B-induced abasic sites bypassed via Rev1 catalytic activity. (C) Rates of C-to-A, C-to-T, and C-to-G substitutions (as in B) for comparing WT and recombination-deficient yeast with corresponding strains lacking Rev1 catalytic activity (i.e., rev1-D467A, E468A).
Figure 5.
Figure 5.
Nonbiased hierarchical clustering of yeast gene deletions that similarly impact A3B-induced mutation. Yeast gene deletion strains with greater than 20 independent A3B-induced CAN1 mutations sequenced were clustered using average linkage based upon (1) how much the gene deletion elevated A3B-induced mutation over that in wild-type yeast, ΔCAN1 Mutation Rate_ratio, which equals the log2(CanR rateyfgΔ/CanR ratewild-type); (2) how the rate of mutation in the yfgΔ ung1Δ codeletion strains compared with the mutation rate in the ung1Δ strains, Δung1epistasis_ratio, which equals the (log2(CanR rateyfgΔ ung1Δ/CanR rateung1Δ); (3) mutational strand bias, ΔStrand Bias_odds-ratio, which equals the log2(substitutions at C/substitutions at G nucleotides); and (4) polymerase usage, ΔSubPattern_odds-ratio, which equals the log2(C-to-T substitutions/C-to-G substitutions). Nodes of genes associated with sister chromatin cohesion (SCC), DNA replication and recombination, and recombination were identified (black boxes).
Figure 6.
Figure 6.
Recombination-deficient breast cancers have elevated APOBEC signature mutagenesis. (A) Position of germline mutations in BRCA1 and BRCA2 present in 560 breast cancers sequences as part of the International Cancer Genome Consortium. (B) Median estimated number of COSMIC SBS2, SBS13, and SBS2 + SBS13 mutations in breast cancers from BRCA-proficient and BRCA-mutant patients. (C) Replication strand bias of SBS13 mutations in tumors from BRCA-proficient and BRCA-deficient patients. (D) Enrichment of A3B-like (RTCA) and A3A-like (YTCA) signature mutations in BRCA-proficient and BRCA-deficient tumors. Increased representation of the A3B-like mutation signature compared with the A3A-like mutation signature among BRCA1/2-mutant tumors was assessed by chi-square test (P = 8.88 × 10⁻⁸).
Figure 7.
Figure 7.
Impact of recombination gene haplo-insufficiency on APOBEC-induced mutagenesis in cervical cancers. (A) Median RSEM normalized RNA-seq expression values (middle horizontal bar in each box plot) for HPRT1, RAD51, and RAD51C in cervical cancers; one or two copies of each gene as determined by GISTIC analysis of SNP6 array data. Error bars indicate the range of RSEM expression values among tumors in each group. Tumors with two copies of RAD51 and RAD51C have higher expression of the respective genes than tumors with one copy as assessed by Mann–Whitney ranked sum test. (B) Minimal estimate of the number of APOBEC-induced mutations in cervical cancers with one or two copies of HPRT1, RAD51, and RAD51C. Median values are indicated by the middle bar in the box plots, and error bars indicate the range of values in each group. (C) Lack of correlation between the number of copy number variants (CNVs) and APOBEC-induced mutations in cervical cancers sequenced by TCGA. The Spearman's coefficient (rho) and P-value are indicated.

Update of

References

    1. Adar S, Izhar L, Hendel A, Geacintov N, Livneh Z. 2009. Repair of gaps opposite lesions by homologous recombination in mammalian cells. Nucleic Acids Res 37: 5737–5748. 10.1093/nar/gkp632 - DOI - PMC - PubMed
    1. Adolph MB, Love RP, Feng Y, Chelico L. 2017. Enzyme cycling contributes to efficient induction of genome mutagenesis by the cytidine deaminase APOBEC3B. Nucleic Acids Res 45: 11925–11940. 10.1093/nar/gkx832 - DOI - PMC - PubMed
    1. Alexandrov LB, Nik-Zainal S, Wedge DC, Aparicio SA, Behjati S, Biankin AV, Bignell GR, Bolli N, Borg A, Børresen-Dale AL, et al. 2013. Signatures of mutational processes in human cancer. Nature 500: 415–421. 10.1038/nature12477 - DOI - PMC - PubMed
    1. Alexandrov LB, Kim J, Haradhvala NJ, Huang MN, Tian Ng AW, Wu Y, Boot A, Covington KR, Gordenin DA, Bergstrom EN, et al. 2020. The repertoire of mutational signatures in human cancer. Nature 578: 94–101. 10.1038/s41586-020-1943-3 - DOI - PMC - PubMed
    1. Benjamini Y, Hochberg Y. 1995. Controlling the false discovery rate: a practical and powerful approach to multiple testing. J R Stat Soc B Methodol 57: 289–300. 10.1111/j.2517-6161.1995.tb02031.x - DOI

Publication types