. 2023 Aug 2;14(1):4631.
doi: 10.1038/s41467-023-40298-7.

Development of Plasmodium falciparum liver-stages in hepatocytes derived from human fetal liver organoid cultures

Affiliations

Development of Plasmodium falciparum liver-stages in hepatocytes derived from human fetal liver organoid cultures

Annie S P Yang et al. Nat Commun. .

Abstract

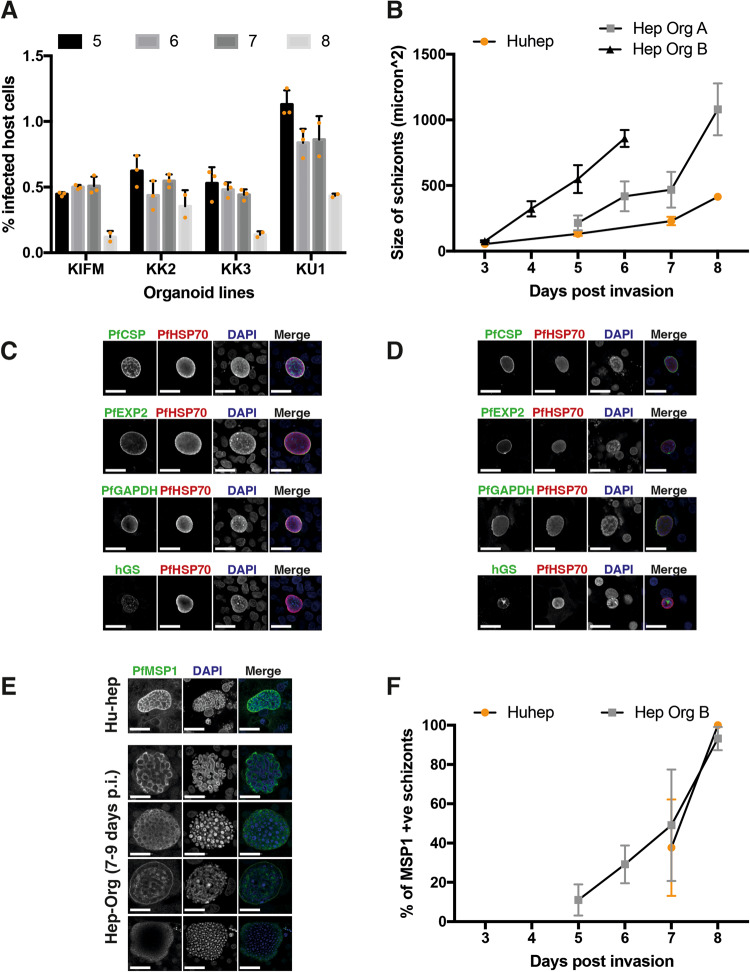
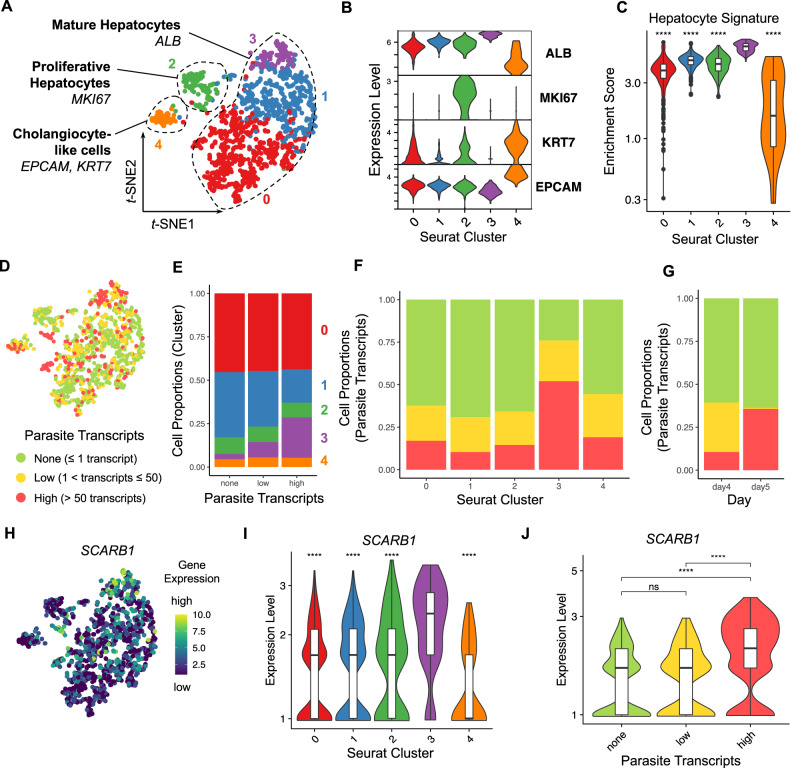
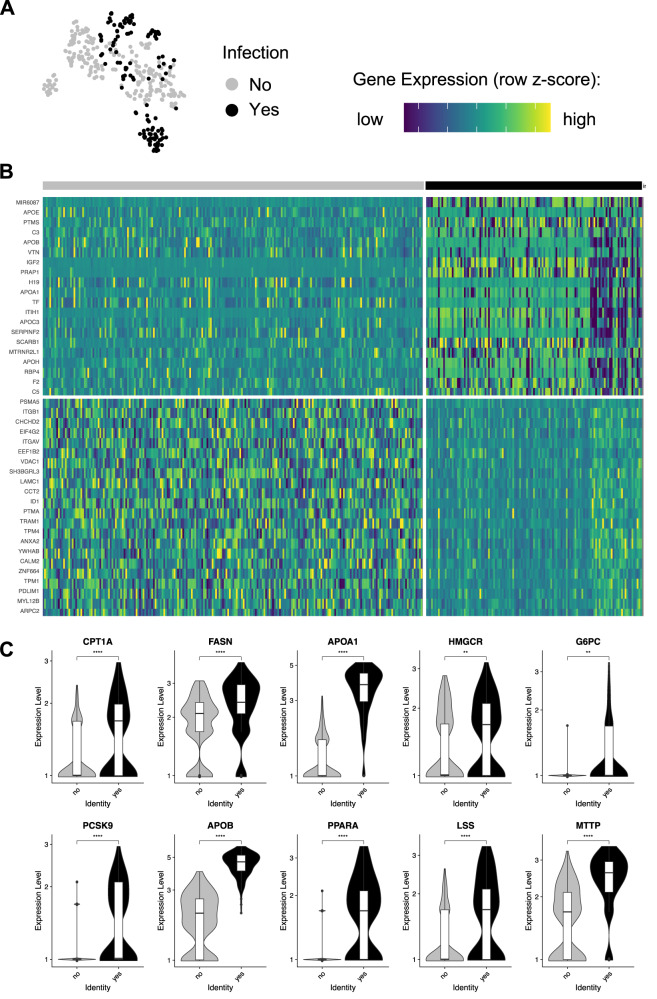
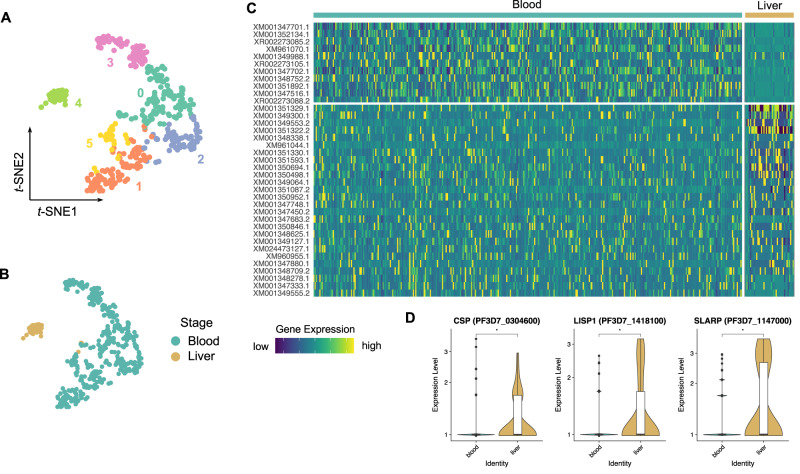
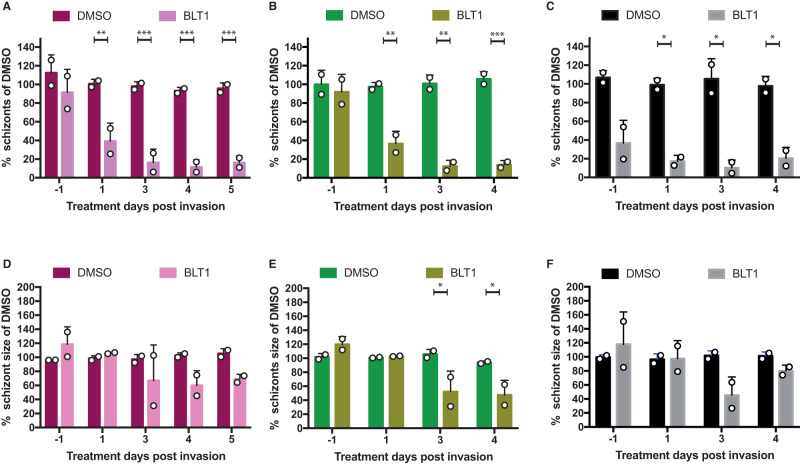
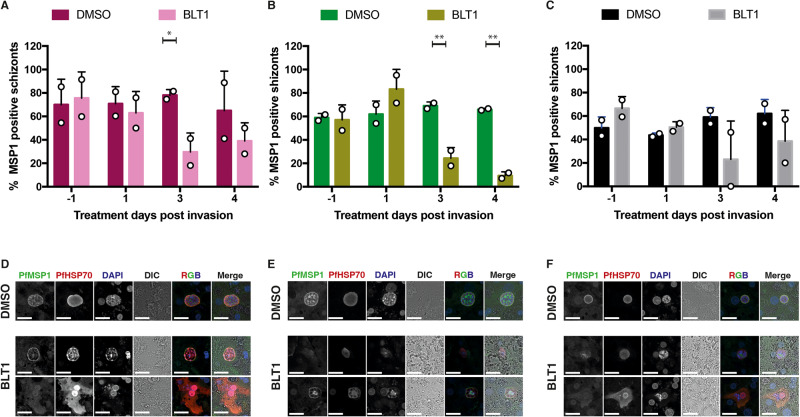
Plasmodium falciparum (Pf) parasite development in liver represents the initial step of the life-cycle in the human host after a Pf-infected mosquito bite. While an attractive stage for life-cycle interruption, understanding of parasite-hepatocyte interaction is inadequate due to limitations of existing in vitro models. We explore the suitability of hepatocyte organoids (HepOrgs) for Pf-development and show that these cells permitted parasite invasion, differentiation and maturation of different Pf strains. Single-cell messenger RNA sequencing (scRNAseq) of Pf-infected HepOrg cells has identified 80 Pf-transcripts upregulated on day 5 post-infection. Transcriptional profile changes are found involving distinct metabolic pathways in hepatocytes with Scavenger Receptor B1 (SR-B1) transcripts highly upregulated. A novel functional involvement in schizont maturation is confirmed in fresh primary hepatocytes. Thus, HepOrgs provide a strong foundation for a versatile in vitro model for Pf liver-stages accommodating basic biological studies and accelerated clinical development of novel tools for malaria control.


Conflict of interest statement

The authors declare no competing interests.

Figures

Fig. 1
Fig. 1. P. falciparum NF175 infection and development in HepOrgs.
A Percentage of host cells (HepOrgs) with NF175 schizonts. Each bar represents the average of triplicates while only duplicates are shown for day 8. (n = 4 donors; KIFM, KK2, KK3 and KU1; error bar is the mean ± SD of three technical replicates). B The size of NF175 schizonts in HepOrg experiment A and B compared to HuHeps. Each point represents the average of median of >100 schizonts from three biological replicates with standard deviation. For the HepOrg A, each point represents the average of median of KK2, KIFM, KU1 where >25 schizonts are measured for each line at each time point. For HepOrg B, each point represents the average of median of KIFM, KK2, KK3 and KU1 where > 100 schizonts are measured for each line at each time point. Areas under the schizont growth curves of Huheps and respectively HepOrg A (p = 0.001; n = 4 donors) and HepOrg B (p = 0.0002; n = 4 donors) were significantly different (Welch t-test, two-sided). C Confocal images of HepOrgs and D HuHeps at day 5 p.i. showing the expression of typical liver-stage markers; from top to bottom: Circumsporozoite protein (CSP), Exported Protein 2 (EXP2), Glyceraldehyde-3-phosphate dehydrogenase (GAPDH) and human Glutamine Synthetase (hGS). Scale bar is 25 microns. E Confocal images of Merozoite Surface Protein 1 (PfMSP1) in schizonts of HuHeps (top) and HepOrgs (bottom) on day 7-9 p.i. Scale bar is 25 microns. For C, D and E, these stainings have been repeated in three independent experiments and here a representative image is shown for each staining combination. F Average percentage with standard deviation of PfMSP1 positive schizonts from HepOrg B (n = 4; KIFM, KK2, KK3, KU1) and HuHep (n = 3) assessed >100 schizonts per line per time point. See also Fig. S1.
Fig. 2
Fig. 2. Expression of hepatocyte maturation markers in Pf-infected HepOrgs at 4 or 5 days p.i.
A t-SNE map showing the Seurat clusters and major cell types in the human read dataset (n = 1277 cells; cluster 0, n = 571 cells; cluster 1, n = 426 cells; cluster 2, n = 117 cells; cluster 3, n = 100 cells; cluster 4, n = 63 cells). B Violin plot showing the lineage marker gene expression per Seurat cluster. C Violin plot showing the enrichment scores of the hepatocyte gene signature per Seurat cluster. D t-SNE map highlighting the infection rates of the cells (none, n = 786 cells; low, n = 269 cells; high, n = 222 cells). E Column chart showing the cell proportions per Seurat cluster and infection rate. Column chart showing the cell proportions per infection rate and F Seurat cluster or G collection day (4 or 5 days p.i.). H t-SNE map showing SCARB1 expression. Violin plots showing SCARB1 expression per I Seurat cluster and J infection rate. Two-sided Mann–Whitney U (Wilcoxon rank-sum) test: ns p ≥ 0.05, ****p < 0.0001. Statistics in C and I were calculated in comparison to cluster 3. C p < 2–16 (all comparisons); I p < 2–16 (vs cluster 0), p = 3.1–13 (vs cluster 1), p = 8.6–8 (vs cluster 2), p = 2.7–12 (vs cluster 4); J p = 0.53 (none vs low), p < 2.22–16 (none vs high), p = 1.9–14 (low vs high). Box plots in C, I and J indicate the median (Q2), 25th percentile (Q1) and 75th percentile (Q3) with the whiskers showing the minimum (Q1 – 1.5 × interquartile range) and maximum (Q3+ 1.5 × interquartile range). See also Fig. S2–S6, S11 and Supplementary Data 1. Source data are provided as a Source data file and Supplementary Data 5.
Fig. 3
Fig. 3. Pf-infected hepatocytes display a distinct gene-expression pattern.
A t-SNE map of cells at day 5 p.i. showing the infection state (uninfected cells, n = 222; infected cells, n = 126). B Heatmap showing differentially expressed (DE) genes between infected and uninfected cells. C Violin plots showing a selection of DE genes between infected and uninfected cells. Two-sided Mann–Whitney U (Wilcoxon rank-sum) test: **p < 0.01, ***p < 0.001, ****p < 0.0001. CPT1A, p = 3.3−5; FASN, p = 5.8−10; APOA1, p > 2.22−16; HMGCR, p = 0.0062; G6PC, p = 0.0011; PCSK9, p = 2−10; APOB, p > 2.22−16; PPARA, p > 2.22−16; LSS, p = 1.3−7; MTTP, p > 2.22−16. Box plots in C indicate the median (Q2), 25th percentile (Q1) and 75th percentile (Q3) with the whiskers showing the minimum (Q1 – 1.5 × interquartile range) and maximum (Q3 + 1.5 × interquartile range). See also Supplementary Data 2 and 3. Source data are provided as a Source data file and Supplementary Data 5.
Fig. 4
Fig. 4. Single-cell transcriptomics shows Pf-liver stage-specific gene-expression pattern.
A, B Parasite-derived t-SNE maps of individual cells showing Seurat cell clusters (A; n = 395 cells; cluster 0, n = 109 cells; cluster 1, n = 90 cells; cluster 2, n = 66 cells; cluster 3, n = 63 cells; cluster 4, n = 36 cells; cluster 5, n = 31 cells) and infected HepOrg cells (Pf liver stage; n = 40 cells) or erythrocytes (Pf blood stage; n = 355 cells), respectively B. Cluster 4 is enriched in infected cells from HepOrgs, while the remaining clusters mostly contain red blood cells. C Heatmap showing differentially expressed (DE) genes between liver and blood stage. D Violin plots showing DE genes enriched in the liver stage compared to the blood stage. Two-sided Mann–Whitney U (Wilcoxon rank-sum) test: *p < 0.05. CSP, p = 0.019; LISP1, p = 0.031; SLARP, p = 0.031. Box plots in D indicate the median (Q2), 25th percentile (Q1) and 75th percentile (Q3) with the whiskers showing the minimum (Q1 – 1.5 × interquartile range) and maximum (Q3 + 1.5 × interquartile range). See also Supplementary Data 4. Source data are provided as a Source data file and Supplementary Data 7.
Fig. 5
Fig. 5. Effect of BLT1-inhibitor on Pf-liver-stage development.
The average (of triplicates) number (AC) and size (DF) of schizonts in HuHeps infected with strain NF175 (Magenta) NF135 (Green) and NF54 (Black) and treated with either DMSO or BLT1. Each bar represents the average and error bars (SD) of three technical replicates (AC) from two biological experiments (n = 2). For schizont size (DF) data are shown of two technical replicates of at least 100 schizonts except for NF54 due to low numbers of schizonts surviving (DF). Raw numbers for this panel are shown in Figs. S8 and S9. Sidak’s multiple comparison test (two sided) is used to compare DMSO and BLT1 conditions for AF and annotated as *p < 0.05, **p < 0.01, ***p < 0.001. For A, p values from left to right are 0.0014, 0.0004, 0.0004, and 0.0005. For B, p values are 0.0032, 0.0010, 0.0009. For C, p values are 0.0369, 0.0216, 0.0447. For E, p values are 0.0182 and 0.0387.
Fig. 6
Fig. 6. The effect of BLT1 on PfMSP1 development.
The percentage of HuHep Schizonts positive for PfMSP1 expression for NF175 (A), NF135 (B), and NF54 (C). A total of two biological experiments were performed (n = 2), each with two technical replicates: at least 100 schizonts were measured from each technical replicate except for NF54 due to low numbers of schizonts surviving. Each bar represents the average and error bars (SD) of two technical replicates (AC) from two biological experiments (n = 2). Confocal images showing DMSO and BLT1 treated schizonts stained for PfMSP1 and PfHSP70 for NF175 (D), NF135 (E), and NF54 (F) in HuHeps. Scale bar is 25 microns. These images are a representative from two independent experiments. Sidak’s multiple comparison test (two sided) is used to compare the DMSO and BLT1 conditions for each parasite strain (AC): the p values for the significant parameters are annotated (*p < 0.05, **p < 0.01, ***p < 0.001). For A, p value is 0.0488; B (left to right), p values are 0.0054 and 0.0012.

References

    1. WHO. World Malaria Report 2021 (WHO, 2021).
    1. Roth A, et al. A comprehensive model for assessment of liver stage therapies targeting Plasmodium vivax and Plasmodium falciparum. Nat. Commun. 2018;9:1837. doi: 10.1038/s41467-018-04221-9. - DOI - PMC - PubMed
    1. Sattabongkot J, et al. Establishment of a human hepatocyte line that supports in vitro development of the exo-erythrocytic stages of the malaria parasites Plasmodium falciparum and P. vivax. Am. J. Trop. Med. Hyg. 2006;74:708–715. doi: 10.4269/ajtmh.2006.74.708. - DOI - PubMed
    1. Clevers H. Modeling development and disease with organoids. Cell. 2016;165:1586–1597. doi: 10.1016/j.cell.2016.05.082. - DOI - PubMed
    1. Hu H, et al. Long-term expansion of functional mouse and human hepatocytes as 3D organoids. Cell. 2018;175:1591–1606.e19. doi: 10.1016/j.cell.2018.11.013. - DOI - PubMed

Publication types