. 2023 Aug 2;14(1):4632.
doi: 10.1038/s41467-023-39570-7.

Proteogenomic analysis reveals RNA as a source for tumor-agnostic neoantigen identification

Affiliations

Proteogenomic analysis reveals RNA as a source for tumor-agnostic neoantigen identification

Celina Tretter et al. Nat Commun. .

Erratum in

  • Author Correction: Proteogenomic analysis reveals RNA as a source for tumor-agnostic neoantigen identification.
    Tretter C, de Andrade Krätzig N, Pecoraro M, Lange S, Seifert P, von Frankenberg C, Untch J, Zuleger G, Wilhelm M, Zolg DP, Dreyer FS, Bräunlein E, Engleitner T, Uhrig S, Boxberg M, Steiger K, Slotta-Huspenina J, Ochsenreither S, von Bubnoff N, Bauer S, Boerries M, Jost PJ, Schenck K, Dresing I, Bassermann F, Friess H, Reim D, Grützmann K, Pfütze K, Klink B, Schröck E, Haller B, Kuster B, Mann M, Weichert W, Fröhling S, Rad R, Hiltensperger M, Krackhardt AM. Tretter C, et al. Nat Commun. 2024 Mar 15;15(1):2364. doi: 10.1038/s41467-024-46724-8. Nat Commun. 2024. PMID: 38491045 Free PMC article. No abstract available.

Abstract

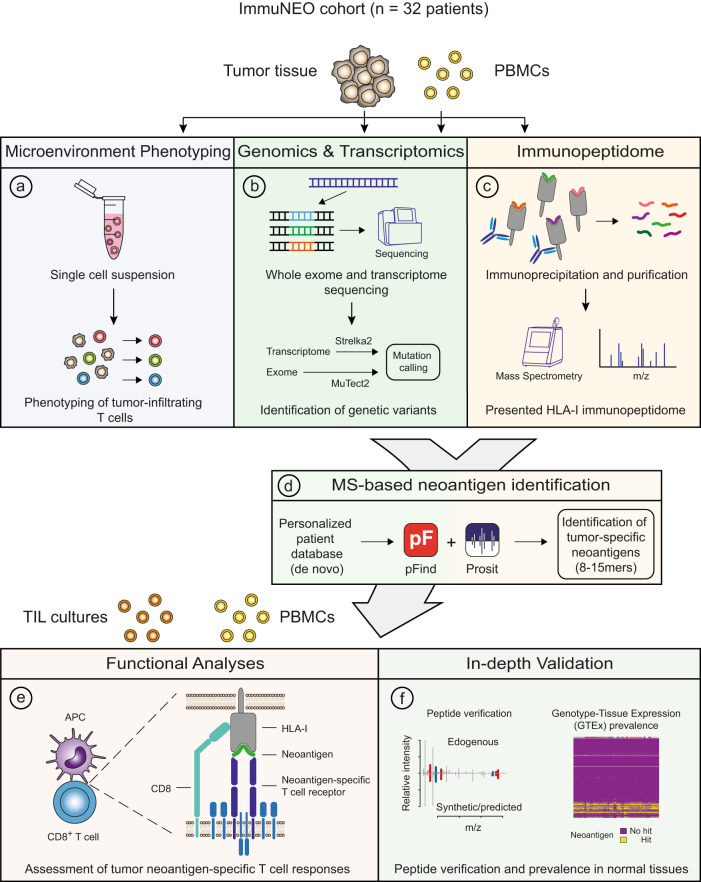
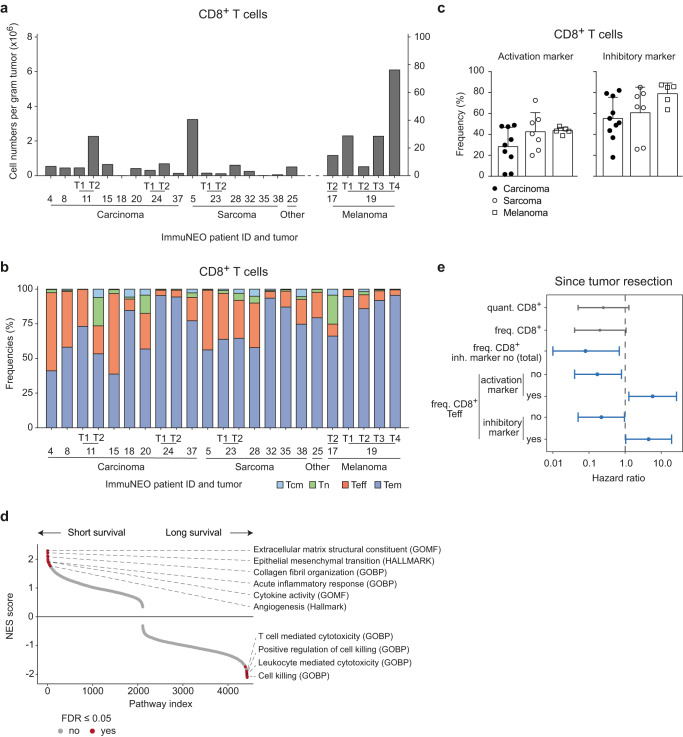
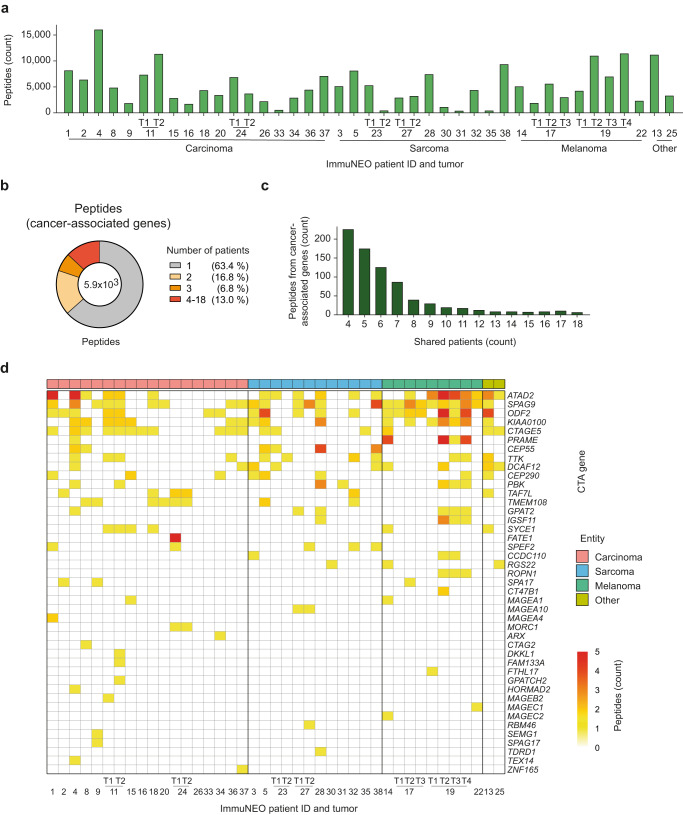
Systemic pan-tumor analyses may reveal the significance of common features implicated in cancer immunogenicity and patient survival. Here, we provide a comprehensive multi-omics data set for 32 patients across 25 tumor types for proteogenomic-based discovery of neoantigens. By using an optimized computational approach, we discover a large number of tumor-specific and tumor-associated antigens. To create a pipeline for the identification of neoantigens in our cohort, we combine DNA and RNA sequencing with MS-based immunopeptidomics of tumor specimens, followed by the assessment of their immunogenicity and an in-depth validation process. We detect a broad variety of non-canonical HLA-binding peptides in the majority of patients demonstrating partially immunogenicity. Our validation process allows for the selection of 32 potential neoantigen candidates. The majority of neoantigen candidates originates from variants identified in the RNA data set, illustrating the relevance of RNA as a still understudied source of cancer antigens. This study underlines the importance of RNA-centered variant detection for the identification of shared biomarkers and potentially relevant neoantigen candidates.


Conflict of interest statement

The authors declare no competing interests.

Figures

Fig. 1
Fig. 1. Overview of the workflow for immunophenotyping, proteogenomic, functional, and validation analyses for neoantigen identification in the cross-entity cohort.
Tumor material and peripheral blood from 32 patients included in the ImmoNEO MASTER cohort harboring diverse tumor entities was used for the following analyses: a Tumor microenvironment phenotyping; single cell suspensions from fresh primary tumor tissues were used for multi-color flow cytometric characterization of tumor-infiltrating T cells and FACS-sorted CD8+ T cells were used for bulk transcriptome analysis (RNA-seq). b Genomic and transcriptomic analysis; primary tumor tissue was used for whole exome (WES)/whole-genome sequencing (WGS) and RNA-seq. Blood from the same patient served as control samples. Variants were called by MuTect2 (v4.1.0.0) from WES/WGS data and by Strelka2 (v2.9.10) from RNA-seq data and variants were filtered for single-nucleotide polymorphisms (SNPs) by using the dbSNP database. c Immunopeptidome analysis; fresh primary tumor tissue was used for HLA class I-bound peptide immunoprecipitation and subsequent liquid chromatography with tandem mass spectrometry (LC-MS/MS) analysis of eluted peptides. The whole HLA class I peptidome was analysed using pFind searching for 8–15mers. d MS-based neoantigen identification; patient-specific variant data from (b) were used to generate a personalized database for matching with the MS-identified peptide sequences using pFind for the identification of neoantigen candidates. The machine learning tool Prosit was integrated in addition to rescoring the peptide spectra matching to the patient-specific personalized database. Several filtering and post-processing steps were applied for the identification of neoantigen candidates. e Immunogenicity assessment of neoantigen candidates; patient-derived autologous immune cells (PBMCs and TILs) and allogenic-matched healthy donor-derived PBMCs were used for immunogenicity assessment of the identified neoantigen candidates using a modified accelerated co-cultured dendritic cell (acDC) assay. f In-depth validation of peptides and variants; identified peptides were verified by comparison of their spectra to their synthetic peptide spectra and Prosit-predicted spectra as well as comparing their experimental and predicted retention times. RNA variants were further validated for their tumor-specificity by analysing their prevalence in normal tissue RNA-seq data obtained from the Genotype-Tissue Expression (GTEx) project. APC antigen-presenting cell, FDR false discovery rate, HLA-I human leukocyte antigen class I, ORF open reading frame, m/z mass/charge number of ions, PBMC peripheral blood mononuclear cells, TIL tumor-infiltrating lymphocytes.
Fig. 2
Fig. 2. Phenotypic and transcriptomic investigation of the immune tumor microenvironment of a defined subgroup of the ImmuNEO MASTER cohort.
a Quantitative numbers of CD8+ T cells per gram tumor identified by flow cytometric assessment of fresh tumor tissue per patient grouped by tumor entity. b Frequencies of different CD8+ T cell subsets of all identified tumor-infiltrating CD8+ T cells per patient grouped by tumor entity. c Frequencies of CD8+ T cells expressing at least one activation marker (HLA-DR, CD103) or inhibitory marker (PD-1, TIM-3, and LAG-3) for different cancer entities. Symbols depict individual tumor samples. Data were shown as mean + s.d. d Gene set enrichment analysis (GSEA) in the preRanked mode for gene signatures differentially expressed in sorted tumor-infiltrating CD8+ T cells from bulk RNA sequencing (RNA-seq) of patients with short (below 1 year, n = 3) and long survival (above 1 year, n = 5) since tumor resection and the Hallmark and Gene Ontology gene set definitions from MsigDB v7.4,. NES scores for each pathway are depicted and significantly enriched (p ≤ 0.05) pathways are colored in red. e Forest plot showing the hazard ratio calculated by log-rank test and Cox’s proportional hazards model of several phenotypic parameters for the survival of patients since tumor resection (n = 17). Significant correlations (p ≤ 0.05) are highlighted in blue. For statistical analysis, only one representative tumor sample per patient was used (see core cohort Supplementary Table 1). Data were shown as hazard ratio (dot) and 95% confidence intervals (lines). a, b n = 23 tumor samples from n = 17 patients (see Supplementary Table 1). c n = 9 carcinoma samples from n = 7 patients for activation marker and n = 10 carcinoma samples from n = 8 patients for inhibitory marker; n = 7 sarcoma samples from six patients and n = 5 melanoma samples from n = 2 patients for activation and inhibitory marker. FDR false discovery rate, freq. frequency, GOBP Gene ontology biological function gene set, GOMF Gene ontology molecular function gene set, HALLMARK hallmark gene set, inh. inhibitory, NES normalized enrichment score, quant. quantified per gram tumor, T tumor, Tcm central memory T cells, Teff effector T cells, Tem effector memory T cells, Tn naïve T cells. Source data are provided as a Source Data file.
Fig. 3
Fig. 3. Genetic variants identified at the DNA and RNA level in tumor tissue from different cancer entities.
a Distribution of the total numbers of variants identified from DNA (upper panel) and RNA data (lower panel) identified per tumor sample grouped by tumor entity. Mutations were called by MuTect2 (v4.1.0.0) from whole exome (WES)/whole-genome sequencing (WGS) data and by Strelka2 (v2.9.10) from RNA sequencing (RNA-seq) data. SNP-filtering was performed using the dbSNP-all database. No RNA data were available for patients IN-11-T1, IN-14, IN-16, IN-20, IN-25, IN-31, and IN-34. b Pie chart depicting the proportion of variants only identified from RNA-seq data of all tumor samples combined where the respective canonical sequence was identified at the DNA level with coverage of ≥3 reads (green) or the respective region was not covered at the DNA level (gray, <3 reads). c Distribution of the nucleotide exchange pattern overall single nucleotide variants only identified from RNA-seq data of all tumor samples combined. d Pie charts depicting the distribution of each mutation type for variants called from all DNA (left) and RNA (right) variants. e, f Pie charts showing the proportions of unique and shared DNA variants (e) and RNA variants (f) between different patients. The right bar graph shows the number of variants shared by 4 to 14 patients for DNA variants (e) and shared by 10 to 26 patients for RNA variants (f) in more detail. af n = 39 tumor samples from n = 32 patients for WES/WGS data; n = 32 tumor samples from n = 26 patients for RNA-seq data (see Supplementary Table 1). T tumor. Source data are provided as a Source Data file.
Fig. 4
Fig. 4. Analysis of the HLA class I tumor immunopeptidomes.
a Distribution of the total number of unique HLA class I peptides identified per tumor sample grouped by tumor entity. Peptides bound to HLA class I molecules on the surface of tumor cells were isolated by immunoprecipitation and sequenced by liquid chromatography with tandem mass spectrometry (LC-MS/MS). Peptide sequences were then mapped with 1% FDR to the Ensemble92 protein database using pFind (v3.1.5) and unique sequences have been filtered. b Pie chart showing the proportion of unique and shared peptides originating from cancer-associated genes (ProteinAtlas) between patients. c Bar graph depicting the number of peptides shared by 4 to 18 patients in more detail. d Heatmap depicting the numbers of unique peptides found per cancer-testis antigen (CTA) gene in each tumor sample. Genes were sorted by the total number of peptides identified overall patients and samples were grouped by entity. ad n = 41 tumor samples from n = 32 patients (see Supplementary Table 1). FDR false discovery rate, HLA human leukocyte antigen, T tumor. Source data are provided as a Source Data file.
Fig. 5
Fig. 5. Proteogenomic identification of neoantigen candidates.
a, b Number of identified neoantigen candidates based on the bioinformatics tool that they were identified with (a) and per tumor sample and grouped by tumor entity (b). pFind (v3.1.5) was used at 5% FDR on spectral level for the identification of non-canonical 8–15mer neoantigen candidates. The machine learning tool Prosit was integrated in addition to rescoring the peptide spectra matching to the patient-specific personalized database using unfiltered pFind data as input. n = 39 tumor samples from n = 32 patients were analysed in total; n = 27 tumor samples from n = 24 patients harbored n = 90 neoantigen candidates. c Bar graph showing the length distribution of all identified neoantigen candidates in amino acids (aa). d Source (DNA or RNA data) of the variants that the identified neoantigen candidates were derived from. e Pie chart depicting the proportion of neoantigen candidates identified only from RNA sequencing (RNA-seq) data where the respective canonical sequence was identified at the DNA level with coverage of ≥3 reads (green) or the respective region was not covered at the DNA level (gray, <3 reads). f Distribution of the nucleotide exchange pattern of all variants that yield neoantigen candidates identified only from RNA-seq data. g Distribution of each mutation type (left) and biotype (right) of all variants that yield neoantigen candidates. ag n = 39 tumor samples from n = 32 patients were analysed in total; n = 27 tumor samples from n = 24 patients harbored n = 90 neoantigen candidates; n = 3 neoantigen candidates from DNA variants; n = 8 neoantigen candidates from DNA and RNA variants; n = 79 neoantigen candidates from RNA variants. aa amino acids, MS mass spectrometry, Proc. processed, T tumor, TEC to be experimentally confirmed. Source data are provided as a Source Data file.
Fig. 6
Fig. 6. Immunogenicity assessment of neoantigen candidates.
a, b Summary of immunogenicity assessment data from all performed modified accelerated co-cultured dendritic cell (acDC) assays for neoantigen candidates by ELIspot analysis using patient-derived PBMC (left plot) or TILs (right plot) (a) and allogenic-matched healthy donor PBMCs (non-enriched) (b). Mean IFN-γ spot forming units (SFU) for T cells tested against the mutated peptide (test condition) and tested against a control peptide (control condition) were calculated and the ratio as well as the difference of the mean SFU have been determined. Values are shown for every peptide and PBMC or TIL aliquot tested. Highlighted are peptides that elicit an immune response where the ratio of SFU is >2 and the difference of SFU is >50. Autologous LCLs or allogenic HLA-matched cells (LCLs or HLA-transduced cell lines) were used as target cells. Negative values (when controls show more spots than the test condition) were set to 0 for better readability. c Representative IFN-γ ELIspot data showing spots per well for autologous and allogenic-matched PBMCs tested against a control peptide (top) and the indicated neoantigen candidate (bottom). d Genetic origin (DNA or RNA data) of the variants that the identified immunogenic neoantigens were derived from. e Distribution of each mutation type (left) and biotype (right) of all variants that yield immunogenic neoantigens. a, d, e n = 78 neoantigen candidates from n = 24 patients were analysed in total; n = 8 patients harbored n = 20 immunogenic neoantigens; n = 17 immunogenic neoantigen candidates from autologous PBMC cultures; n = 3 immunogenic neoantigen candidates from TIL cultures; n = 23 tumor samples from n = 17 patients for immunophenotyping data. b n = 10 neoantigen candidates from n = 4 patients were analysed in total; n = 5 immunogenic neoantigen candidates from allogenic-matched PBMC cultures. MS mass spectrometry, PBMCs peripheral blood mononuclear cells, SFU spot forming units, TIL tumor-infiltration lymphocytes. Source data are provided as a Source Data file.
Fig. 7
Fig. 7. In-depth validation of neoantigen candidates.
Validation of all 90 neoantigen candidates based on peptide verification and neoantigen candidate variant prevalence in normal tissues. Peptides were verified by comparison of their spectra to their synthetic peptide spectra and Prosit-predicted spectra. The best normalized spectral contrast angle (SA) of both methods was used and grouped into peptide-spectrum matches (green, n = 41), potential matches (yellow, n = 19), and mismatches (red, n = 28). Retention times (RT) of each peptide were predicted using Prosit and compared to the experimental RTs as an additional scoring criterion for peptide verification. Based on the error distribution for all peptides (see Supplementary Fig. 11) n = 45 peptides were considered matching (green). For n = 17 peptides no accurate RT error could be predicted according to the distribution of canonical peptides and these were considered deviations (yellow). The prevalence of all neoantigen candidate variants in normal tissues was assessed in RNA expression data obtained from the Genotype-Tissue Expression (GTEx) project (n = 10,269 samples from 30 different normal tissues). Candidate variants were either absent (green, n = 38), showed very low prevalence (dark green, n = 7), low prevalence (yellow, n = 12), intermediate prevalence (orange, n = 6), a high prevalence (n = 16) in normal tissues or were defined as not available (N/A) based on expression data (n = 9 candidates; where the variant locus is expressed in less than 5% of normal tissue samples with at least three reads). Validated neoantigen candidates were comprised of promising candidates (top, n = 20) and potentially promising candidates that need further verification of their peptide sequence or prevalence in normal tissues (middle, n = 12) (in total n = 32), and non-validated neoantigen candidates that either lacked sufficient peptide verification or showed high prevalence in normal tissues (bottom, n = 58) were separated by a line. The immunogenicity (Fig. 6) of each neoantigen candidate, the variant type, the source of variant identification, and the coverage at the DNA level (at least three canonical reads) are displayed. RT retention time, SA spectral contrast angle, WES whole exome sequencing; WGS whole-genome sequencing. Source data are provided in Supplementary Data 4.

References

    1. Verdegaal EME, et al. Neoantigen landscape dynamics during human melanoma-T cell interactions. Nature. 2016;536:91–95. doi: 10.1038/nature18945. - DOI - PubMed
    1. Tran E, et al. Immunogenicity of somatic mutations in human gastrointestinal cancers. Science. 2015;350:1387–1390. doi: 10.1126/science.aad1253. - DOI - PMC - PubMed
    1. Bräunlein, E. et al. Spatial and temporal plasticity of neoantigen-specific T-cell responses bases on characteristics associated to antigen and TCR. Preprint at bioRxiv10.1101/2021.02.02.428777 (2021).
    1. Sahin U, et al. Personalized RNA mutanome vaccines mobilize poly-specific therapeutic immunity against cancer. Nature. 2017;547:222–226. doi: 10.1038/nature23003. - DOI - PubMed
    1. Hu Z, et al. Personal neoantigen vaccines induce persistent memory T cell responses and epitope spreading in patients with melanoma. Nat. Med. 2021;27:515–525. doi: 10.1038/s41591-020-01206-4. - DOI - PMC - PubMed

Publication types

LinkOut - more resources