Meta-Analysis
. 2023 Aug 2;14(1):4646.
doi: 10.1038/s41467-023-39521-2.

Genetic insights into resting heart rate and its role in cardiovascular disease

Yordi J van de Vegte #  1 Ruben N Eppinga #  2 M Yldau van der Ende  3 Yanick P Hagemeijer  1   4 Yuvaraj Mahendran  5 Elias Salfati  6   7 Albert V Smith  8 Vanessa Y Tan  9   10 Dan E Arking  11 Ioanna Ntalla  12 Emil V Appel  5 Claudia Schurmann  13 Jennifer A Brody  14 Rico Rueedi  15   16 Ozren Polasek  17   18 Gardar Sveinbjornsson  19 Cecile Lecoeur  20 Claes Ladenvall  21   22 Jing Hua Zhao  23 Aaron Isaacs  24 Lihua Wang  25 Jian'an Luan  26 Shih-Jen Hwang  27 Nina Mononen  28   29 Kirsi Auro  30   31 Anne U Jackson  32 Lawrence F Bielak  33 Linyao Zeng  34 Nabi Shah  35   36 Maria Nethander  37   38 Archie Campbell  39   40 Tuomo Rankinen  41 Sonali Pechlivanis  42 Lu Qi  43 Wei Zhao  33   44 Federica Rizzi  45 Toshiko Tanaka  46 Antonietta Robino  47 Massimiliano Cocca  47 Leslie Lange  48 Martina Müller-Nurasyid  49   50   51 Carolina Roselli  51   52 Weihua Zhang  53   54 Marcus E Kleber  55   56 Xiuqing Guo  57   58 Henry J Lin  57   58 Francesca Pavani  59 Tessel E Galesloot  60 Raymond Noordam  61 Yuri Milaneschi  62 Katharina E Schraut  63 Marcel den Hoed  64 Frauke Degenhardt  65 Stella Trompet  61   66 Marten E van den Berg  67 Giorgio Pistis  68   69 Yih-Chung Tham  70 Stefan Weiss  71   72 Xueling S Sim  73 Hengtong L Li  70 Peter J van der Most  74 Ilja M Nolte  74 Leo-Pekka Lyytikäinen  28   29   75 M Abdullah Said  1 Daniel R Witte  76 Carlos Iribarren  77   78 Lenore Launer  79 Susan M Ring  9   10 Paul S de Vries  80 Peter Sever  81 Allan Linneberg  82   83 Erwin P Bottinger  13   84 Sandosh Padmanabhan  85 Bruce M Psaty  86 Nona Sotoodehnia  87 Ivana Kolcic  17   18 DCCT/EDIC Research GroupDavid O Arnar  19   88   89 Daniel F Gudbjartsson  19   90 Hilma Holm  19 Beverley Balkau  91   92   93 Claudia T Silva  94 Christopher H Newton-Cheh  95 Kjell Nikus  96   97 Perttu Salo  30   31 Karen L Mohlke  98 Patricia A Peyser  33 Heribert Schunkert  34   99 Mattias Lorentzon  37   100   101 Jari Lahti  102 Dabeeru C Rao  103 Marilyn C Cornelis  104 Jessica D Faul  44 Jennifer A Smith  33   44 Katarzyna Stolarz-Skrzypek  105 Stefania Bandinelli  106 Maria Pina Concas  47 Gianfranco Sinagra  107 Thomas Meitinger  108   109 Melanie Waldenberger  110   111   112 Moritz F Sinner  112   113 Konstantin Strauch  50   51   114 Graciela E Delgado  55 Kent D Taylor  57   58 Jie Yao  57   58 Luisa Foco  59 Olle Melander  115   116 Jacqueline de Graaf  60 Renée de Mutsert  117 Eco J C de Geus  118 Åsa Johansson  119 Peter K Joshi  120 Lars Lind  121 Andre Franke  65 Peter W Macfarlane  122 Kirill V Tarasov  123 Nicholas Tan  70 Stephan B Felix  72   124 E-Shyong Tai  70   125 Debra Q Quek  70 Harold Snieder  74 Johan Ormel  126 Martin Ingelsson  127 Cecilia Lindgren  128 Andrew P Morris  128 Olli T Raitakari  129   130   131 Torben Hansen  5 Themistocles Assimes  6 Vilmundur Gudnason  7   132 Nicholas J Timpson  133   134 Alanna C Morrison  80 Patricia B Munroe  12   135 David P Strachan  136 Niels Grarup  5 Ruth J F Loos  5   13   137 Susan R Heckbert  138 Peter Vollenweider  139 Caroline Hayward  140 Kari Stefansson  19   88 Philippe Froguel  141   142   143 Leif Groop  22   144 Nicholas J Wareham  26 Cornelia M van Duijn  94 Mary F Feitosa  25 Christopher J O'Donnell  145 Mika Kähönen  146   147 Markus Perola  30   31 Michael Boehnke  32 Sharon L R Kardia  33 Jeanette Erdmann  148 Colin N A Palmer  35 Claes Ohlsson  37   149 David J Porteous  150 Johan G Eriksson  151   152   153 Claude Bouchard  41 Susanne Moebus  42   154 Peter Kraft  155 David R Weir  44 Daniele Cusi  45   156 Luigi Ferrucci  46 Sheila Ulivi  47 Giorgia Girotto  47   157 Adolfo Correa  158 Stefan Kääb  112   113 Annette Peters  111   112   159 John C Chambers  53   54   160 Jaspal S Kooner  54   81   161 Winfried März  55   162 Jerome I Rotter  57   58 Andrew A Hicks  59 J Gustav Smith  163   164   165 Lambertus A L M Kiemeney  60 Dennis O Mook-Kanamori  117   166 Brenda W J H Penninx  62 Ulf Gyllensten  119 James F Wilson  120   140 Stephen Burgess  167 Johan Sundström  121 Wolfgang Lieb  168 J Wouter Jukema  66   169   170 Mark Eijgelsheim  67   171 Edward L M Lakatta  123 Ching-Yu Cheng  70   172   173 Marcus Dörr  72   124 Tien-Yin Wong  70   172   174 Charumathi Sabanayagam  70   172 Albertine J Oldehinkel  175 Harriette Riese  126 Terho Lehtimäki  28   29 Niek Verweij  1 Pim van der Harst  176   177   178
Collaborators, Affiliations
Meta-Analysis

Genetic insights into resting heart rate and its role in cardiovascular disease

Yordi J van de Vegte et al. Nat Commun. .

Abstract

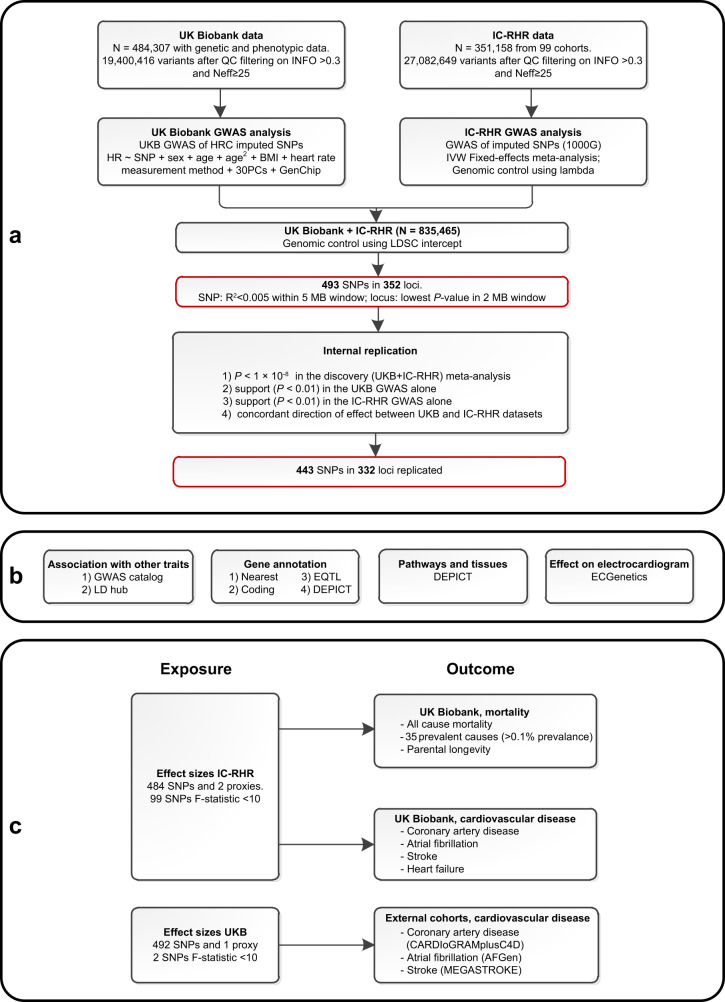
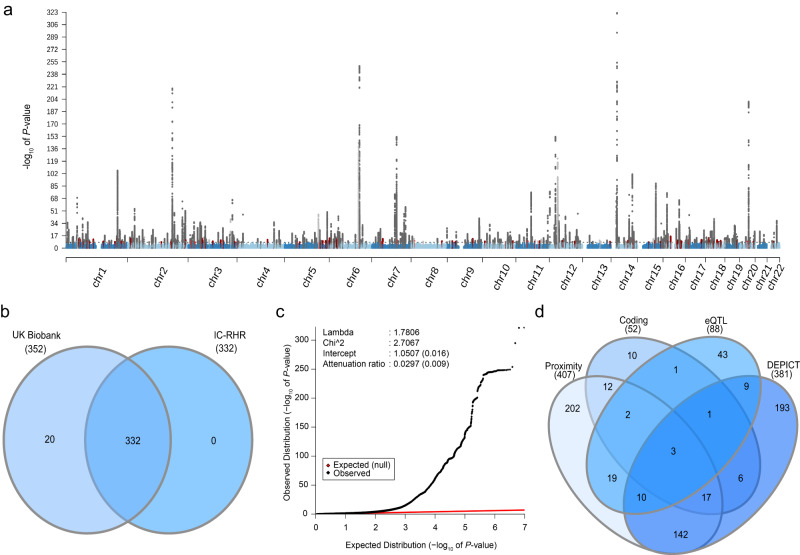
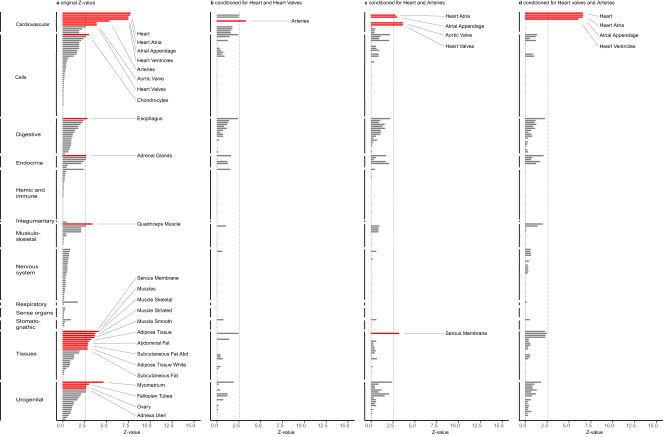
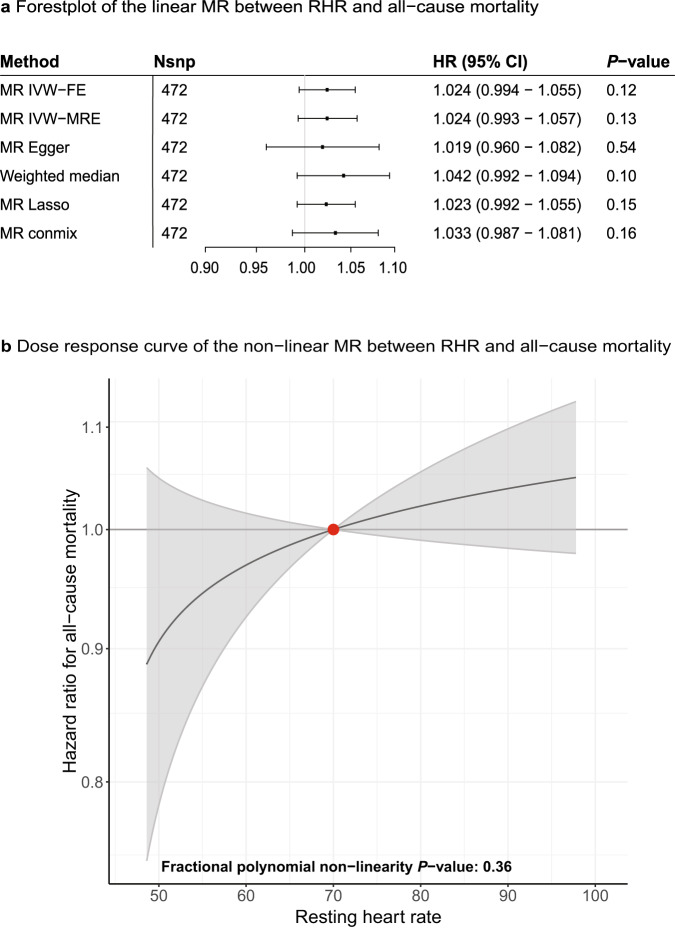
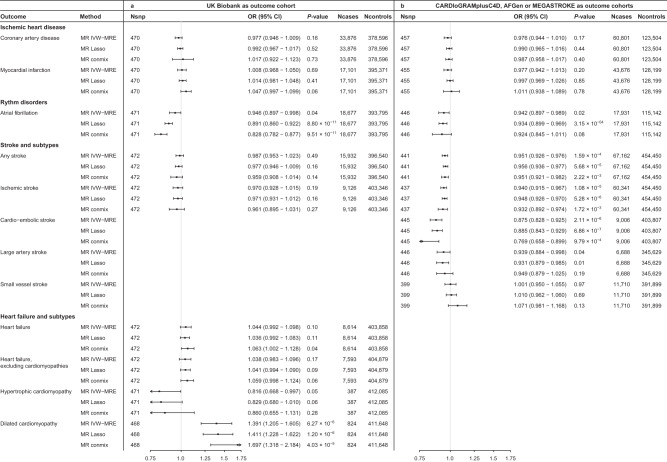
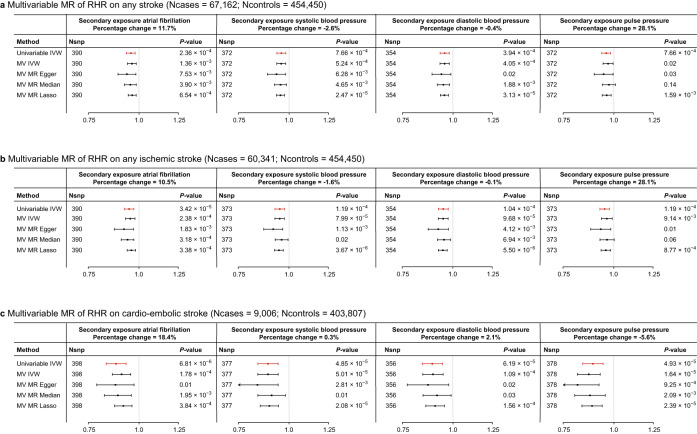
Resting heart rate is associated with cardiovascular diseases and mortality in observational and Mendelian randomization studies. The aims of this study are to extend the number of resting heart rate associated genetic variants and to obtain further insights in resting heart rate biology and its clinical consequences. A genome-wide meta-analysis of 100 studies in up to 835,465 individuals reveals 493 independent genetic variants in 352 loci, including 68 genetic variants outside previously identified resting heart rate associated loci. We prioritize 670 genes and in silico annotations point to their enrichment in cardiomyocytes and provide insights in their ECG signature. Two-sample Mendelian randomization analyses indicate that higher genetically predicted resting heart rate increases risk of dilated cardiomyopathy, but decreases risk of developing atrial fibrillation, ischemic stroke, and cardio-embolic stroke. We do not find evidence for a linear or non-linear genetic association between resting heart rate and all-cause mortality in contrast to our previous Mendelian randomization study. Systematic alteration of key differences between the current and previous Mendelian randomization study indicates that the most likely cause of the discrepancy between these studies arises from false positive findings in previous one-sample MR analyses caused by weak-instrument bias at lower P-value thresholds. The results extend our understanding of resting heart rate biology and give additional insights in its role in cardiovascular disease development.


Conflict of interest statement

N.V. is currently employed at Regeneron plc. The 23andMe Research team members are current or former employees of 23andMe, Inc. and hold stock or stock options in 23andMe. P. Sever has received research awards from Pfizer Inc. I.N. is now a full-time employee at Gilead. B.M.P. serves on the Steering Committee of the Yale Open Data Access Project funded by Johnson & Johnson. K.S., H.H., D.F.G., D.O.A., and G.S. are employees of deCODE genetics/Amgen Inc. C.R. is currently employed at the Broad institute and is supported by a grant from Bayer AG to the Broad Institute focused on the development of therapeutics for cardiovascular disease. M.L. receives consulting or lecturing fees from Amgen, Astellas, UCB, Consilient Health, GE/Lunar, Tromp/Hologic, Renapharma, Meda/Mylan, Janssen-Cilag and Radius Health. W.M. is employed with Synlab Holding Deutschland GmbH. M.E.K. is employed with Synlab Holding Deutschland GmbH and reports grants and personal fees from AMGEN, BASF, Sanofi, Siemens Diagnostics, Aegerion Pharmaceuticals, Astrazeneca, Danone Research, Numares, Pfizer, Hoffmann LaRoche; personal fees from MSD, Alexion; grants from Abbott Diagnostics, all outside the submitted work. The remaining authors declare no competing interests.

Figures

Fig. 1
Fig. 1. Study flowchart showing the study design, in silico annotations, and functional analyses.
a Schematic overview of the study design for the discovery and replication of genetic loci associated with resting heart rate (RHR) using mixed linear models with a two-sided P-value of P < × 10−8 to define genome-wide significance. A genome-wide significant genetic variant was considered replicated if P < 0.01 in the UK Biobank and IC-RHR cohort with concordant effect sizes. The black-bordered boxes show the methodology, the red-bordered boxes show the most important results. b Analyses performed to evaluate RHR-associated genetic variants and to gain further insights into the underlying biology. c Schematic presentation of the two-sample Mendelian randomization analyses of genetically predicted RHR on mortality and cardiovascular diseases. Effect sizes were taken from the IC-RHR data to test the associations with mortality and cardiovascular diseases in the UK Biobank. Effect sizes were taken from the UK Biobank to test the association with coronary artery disease and myocardial infarction in the CARDIoGRAMplusC4D cohort, atrial fibrillation in the AFGen cohort, and any, ischemic, cardio-embolic, large artery and small vessel stroke within the MEGASTROKE consortium. BMI body mass index, GWAS genome-wide association study, HRC Haplotype Reference Panel, IC-RHR International Consortium for Resting Heart Rate, MB megabase, N sample size, Neff effective sample size, PC principal components, RHR resting heart rate, SNPs single nucleotide polymorphisms, QC quality control, 1000G = 1000 Genomes.
Fig. 2
Fig. 2. Overview of the findings in the genome-wide association study and in silico search of candidate causal genes.
a Manhattan plot showing the −log10(P-value) for the association of all genotyped or imputed genetics variants with resting heart rate (RHR) assessed using mixed linear models. Red indicates novel and internally replicated RHR-associated loci and black indicates novel but unreplicated RHR-associated loci. Dark gray indicates RHR-associated genetic variants within 1 MB of previously identified RHR-associated loci, which were internally replicated in the current study. Light gray indicates RHR-associated genetic variants within 1 MB of previously identified RHR-associated loci, which were not internally replicated in the current study. A two-sided P-value of P < 1 × 10−8 was used to define genome-wide significance. A genome-wide significant genetic variant was considered replicated if P < 0.01 in the UK Biobank and IC-RHR cohort with concordant effect sizes. b Venn diagram of the 352 identified loci. Of the 352 loci, 332 were internally replicated. c Quantile–quantile (QQ) plot of the final meta-analysis. The black dots represent the observed statistic for the genotyped genetic variants against the corresponding expected statistic. The linkage disequilibrium score regression intercept after the final meta-analysis was 1.051, suggesting little evidence of genomic inflation due to non-polygenic signal. d Venn diagram of the prioritization of the 670 unique candidate causal genes as identified by one or multiple strategies. Venn plot shows the overlap of genes tagged by one or multiple strategies, including (1) by proximity, the nearest gene or any gene within 10 kb; (2) genes containing coding variants in LD with RHR-associated variants at R2 > 0.8; (3) eQTL genes in LD (R2 > 0.8) with RHR-associated variants which achieved a Bonferroni corrected two-sided P = 2.65 × 10−7 and passed the HEIDI test at a P > 0.05; and (4) DEPICT genes which achieved multiple hypotheses corrected FDR < 0.05. DEPICT data-driven expression prioritized integration for complex traits, eQTL expression quantitative trait loci.
Fig. 3
Fig. 3. Conditional analyses of tissue enrichment by DEPICT emphasizes cardiac tissue for RHR biology.
a Results of the DEPICT tissue enrichment analysis. The Y-axis shows the tissues clustered by the first MeSH term, ordered on Z-value per cluster. The X-axis shows the Z-value. A multiple comparisons corrected two-sided FDR < 0.05, corresponding to a P-value < 9.75 × 10−3 and Z-value of 2.585, was considered to be statistically significant. Significant tissues are plotted in red and annotated, other tissues are plotted in gray. Conditional analyses were performed by correcting for the tissue with the highest Z-value to investigate whether significant tissues were independently associated with RHR. Not a single tissue remained significant at an FDR < 0.05 after three consecutive corrections (for the heart, heart valve, and arteries). Panel bd shows Z-values of all tissues after consecutive correction for respectively heart and heart valves, heart and arteries, and heart valve and arteries. This jointly provides information on which the other tissues are co-dependent. FDR false discovery rate.
Fig. 4
Fig. 4. Mendelian randomization shows absence of linear and non-linear associations between genetically predicted RHR and all-cause mortality.
Linear and non-linear Mendelian randomization analyses were performed to test the association between genetically predicted RHR and all-cause mortality. a Forest plot of the linear MR analyses between genetically predicted RHR and all-cause mortality (Ncases = 16,289, Ncontrol = 396,183). With a single outcome, a two-sided P-value of P < 0.05 was considered significant. Hazard ratios and 95% confidence intervals are shown. The X-axis shows hazard ratio’s on a log10 scale, the center as indicated by a gray line depicts a hazard ratio of 1. b Dose–response curve of the non-linear MR analyses between genetically predicted RHR and all-cause mortality (Ncases = 16,039, Ncontroles = 394,144). The comparisons are conducted within strata and therefore the graph provides information on the expected average change in the outcome if a person with an RHR of (say) 70 bpm instead had an RHR value of 90 bpm. The gradient at each point of the curve is the localized average causal effect. Shaded areas represent 95% confidence intervals. With a single outcome, a two-sided fractional polynomial non-linearity P-value of P < 0.05 was considered significant. The X-axis shows RHR, the Y-axis shows hazard ratios. The center as indicated by a dark gray line depicts a hazard ratio of 1. RHR resting heart rate, HR hazard ratio, CI confidence interval, MR Mendelian randomization, IVW inverse variance weighted, FE fixed effects, MRE multiplicative random effects.
Fig. 5
Fig. 5. Mendelian randomization of genetically predicted RHR on cardiovascular diseases.
Forestplots of the linear Mendelian randomization analyses of resting heart rate (RHR) on cardiovascular diseases. Effect sizes were taken from the IC-RHR data to test the associations with mortality and cardiovascular diseases in the UK Biobank (panel a). Effect sizes were taken from the UK Biobank to test the association with cardiovascular diseases in the CARDIoGRAMplusC4D, AFGen, and MEGASTROKE consortia (panel b). Results of the MR-IVW, outlier-robust MR-Lasso, and plurality valid MR-Mix are provided. Sample sizes vary per outcome and per cohort and are shown in the figure. Odds ratios and 95% confidence intervals are shown. The X-axis shows odds ratio’s on a log10 scale, the center as indicated by a gray line depicts an odds ratio of 1. RHR resting heart rate, MR Mendelian randomization, IVW inverse variance weighted multiplicative random effects, OR odds ratio, CI confidence interval.
Fig. 6
Fig. 6. Multivariable Mendelian randomization reveals pulse pressure and atrial fibrillation as potential mediators of the association of genetically predicted RHR with ischemic and cardio-embolic stroke, respectively.
Forestplots of the results of the two-sample multivariable Mendelian randomization analyses of resting heart rate on a any stroke (Ncases = 67,162; Ncontrols = 454,450), b ischemic stroke (Ncases = 60,341; Ncontrols = 454,450) and c cardio-embolic stroke (Ncases = 9006; Ncontrols = 403,807), when using atrial fibrillation, systolic, diastolic and pulse pressure as secondary exposures. Shown in red are the univariable Mendelian randomization estimates which represent the total estimates of resting heart rate on the outcome. In black are the multivariable Mendelian randomization estimates, which show the direct effect of RHR when corrected for the secondary exposure. These results indicate that atrial fibrillation attenuates the beneficial effect of a higher resting heart rate on cardio-embolic stroke, while pulse pressure attenuates the beneficial effect on any ischemic stroke. MR-Steiger sensitivity analysis indicated that the association between the RHR-associated genetic variants and pulse pressure is unlikely mediated through RHR entirely and biological pleiotropic effects are therefore more likely to cause the attenuation of the association between RHR and stroke when correcting for pulse pressure. Odds ratios and 95% confidence intervals are shown. The X-axis shows odds ratio’s on a log10 scale, the center as indicated by a gray line depicts an odds ratio of 1. RHR resting heart rate; MV multivariable, Nsnp number of SNPs.

Similar articles

Cited by

References

    1. Jouven X, et al. Heart-rate profile during exercise as a predictor of sudden death. N. Engl. J. Med. 2005;352:1951–1958. - PubMed
    1. Zhang D, Wang W, Li F. Association between resting heart rate and coronary artery disease, stroke, sudden death and noncardiovascular diseases: a meta-analysis. Can. Med. Assoc. J. 2016;188:E384–E392. - PMC - PubMed
    1. Münzel T, et al. Heart rate, mortality, and the relation with clinical and subclinical cardiovascular diseases: results from the Gutenberg Health Study. Clin. Res. Cardiol. 2019;108:1313–1323. - PMC - PubMed
    1. O’Neal WT, et al. Heart rate and ischemic stroke: the reasons for geographic and racial differences in stroke (REGARDS) study. Int. J. Stroke. 2015;10:1229–1235. - PMC - PubMed
    1. Lonn EM, et al. Heart rate is associated with increased risk of major cardiovascular events, cardiovascular and all-cause death in patients with stable chronic cardiovascular disease: an analysis of ONTARGET/TRANSCEND. Clin. Res. Cardiol. 2014;103:149–159. - PubMed

Publication types

MeSH terms