

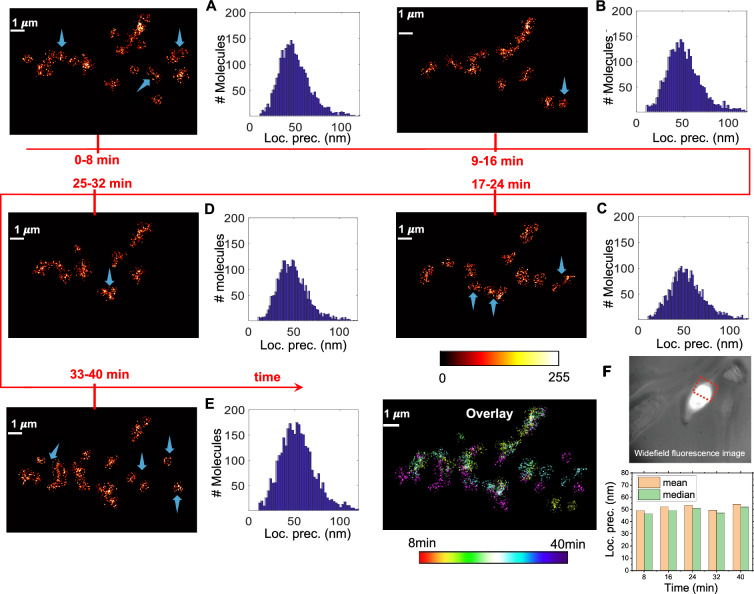
Temporally resolved SMLM (with large PAR shift) enabled visualization of dynamic HA cluster formation and migration in a live cell
- PMID: 37532749
- PMCID: PMC10397235
- DOI: 10.1038/s41598-023-39096-4
Temporally resolved SMLM (with large PAR shift) enabled visualization of dynamic HA cluster formation and migration in a live cell
Abstract
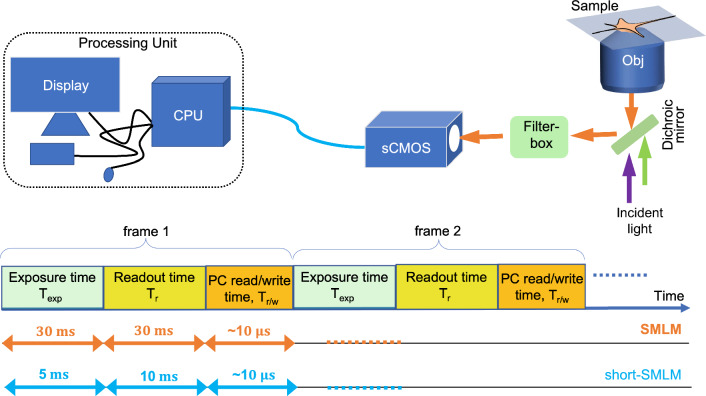
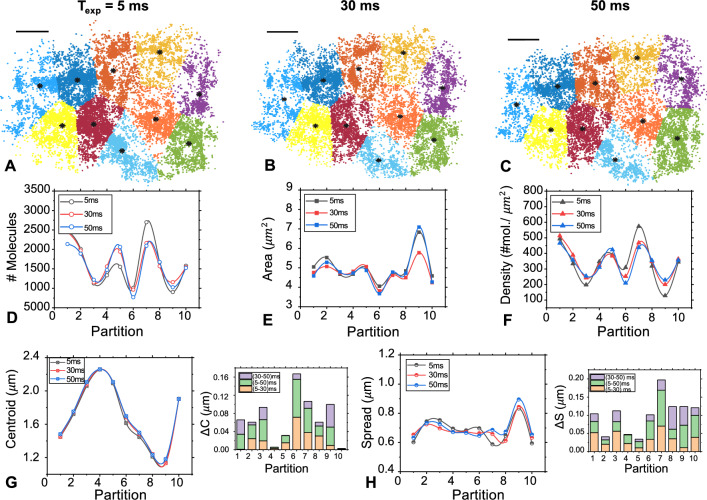
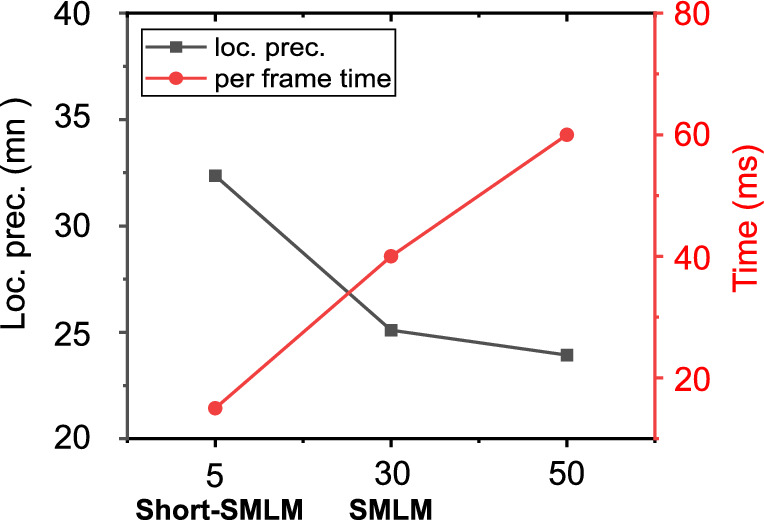
The blinking properties of a single molecule are critical for single-molecule localization microscopy (SMLM). Typically, SMLM techniques involve recording several frames of diffraction-limited bright spots of single-molecules with a detector exposure time close to the blinking period. This sets a limit on the temporal resolution of SMLM to a few tens of milliseconds. Realizing that a substantial fraction of single molecules emit photons for time scales much shorter than the average blinking period, we propose accelerating data collection to capture these fast emitters. Here, we put forward a short exposure-based SMLM (shortSMLM) method powered by sCMOS detector for understanding dynamical events (both at single molecule and ensemble level). The technique is demonstrated on an Influenza-A disease model, where NIH3T3 cells (both fixed and live cells) were transfected by Dendra2-HA plasmid DNA. Analysis shows a 2.76-fold improvement in the temporal resolution that comes with a sacrifice in spatial resolution, and a particle resolution shift PAR-shift (in terms of localization precision) of [Formula: see text] 11.82 nm compared to standard SMLM. We visualized dynamic HA cluster formation in transfected cells post 24 h of DNA transfection. It is noted that a reduction in spatial resolution does not substantially alter cluster characteristics (cluster density, [Formula: see text] molecules/cluster, cluster spread, etc.) and, indeed, preserves critical features. Moreover, the time-lapse imaging reveals the dynamic formation and migration of Hemagglutinin (HA) clusters in a live cell. This suggests that [Formula: see text] using a synchronized high QE sCMOS detector (operated at short exposure times) is excellent for studying temporal dynamics in cellular system.
© 2023. The Author(s).
Conflict of interest statement
The authors declare no competing interests.
Figures


References
MeSH terms
Substances
LinkOut - more resources
Full Text Sources
