Comment
. 2023 Aug;620(7972):E1-E6.
doi: 10.1038/s41586-023-06292-1. Epub 2023 Aug 2.

Revisiting the intrinsic mycobiome in pancreatic cancer

Affiliations
Comment

Revisiting the intrinsic mycobiome in pancreatic cancer

Ashley A Fletcher et al. Nature. 2023 Aug.

Abstract

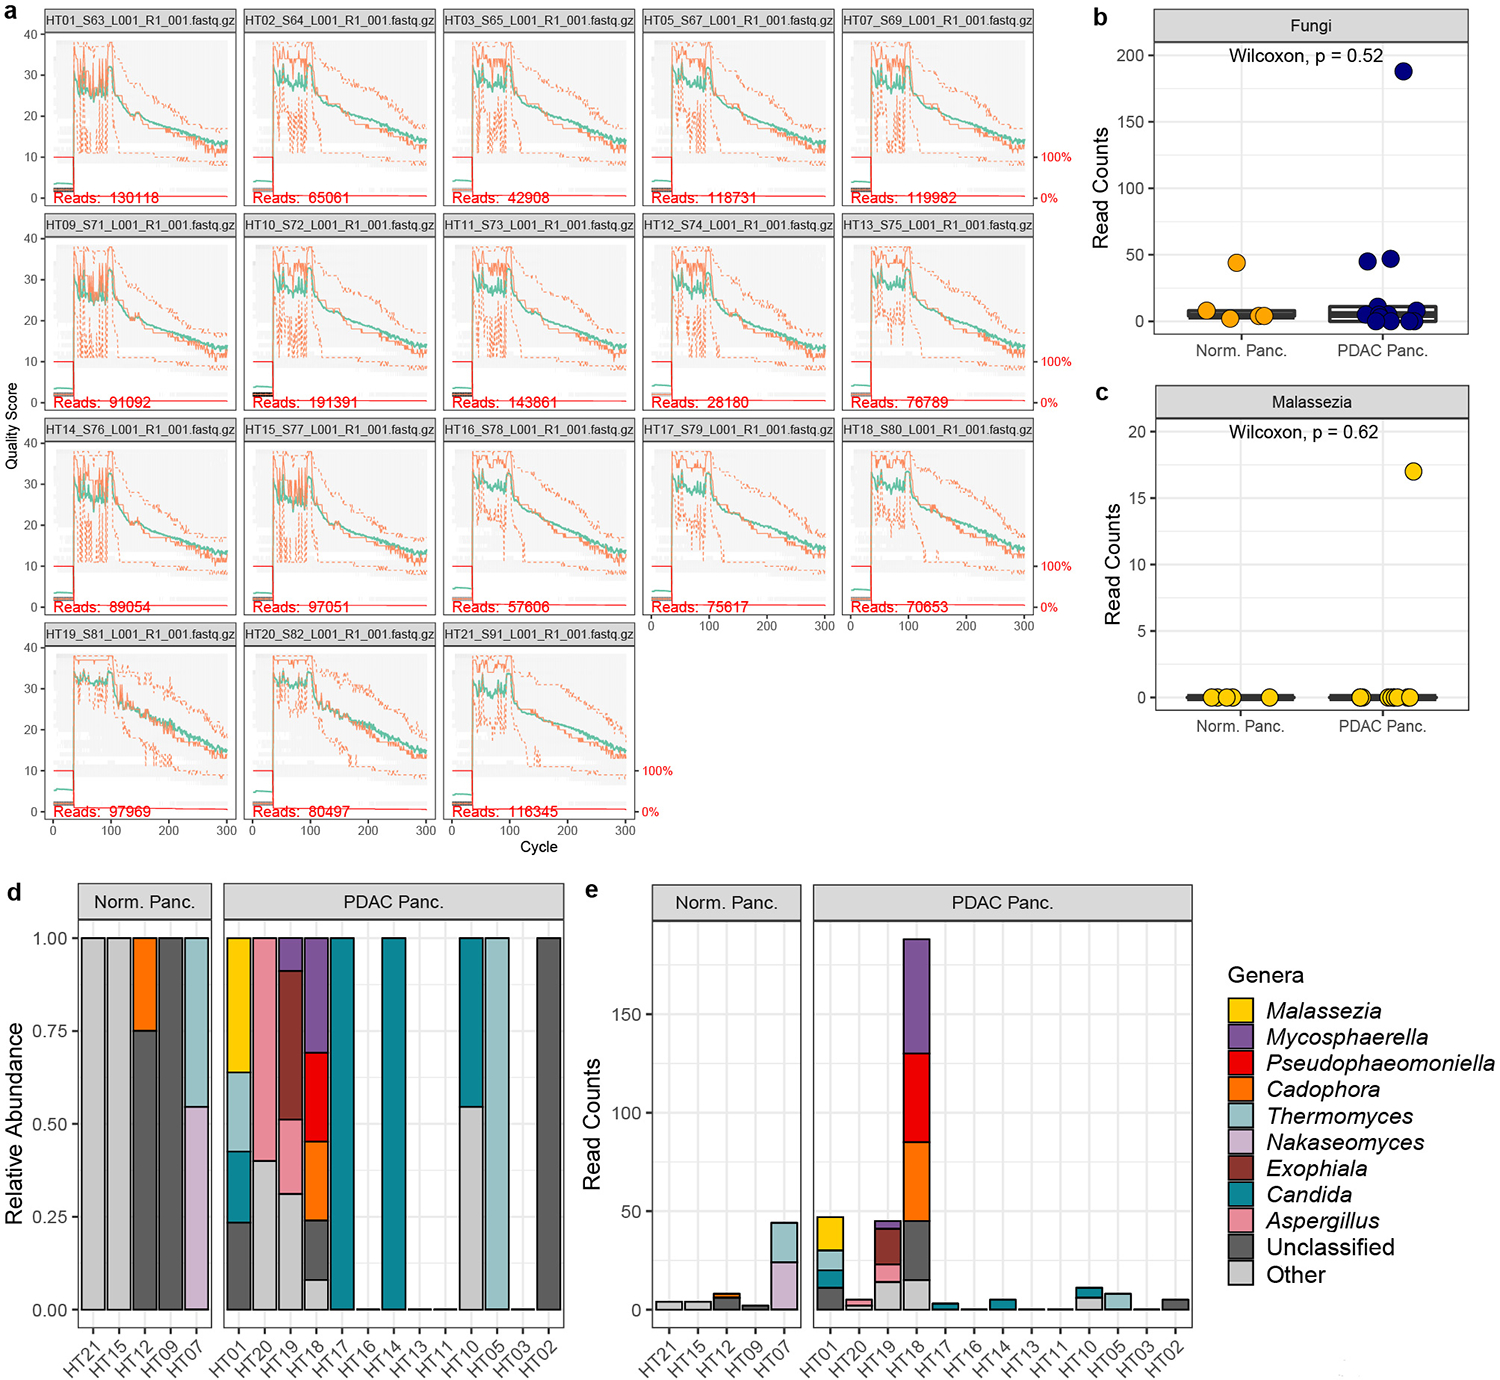
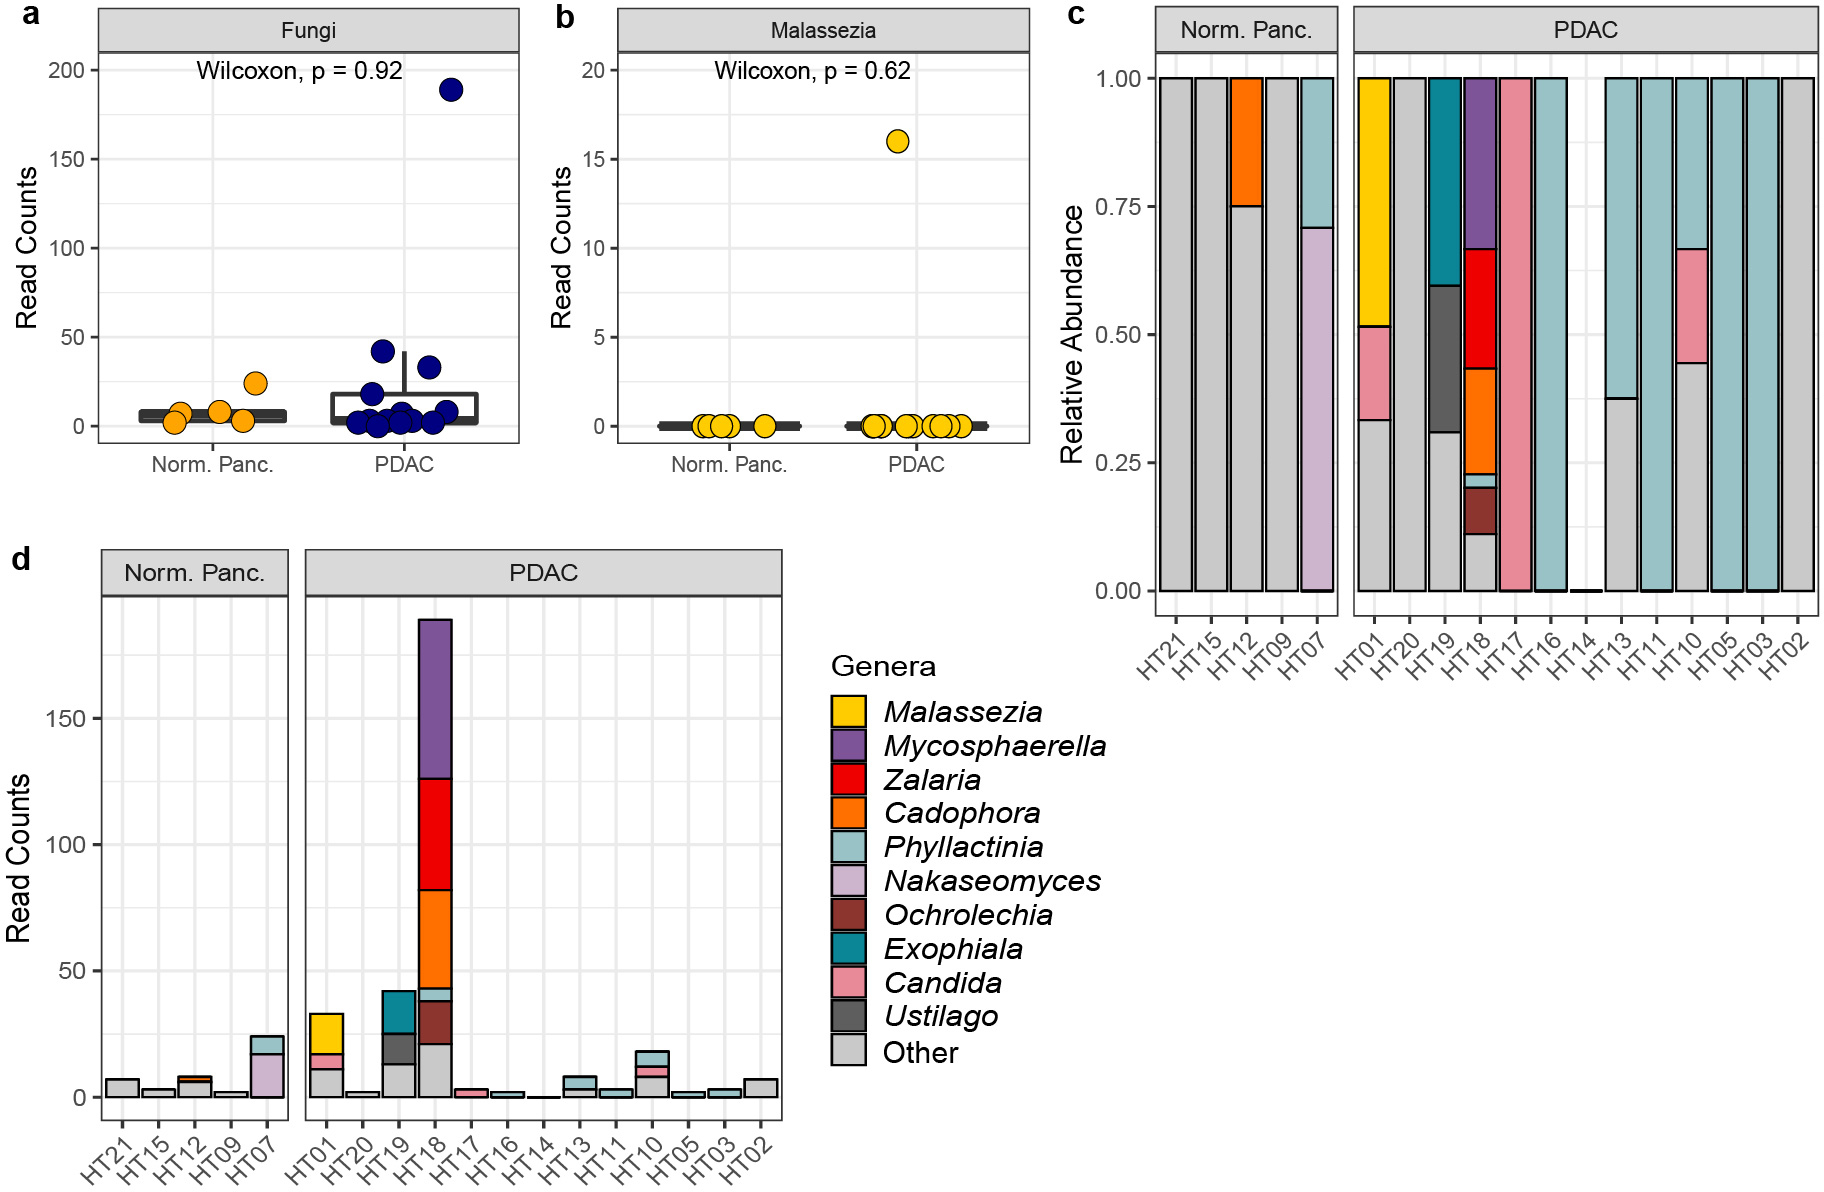
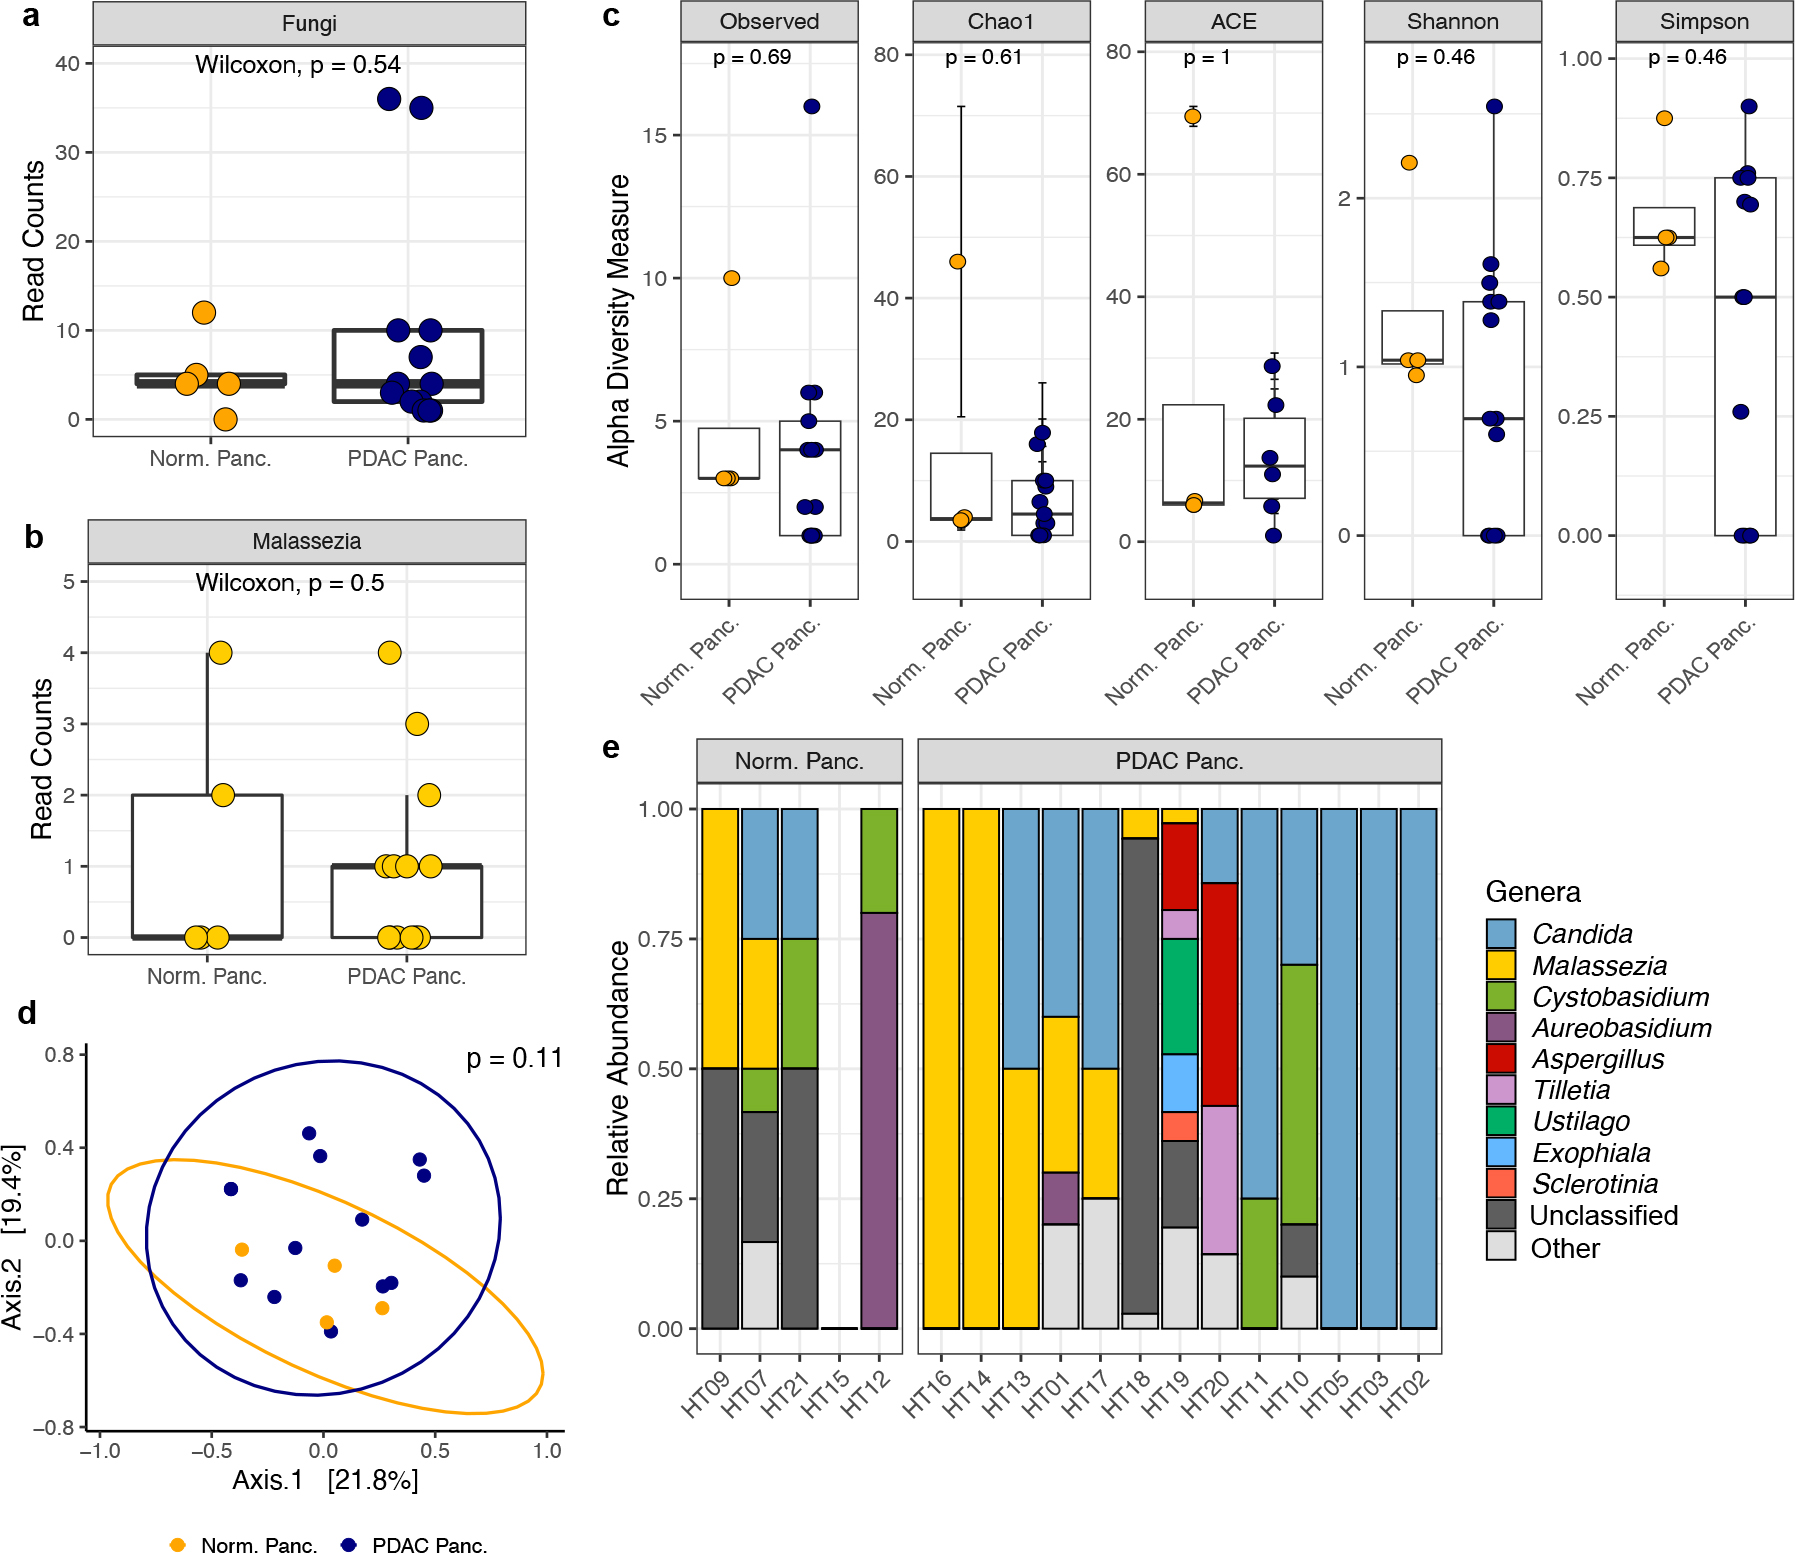
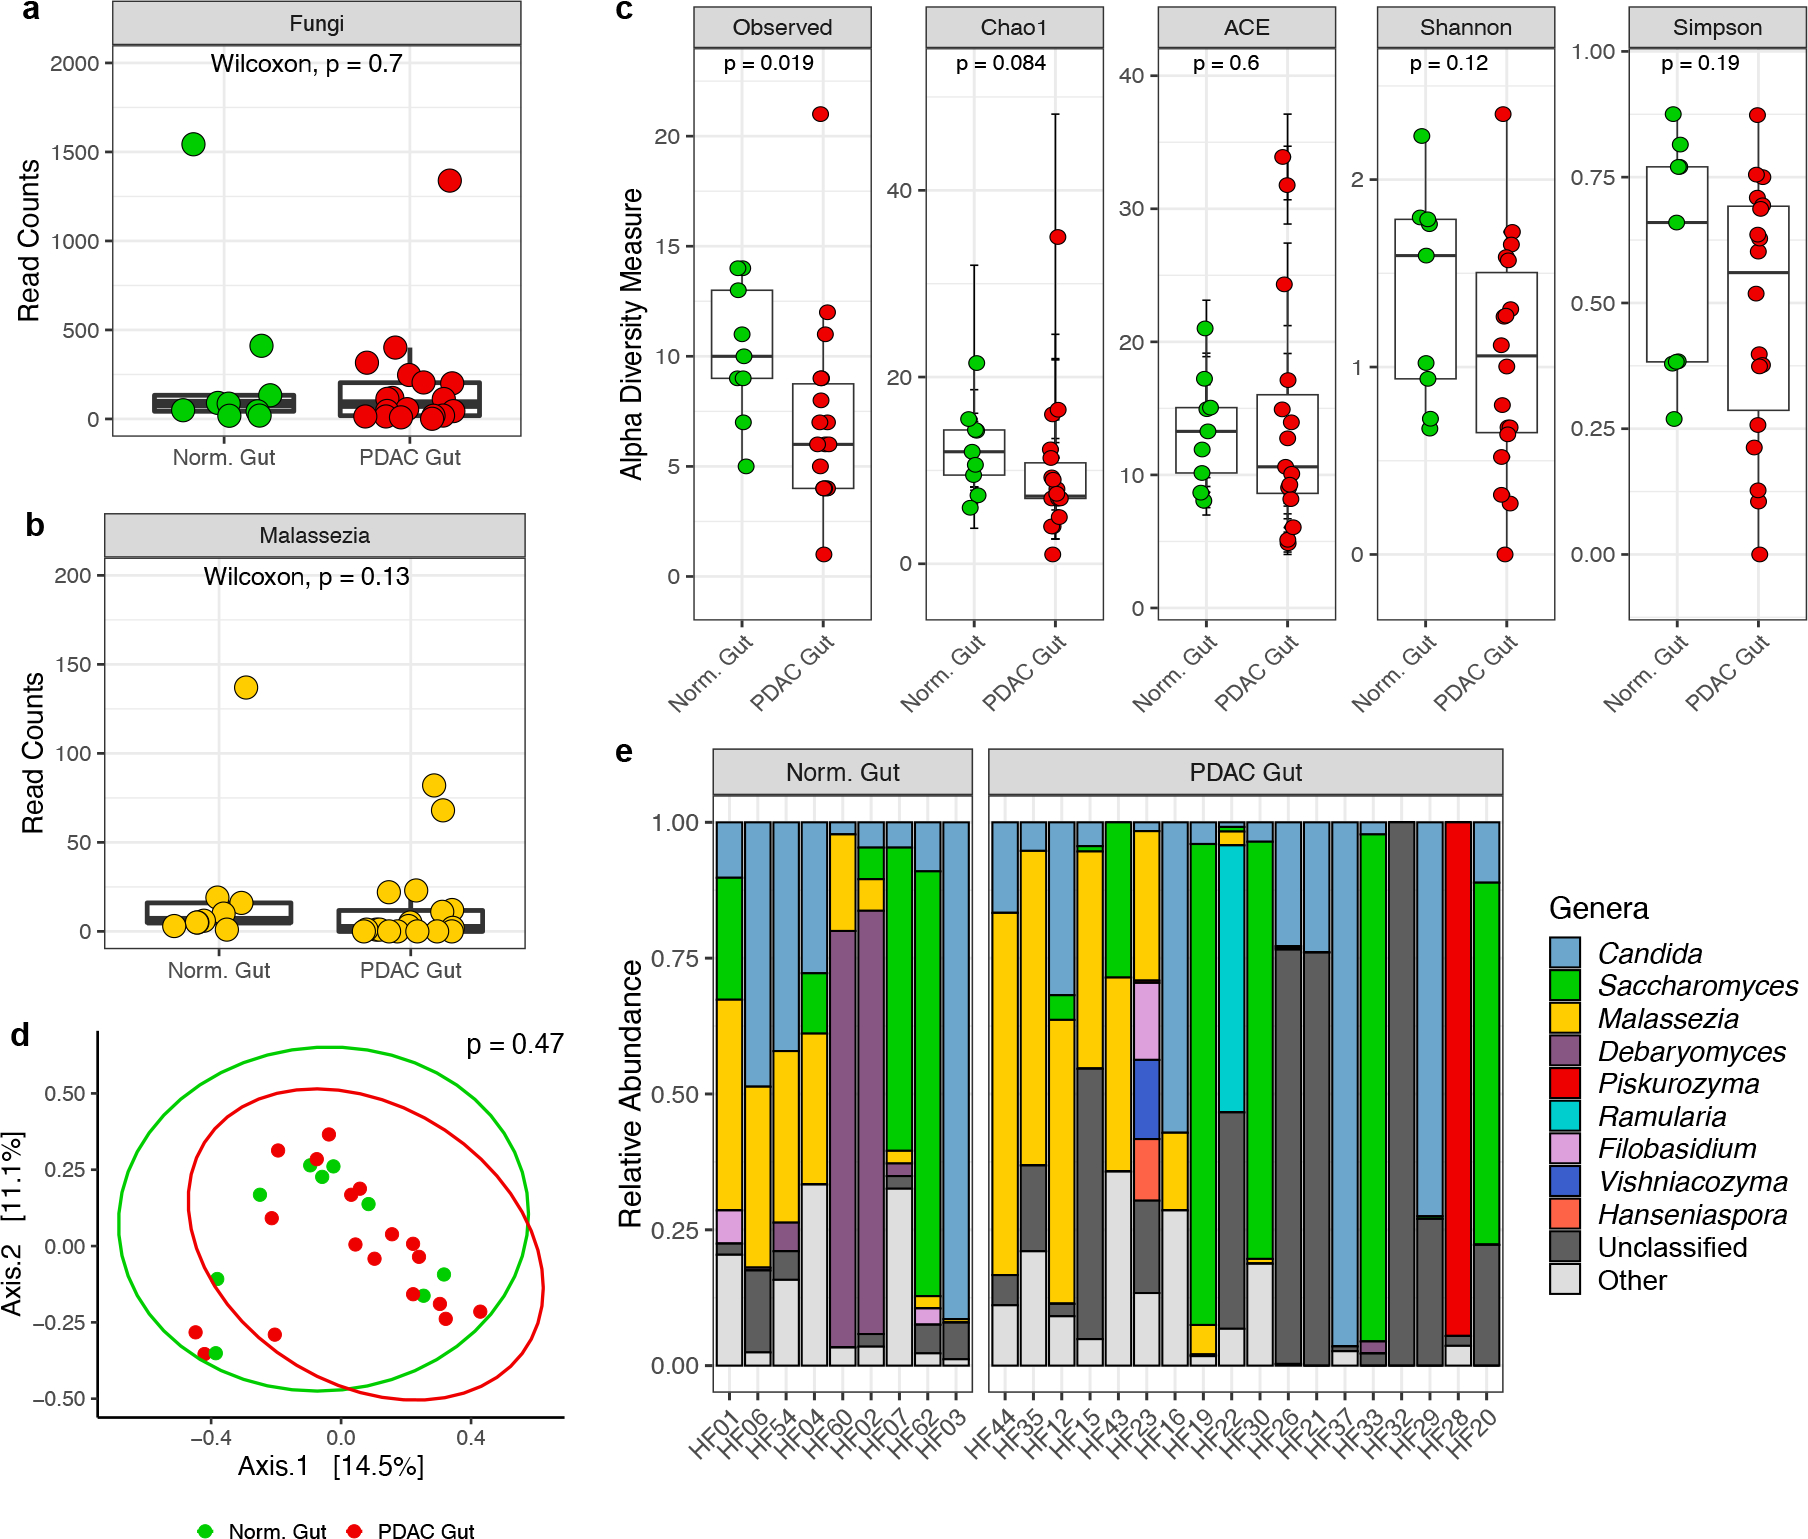
A growing body of literature suggests that alterations in the human microbiome are causative of disease initiation and progression. Aykut et al. present data supporting the argument that alterations in the gut fungal microbiome (the “mycobiome”), along with the presence of fungal elements within pancreatic tissue (specifically those of the genus Malassezia), are associated with pancreatic oncogenesis. Upon analyzing the human sequencing data presented in the original manuscript, we found few fungal reads in pancreatic tissue samples and did not identify differences in pancreatic or gut mycobiome composition between healthy and pancreatic ductal adenocarcinoma (PDAC) patients. Our re-analysis of these data does not support an association between an intrinsic pancreatic mycobiome and the development of human PDAC, and illustrates the challenges in analyzing microbiome sequencing data from low biomass samples.


Conflict of interest statement

Competing interests

The authors declare no competing interests.

Figures

Extended Data Fig. 1 |
Extended Data Fig. 1 |. DADA2 analysis by Fletcher et al. of ITS sequencing data from Aykut et al. human pancreatic tissue samples.
a, Quality plot of raw sequencing reads. The y-axis represents the Phred quality score and the x-axis represents the cycle, which corresponds to the base position of sequencing reads. The mean quality score at each base position is shown by a green line and the quartiles of the quality score distribution are shown by orange lines. The number of sequencing reads in each sample is shown in red font. The red line shows the scaled proportion of reads that extend to at least that position. b, Box plots depicting fungal reads in normal pancreas tissue (n=5 biologically independent samples) and pancreatic ductal adenocarcinoma (PDAC) tissue (n=13 biologically independent samples) c, Box plots depicting sequencing reads assigned to the fungal genus Malassezia in normal pancreas (n=5 biologically independent samples) and PDAC tissue (n=13 biologically independent samples). d, Relative abundances, and e, read counts of the top ten fungal genera in pancreatic tissue samples from healthy individuals and patients with PDAC. Box plot minima and maxima bounds represent the 25th and 75th percentiles, respectively; the centre bound represents the median. Whiskers extend to 1.5 times the interquartile range (IQR). P values were estimated using two-sided Wilcoxon rank-sum tests (b, c). Individual data points are shown.
Extended Data Fig. 2 |
Extended Data Fig. 2 |. DADA2 analysis by Duke Genomic Analysis and Bioinformatics Core of ITS sequencing data from Aykut et al. human pancreatic tissue samples.
a, Box plots depicting fungal reads in normal pancreas tissue (n=5 biologically independent samples) and pancreatic ductal adenocarcinoma (PDAC) tissue (n=13 biologically independent samples) b, Box plots depicting sequencing reads assigned to the fungal genus Malassezia in normal pancreas tissue (n=5 biologically independent samples) and PDAC tissue (n=13 biologically independent samples). c, Relative abundances, and d, read counts of the top ten fungal genera in pancreatic tissue samples from healthy individuals and patients with PDAC. Box plot minima and maxima bounds represent the 25th and 75th percentiles, respectively; the centre bound represents the median. Whiskers extend to 1.5 times the interquartile range (IQR). P values were estimated using two-sided Wilcoxon rank-sum tests (a, b). Individual data points are shown.
Fig. 1 |
Fig. 1 |. QIIME2 re-analysis of human pancreatic ITS sequencing data made publicly available by Aykut et al.
a, Box plots depicting total fungal reads in normal pancreas tissue (n=5 biologically independent samples) and pancreatic ductal adenocarcinoma (PDAC) tissue (n=13 biologically independent samples). b, Box plots depicting sequencing reads assigned to the fungal genus Malassezia in normal pancreas tissue (n=5 biologically independent samples) and PDAC tissue (n=13 biologically independent samples). c, Alpha diversity measures of normal pancreas tissue (n=4 biologically independent samples) and PDAC tissue (n=13 biologically independent samples). Diversity measures shown are the number of observed taxa, the Chao1 index, abundance-based coverage estimates (ACE), and the Shannon and Simpson’s indices. d, Non-metric multi-dimensional scaling plot of normal pancreas tissue (n=4 biologically independent samples) and PDAC tissue (n=13 biologically independent samples) fungal communities, based on Bray–Curtis dissimilarity. e, Relative abundances of the top ten fungal genera identified in normal and PDAC pancreatic tissue samples. Box plot minima and maxima bounds represent the 25th and 75th percentiles, respectively; the centre bound represents the median (a, b, c). Whiskers extend to 1.5 times the interquartile range (IQR) (a, b), and data in c are presented as mean ± SEM after a single sample with zero fungal reads was dropped from the analysis. P values were estimated using two-sided Wilcoxon rank-sum tests (a, b, c) or two-way PERMANOVA (d). Individual data points are shown.
Fig. 2 |
Fig. 2 |. QIIME2 re-analysis of human fecal ITS sequencing data made publicly available by Aykut et al.
a, Box plots depicting fungal reads in normal gut (n=9 biologically independent samples) and pancreatic ductal adenocarcinoma (PDAC) gut (n=18 biologically independent samples). b, Box plots depicting sequencing reads assigned to the fungal genus Malassezia in normal gut (n=9 biologically independent samples) and PDAC gut (n=18 biologically independent samples). c, Alpha diversity measures of normal gut (n=9 biologically independent samples) and PDAC gut (n=18 biologically independent samples), including the number of observed taxa, the Chao1 index, abundance-based coverage estimates (ACE), and the Shannon and Simpson’s indices. d, Non-metric multi-dimensional scaling plot of normal gut (n=9 biologically independent samples) and PDAC gut (n=18 biologically independent samples), based on Bray–Curtis dissimilarity. e, Relative abundances of the top ten fungal genera in fecal samples from healthy individuals and patients with PDAC. Box plot minima and maxima bounds represent the 25th and 75th percentiles, respectively; the centre bound represents the median. Individual (a, b, c). Whiskers extend to 1.5 times the interquartile range (IQR) (a, b), and data in c are presented as mean ± SEM. P values were estimated using two-sided Wilcoxon rank-sum tests (a, b, c) or two-way PERMANOVA (d). Individual data points are shown.

Comment in

Comment on

  • The fungal mycobiome promotes pancreatic oncogenesis via activation of MBL.
    Aykut B, Pushalkar S, Chen R, Li Q, Abengozar R, Kim JI, Shadaloey SA, Wu D, Preiss P, Verma N, Guo Y, Saxena A, Vardhan M, Diskin B, Wang W, Leinwand J, Kurz E, Kochen Rossi JA, Hundeyin M, Zambrinis C, Li X, Saxena D, Miller G. Aykut B, et al. Nature. 2019 Oct;574(7777):264-267. doi: 10.1038/s41586-019-1608-2. Epub 2019 Oct 2. Nature. 2019. PMID: 31578522 Free PMC article.

References

    1. Aykut B et al. The fungal mycobiome promotes pancreatic oncogenesis via activation of MBL. Nature 574, 264–267, doi:10.1038/s41586-019-1608-2 (2019). - DOI - PMC - PubMed
    1. Callahan BJ et al. DADA2: High-resolution sample inference from Illumina amplicon data. Nat Methods 13, 581–583, doi:10.1038/nmeth.3869 (2016). - DOI - PMC - PubMed
    1. Caporaso JG et al. QIIME allows analysis of high-throughput community sequencing data. Nat Methods 7, 335–336, doi:10.1038/nmeth.f.303 (2010). - DOI - PMC - PubMed
    1. Prodan A et al. Comparing bioinformatic pipelines for microbial 16S rRNA amplicon sequencing. PLoS One 15, e0227434, doi:10.1371/journal.pone.0227434 (2020). - DOI - PMC - PubMed
    1. Edgar RC Accuracy of microbial community diversity estimated by closed- and open-reference OTUs. PeerJ 5, e3889, doi:10.7717/peerj.3889 (2017). - DOI - PMC - PubMed