. 2023 Aug;620(7973):402-408.
doi: 10.1038/s41586-023-06372-2. Epub 2023 Aug 2.

Pharmacological targeting of netrin-1 inhibits EMT in cancer

Affiliations

Pharmacological targeting of netrin-1 inhibits EMT in cancer

Justine Lengrand et al. Nature. 2023 Aug.

Abstract

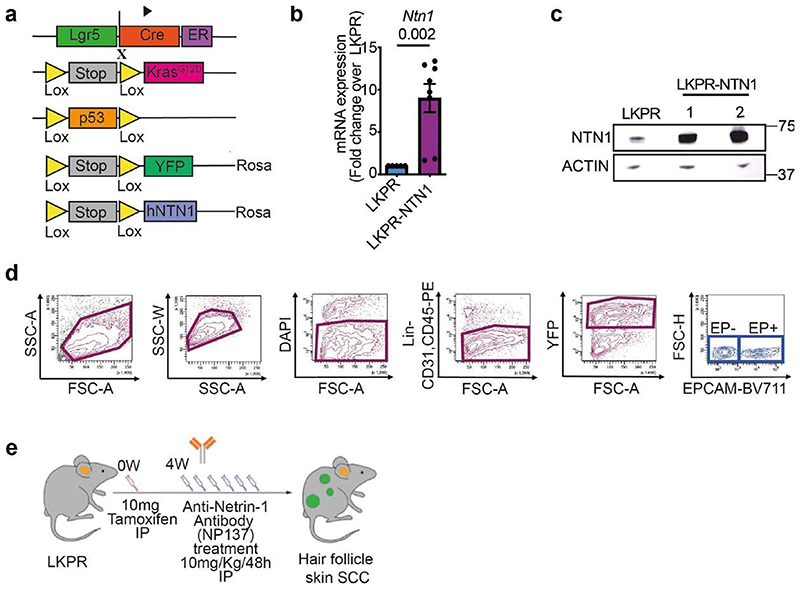
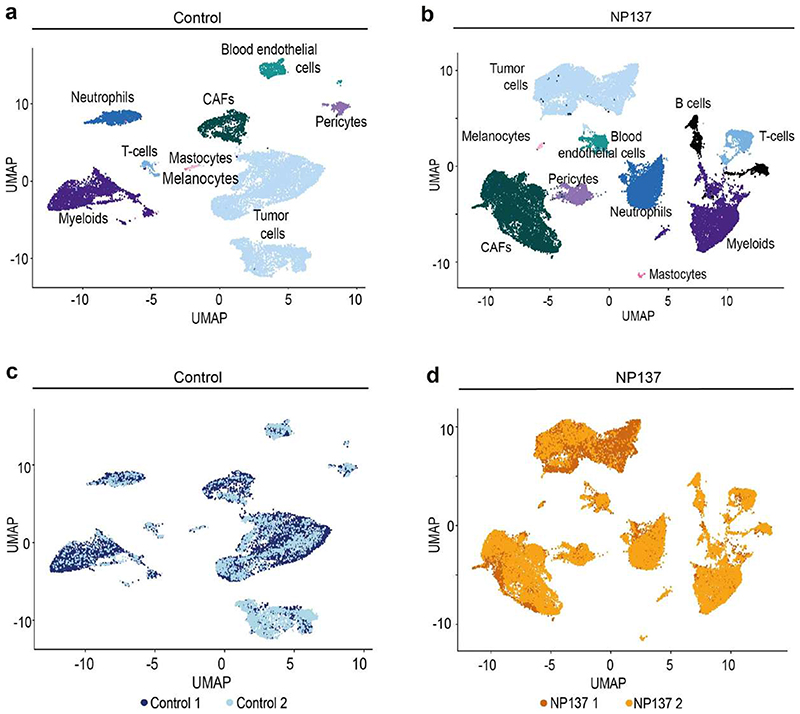
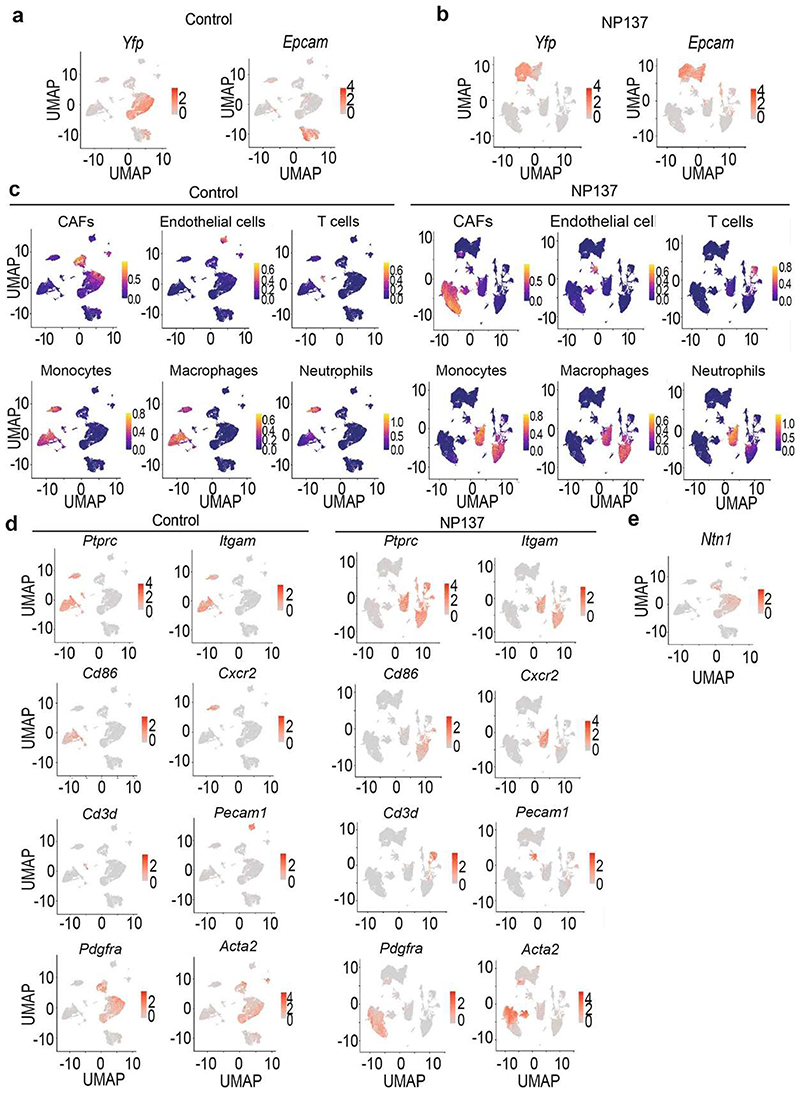
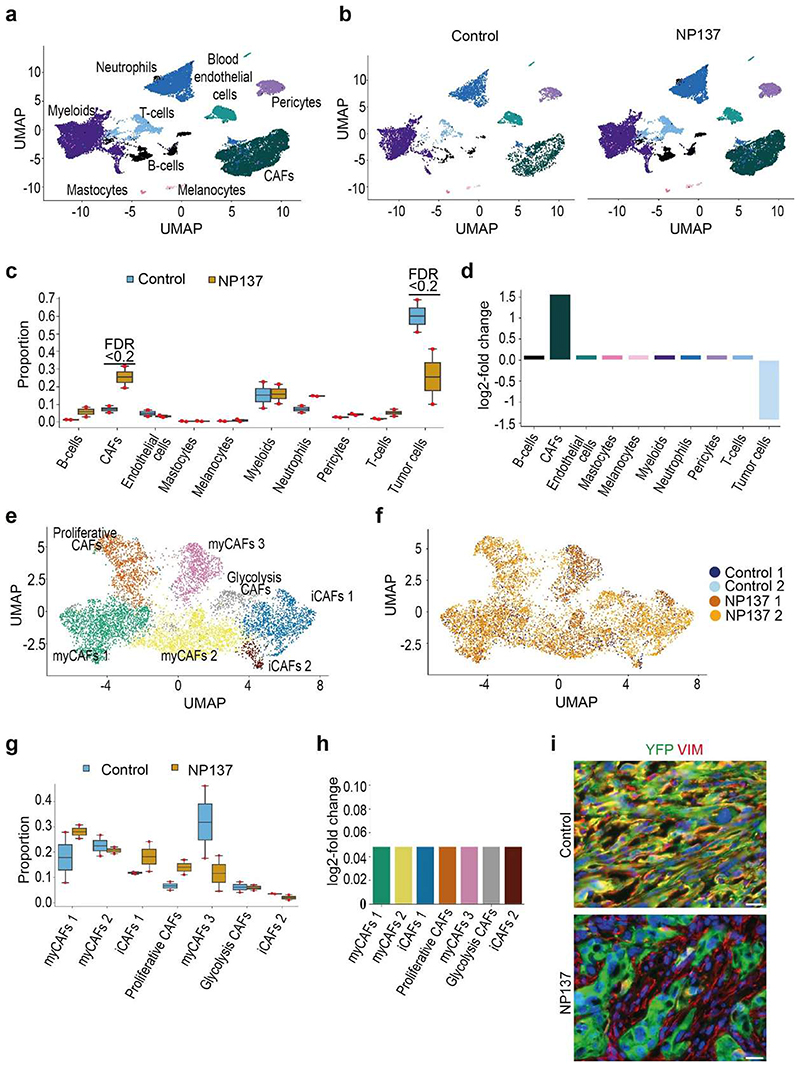
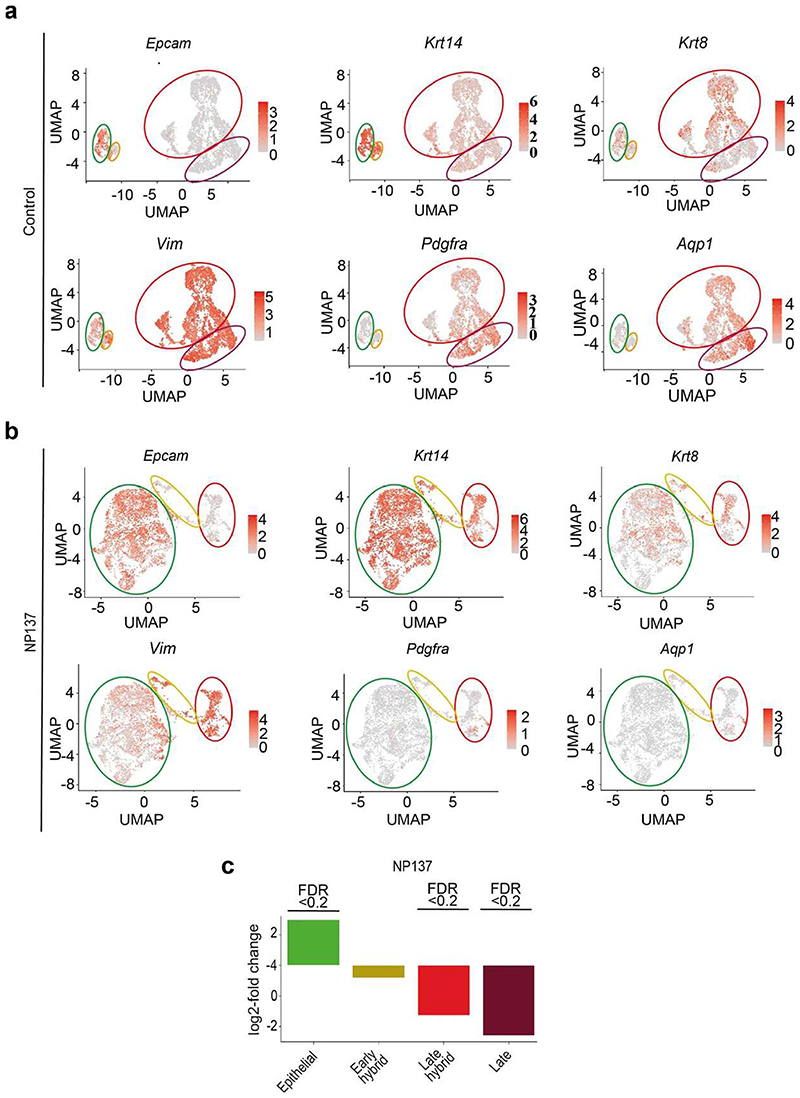
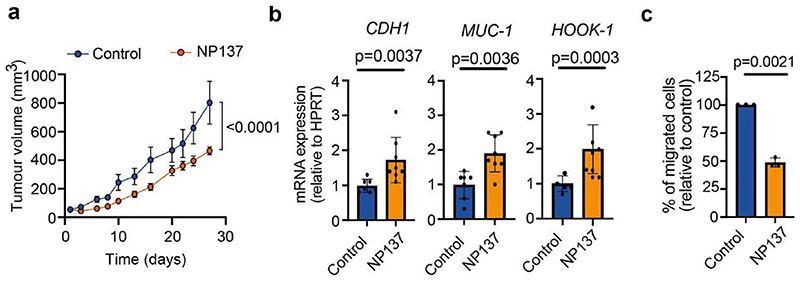
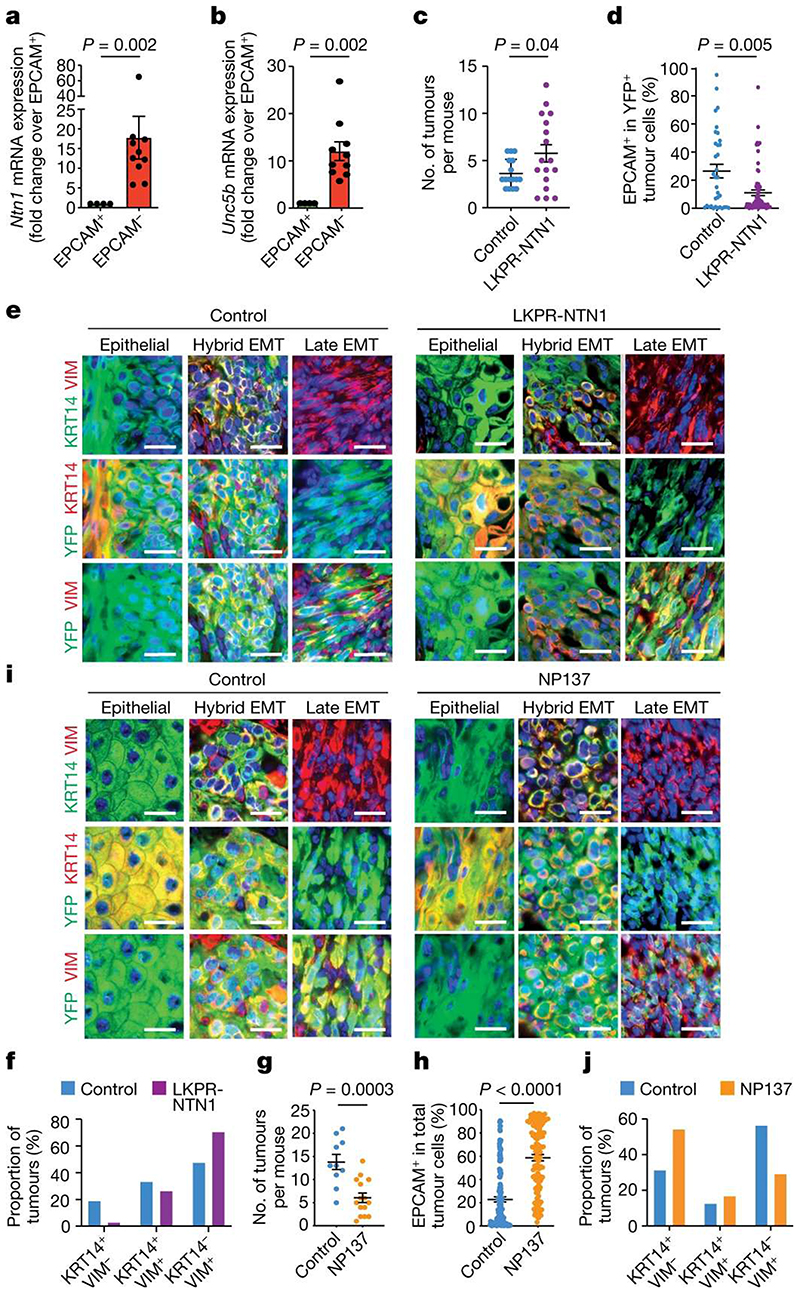
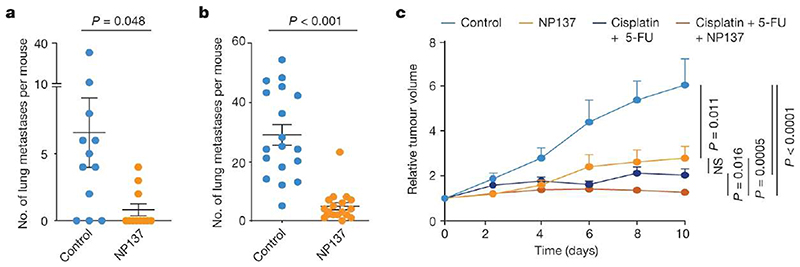
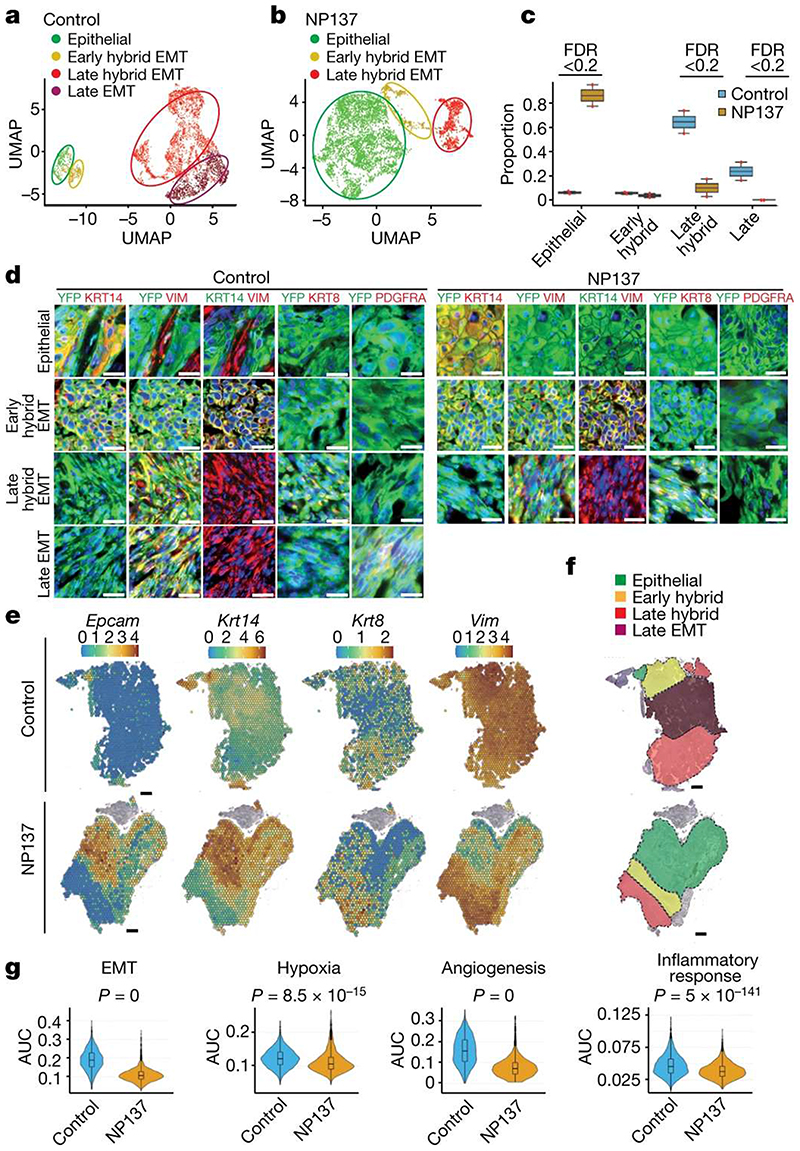
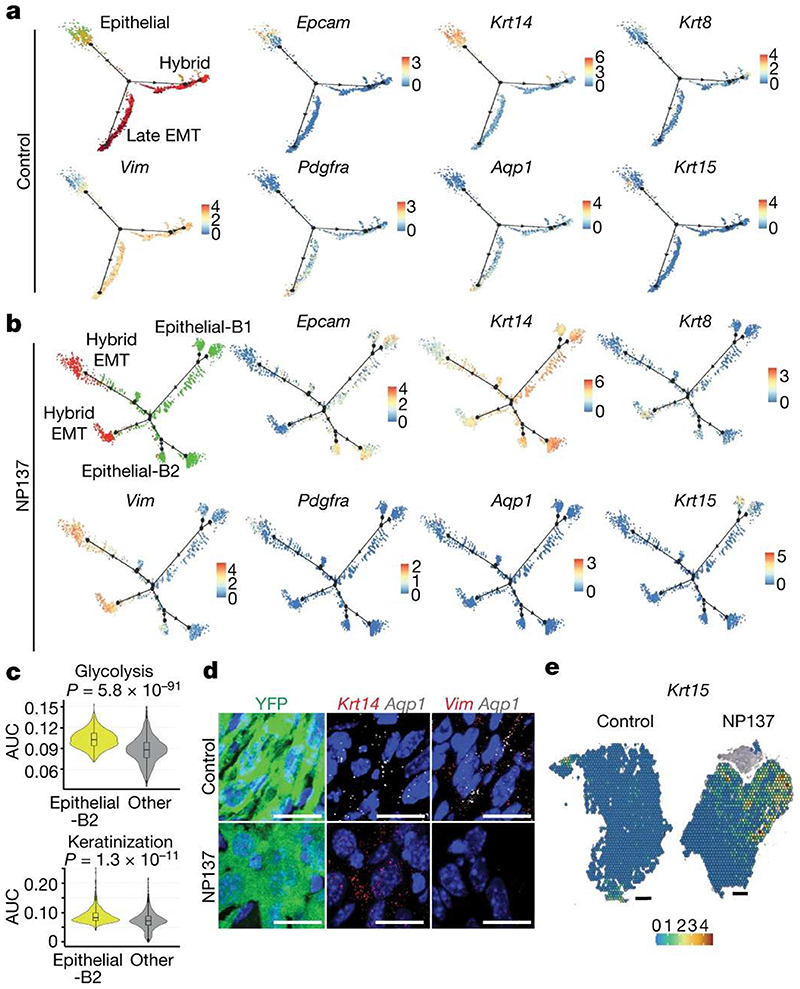
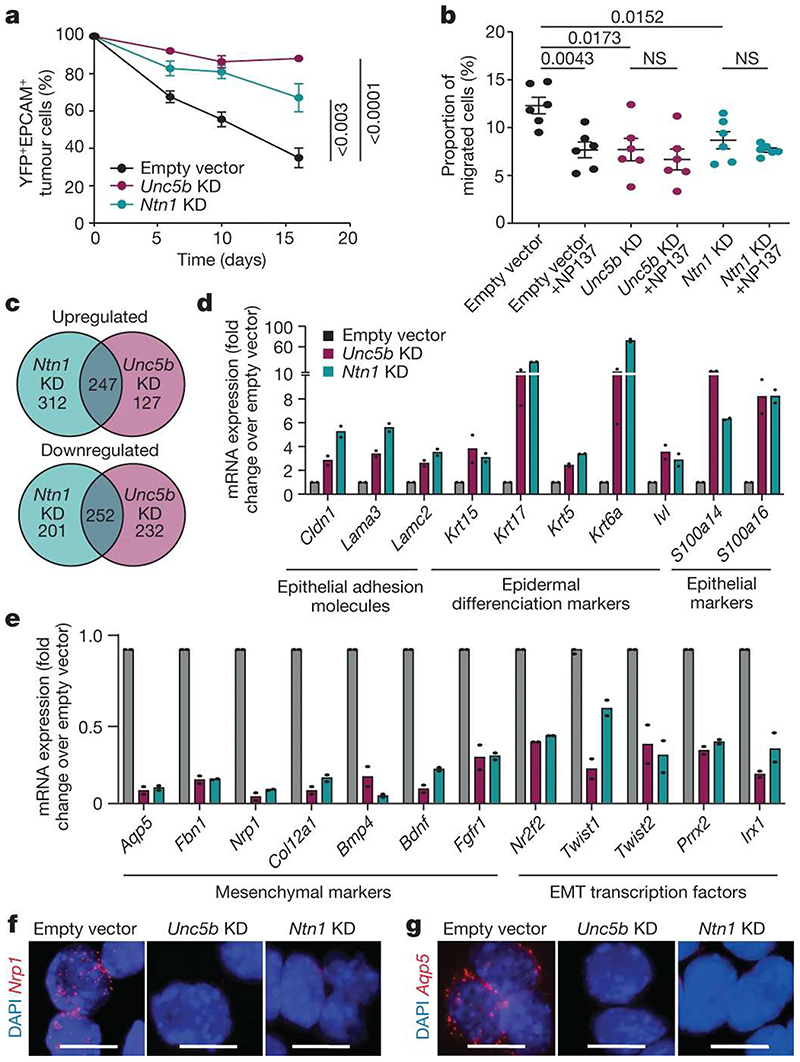
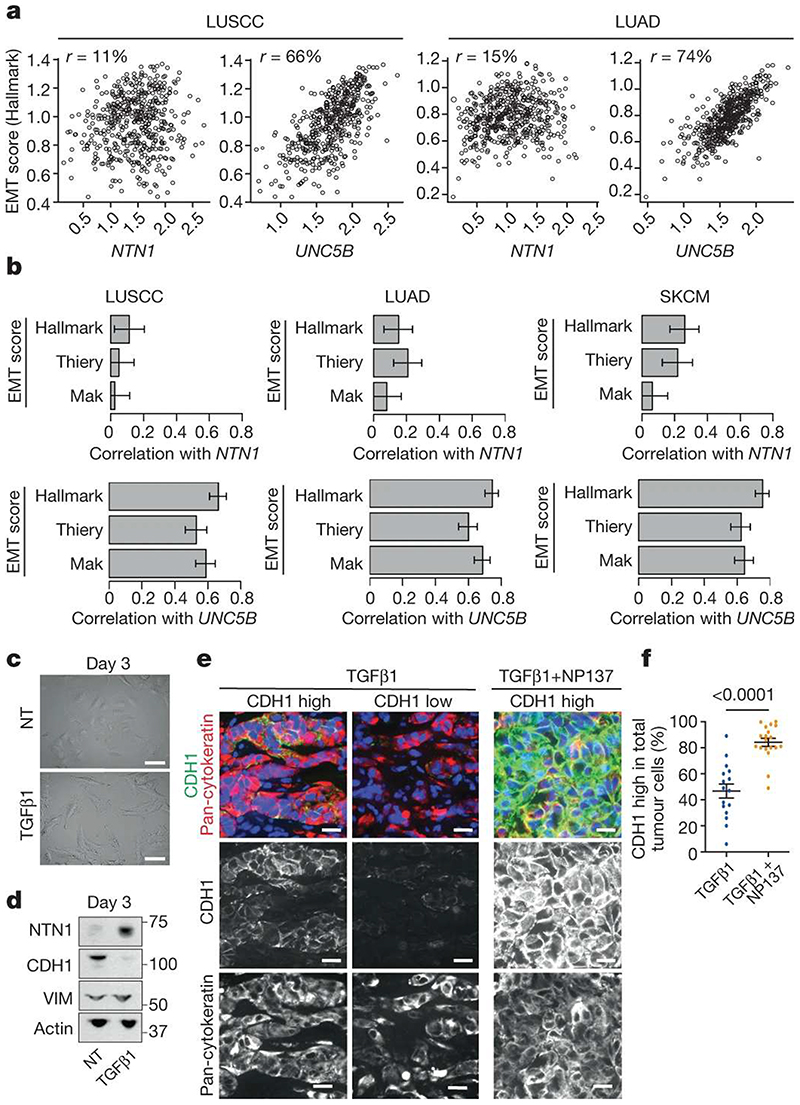
Epithelial-to-mesenchymal transition (EMT) regulates tumour initiation, progression, metastasis and resistance to anti-cancer therapy1-7. Although great progress has been made in understanding the role of EMT and its regulatory mechanisms in cancer, no therapeutic strategy to pharmacologically target EMT has been identified. Here we found that netrin-1 is upregulated in a primary mouse model of skin squamous cell carcinoma (SCC) exhibiting spontaneous EMT. Pharmacological inhibition of netrin-1 by administration of NP137, a netrin-1-blocking monoclonal antibody currently used in clinical trials in human cancer (ClinicalTrials.gov identifier NCT02977195 ), decreased the proportion of EMT tumour cells in skin SCC, decreased the number of metastases and increased the sensitivity of tumour cells to chemotherapy. Single-cell RNA sequencing revealed the presence of different EMT states, including epithelial, early and late hybrid EMT, and full EMT states, in control SCC. By contrast, administration of NP137 prevented the progression of cancer cells towards a late EMT state and sustained tumour epithelial states. Short hairpin RNA knockdown of netrin-1 and its receptor UNC5B in EPCAM+ tumour cells inhibited EMT in vitro in the absence of stromal cells and regulated a common gene signature that promotes tumour epithelial state and restricts EMT. To assess the relevance of these findings to human cancers, we treated mice transplanted with the A549 human cancer cell line-which undergoes EMT following TGFβ1 administration8,9-with NP137. Netrin-1 inhibition decreased EMT in these transplanted A549 cells. Together, our results identify a pharmacological strategy for targeting EMT in cancer, opening up novel therapeutic interventions for anti-cancer therapy.


Conflict of interest statement

Competing interests

A. Bernet and P.M. declare a conflict of interest as founders and shareholders of NETRIS Pharma. J.L., P.M., B.D., M.B. and N.B. declare a conflict of interest as employees of NETRIS Pharma. A. Bernet. and N.R. declare a conflict of interest as consultants for NETRIS. T.V. is co-inventor on licensed patents WO/2011/157846 (Methods for Haplotyping Single Cells), WO/2014/053664 (High-Throughput Genotyping by Sequencing Low Amounts of Genetic Material) and WO/2015/028576 (Haplotyping and Copy Number Typing Using Polymorphic Variant Allelic Frequencies).

Figures

Extended data 1
Extended data 1. Strategy to study the impact of Netrin-1 on EMT in mouse skin SCCs.
a, Mouse model of skin SCC allowing the expression of KrasG12D, YFP, p53 deletion and overexpression of human NETRIN-1 in hair follicle stem cells and their progeny using Lgr5CreER. b, Relative mRNA expression of NTN1 in EPCAM-control LKPR (n = 5) and LKPR-NTN1 (n = 8) skin SCC defined by qRT-PCR (data are normalized to Tbp gene, mean ± s.e.m., two tailed Mann-Whitney U test). c, Western blot analysis of Netrin-1 expression in EPCAM-control LKPR and LKPR-NTN1 skin SCC TCs. d, FACS plots showing the gating strategy used to FACS-isolate or to analyse the proportion of YFP+/ EPCAM+ and EPCAM tumour cells. e, Drawing showing the experimental strategy of NP137 administration after Tamoxifen induction in Lgr5CreER/ KrasLSL-G12D/p53 fl/fl/Rosa26-YFP+/+ mice. IP, intraperitoneal.
Extended data 2
Extended data 2. Single cell analysis of the cellular composition of control and NP137-treated skin SCCs.
a,b Uniform Manifold Approximation and Projection (UMAP) plot for control (a) and NP137-treated skin SCC (b) coloured by the identified cell types. c,d, UMAP plot for control (c) and NP137-treated skin SCC (d) coloured by the sample of origin for each cell. CAFs, cancer-associated fibroblasts.
Extended data 3
Extended data 3. Annotation of the cell types found by single cell RNA-seq in control and NP137-treated skin SCCs.
a, UMAP plots coloured by normalized Yfp and Epcam expression in the control tumours. Gene expression values are visualized as colour gradient with grey indicating no expression and red indicating the maximum expression. b, UMAP plots coloured by normalized Yfp and Epcam in NP137-treated samples. c, UMAP plots coloured by the activity of modules containing the mouse-specific marker genes of the different cell types including CAFs, Macrophages, Neutrophils, Endothelial cells and T cells obtained from the PanglaoDB database in control samples (left) and anti-Netrin-1 treated samples (right). Module activity visualized as a colour gradient with blue indicating no expression and yellow indicating maximum activity. d, UMAP plots coloured by normalized Pdgfra, Acta2, Pecam1, Cd3d, Ptprc, Itgam, Cd86 and Cxcr2 expression in the control samples (left) and NP137-treated samples (right). CAFs, cancer-associated fibroblasts. e, UMAP plot coloured by normalized Ntn1 expression in control condition.
Extended data 4
Extended data 4. Impact of anti-Netrin antibody administration on the cellular composition of skin SCCs.
a,b, Uniform Manifold Approximation and Projection (UMAP) plots coloured by the cell type labels obtained from the analysis of the microenvironment for the integration of all the samples in total (a) and split per sample (b), respectively. c, Boxplot depicting the proportions of the different cell types for the 4 samples, split by their condition. The boxplots are coloured by their condition, and the individual measurements are visualized as red dots. The centre line, top and bottom of the boxplots represent respectively the median, 25th and 75th percentile and whiskers are 1.5 x IQR. Significant proportion changes are indicated by FDR < 0.2. d, barplot depicting the relative log fold change of the relative abundance of the different cell types after NP137-treated samples compared to the pericytes. Bars are coloured according to their cell type. e,f, UMAP plot of the CAFS subclustering, coloured by the identified seven subclusters and the sample the cell originated from, respectively. g, Boxplot depicting the proportions of the different CAF subclusters for the 4 samples, split by their condition. The boxplots are coloured by their condition, and the individual measurements are visualized as red dots. The centre line, top and bottom of the boxplots represent respectively the median, 25th and 75th percentile and whiskers are 1.5 x IQR. h. barplot depicting the relative log fold change of the relative abundance of the different CAF subclusters after NP137 treatment compared to the glycolysis CAFs subcluster. i, Co-immunostaining of YFP and Vimentin in control (top) (n = 5 tumours) and NP137-treated skin SCC (bottom) (n = 5 tumours) that defines YFP-/VIM+ CAFs as cells (Scale bars, 20 μm).
Extended data 5
Extended data 5. Expression of markers of the different EMT states in control and NP137-treated skin SCCs.
a, b, UMAP plots coloured by normalized gene expression values for the indicated genes in the control (a) and treated samples (b). Gene expression values are visualized as colour gradient with grey indicating no expression and red indicating the maximum expression. Circles represent TCs groups with a different degree of EMT based on the expression of Epcam, Krt14, Krt8, Vim, Pdg fra (green: Epcam+/Krt14+/Vim- as epithelial state; orange: Epcam-/Krt14+/Vim+ as early hybrid EMT state; red: Epcam-/ Krt14-/Krt8+/Vim+ as late hybrid EMT state; dark red: Epcam-/Krt14-/Krt8-/ Vim+ as late full EMT state expressing Pdg fra and Aqp1). c, Barplot depicting the relative log fold change of the relative abundance of the different EMT states after NP137-treatment compared to the early hybrid state. Significant proportion changes are indicated by FDR < 0.2.
Extended data 6
Extended data 6. Histological analysis of the control and NP137-treated tumors.
a-d, Haematoxylin and Eosin staining showing the control (n = 1) (a,b) or NP137-treated (n = 1) (c,d) tumour skin SCC analysed in Visium spatial transcriptomic method. The annotated areas represent the EMT states previously defined by the expression of Epcam, Krt14, Krt8 and Vim (1: epithelial, 2: early hybrid, 3, late hybrid, 4: full late EMT) (scale bars in a, c, 500 μm, scale bars in b, 20 μm).
Extended data 7
Extended data 7. Analysis of NP137 treatment on tumour growth, EMT and migration in endometrial human cancer cell line.
a, Tumor growth quantification of human Ishikawa endometrial carcinoma cells grafted in nude mice treated with either control (n = 9) or NP137 (n = 9) (mean ± s.e.m., 2-way ANOVA). b, Relative mRNA expression of epithelial markers CDH1, MUC1 and HOOK1 by qRT-PCR in Ishikawa human cells grafted in nude mice treated with control (n = 7) or NP137 (n = 8) (data are normalized to HPRT gene, mean +/- s.e.m., two tailed Mann-Whitney U test). c, Percentage of migrated Ishikawa cells treated with NP137 relative to the migration of control condition through serum deprived culture medium complemented with 2.5% Matrigel between 5 and 24 h of invasion. (n = 3) (mean ± s.e.m, two tailed t test).
Figure 1
Figure 1. Targeting netrin-1 inhibits EMT.
a,b, Relative mRNA expression of Ntn1 (a) and Unc5b (b) in EPCAM+ (n = 4) and EPCAM (n = 10) tumour cells determined by quantitative real-time PCR. Data are mean ± s.e.m., normalized to the Tbp gene. Two-tailed Mann-Whitney U test. c, Dot plot showing the number of tumours in control LKPR (n = 16) and LKPR-NTN1 (n = 17) mice. Data are mean ± s.e.m. Two-tailed t-test. d, The proportion of EPCAM+ tumour cells in control LKPR (n = 34 tumours from 16 mice) and LKPR-NTN1 (n = 70 tumours from 17 mice). Data are mean ± s.e.m. Two-tailed t-test. e, Co-immunostaining of YFP and KRT14 or vimentin (VIM) in primary control and LKPR-NTN1 tumours (n = 21 tumours from 11 control LKPR mice and n = 34 tumours from 9 LKPR-NTN1 mice). Scale bars, 20 μm. f, The percentage of tumours with epithelial (KRT14+VIM), hybrid EMT (KRT14+VIM+) and full EMT (KRT14VIM+) phenotypes (n = 21 tumours from 11 control LKPR mice and n = 34 tumours from 9 LKPR-NTN1 mice). g, Dot plot showing the number of tumours in control (n = 10) and NP137-treated (n = 15) LKPR mice. Data are mean ± s.e.m. Two-tailed t-test. h, The proportion of EPCAM+ tumour cells in skin SCC of control (n = 148 tumours from 20 mice) and NP137-treated (n = 117 tumours from 16 mice) LKPR mice. Data are mean ± s.e.m. Twotailed t-test. i, Co-immunostaining of YFP and KRT14 or vimentin in control and NP137-treated skin SCC from LKPR mice (n = 32 tumours from 10 control mice and n = 24 NP137-treated SCCs from 9 mice). Scale bars, 20 μm. j, The percentage of tumours exhibiting epithelial (KRT14+VIM), hybrid EMT (KRT14+VIM+) and full EMT (KRT14VIM+) phenotypes (n = 32 tumours from 10 control mice and n = 24 NP137-treated SCCs from 9 mice).
Figure 2
Figure 2. Targeting netrin-1 reduces metastasis and sensitizes tumour cells to chemotherapy in skin SCC.
a, Dot plot showing the number of spontaneous lung metastases in control (n = 12) and NP137-treated (n = 11) mice with skin SCC. Data are mean ± s.e.m. Two-tailed t-test. b, Dot plot showing the number of lung metastases arising from the intravenous injection of 1,000 EPCAM tumour cells (n = 18 control-injected mice and n = 18 NP137-injected mice). Data are mean ± s.e.m. Two-tailed t-test. c, Relative tumour volume over time of control tumours (n = 29 from 5 mice) or tumours following therapy with cisplatin plus 5-FU (n = 58 from 8 mice), anti-netrin-1 antibody (n = 29 from 5 mice) or combined of cisplatin plus 5-FU and anti-netrin-1 (n = 59 from 8 mice). Data are mean + s.e.m. Two-tailed t-test. Tumour volumes were normalized to the tumour volume on the first day of chemotherapy.
Figure 3
Figure 3. Pharmacological inhibition of netrin-1 inhibits late EMT and promotes epithelial tumour states.
a,b, Uniform manifold approximation and projection (UMAP) plots coloured by EMT state for control (a) and NP137-treated (b) YFP+ tumour cells from skin SCC. Colours represent the different tumour states. c, Box plot depicting the proportion of tumour states for the four samples in control and NP137-treated conditions. Significant changes in proportion are defined as false discovery rate (FDR) <0.2. d, Co-immunostaining of YFP and KRT14, KRT8, vimentin and PDGFRA in control (left) and anti-netrin-1 treated (right) skin SCC from LKPR mice, defining areas with different degrees of EMT (n = 3 control tumours and n = 3 NP137-treated tumours). Scale bars, 20 m. e, Spatial transcriptomics using 10x Visium was conducted on tumour sections of control and NP137-treated mice. Normalized gene expression values are represented as a colour gradient. f, Summary of the different areas presenting different tumour states based on the expression of Epcam, Krt14, Krt8 and Vim: epithelial, Epcam+ Krt14+ Vim- ; early hybrid EMT, Epcam-Krt14+ Vim+ ; late hybrid EMT,Epcam Krt14Krt8+Vim+; late full EMT, Epcam Krt14Krt8 Vim+. g, Combined box plot and violin plot showing the activity of 4 MSigDB hallmark gene sets (epithelial-to-mesenchymal transition, hypoxia, angiogenesis and inflammatory response) in control (n = 2) and NP137-treated (n = 2) tumours. The area under the curve (AUC) indicates enrichment of the different hallmark gene sets in NP137-treated tumours relative to control tumours. Twosided Wilcoxon rank-sum test with Bonferroni correction. In box plots, the centre line represents median, box edges delineate 25th and 75th percentiles and whiskers extend to 1.5 times the interquartile range (IQR).
Figure 4
Figure 4. Pharmacological inhibition of netrin-1 inhibits late EMT promotes epithelial differentiation trajectories of tumour cells.
a,b, Pseudotemporal analysis using Monocle2 showing lineage trajectories in control skin SCC showing two EMT trajectories (hybrid and full (late) EMT trajectories) (a) and in NP137-treated skin SCC showing the absence of the late EMT trajectory and the appearance of new epithelial trajectories (b). Dots represent single cells. Green, epithelial; orange, early hybrid EMT; red, late hybrid EMT; dark red, late EMT. Gene expression is visualized as a colour gradient with blue indicating no expression and red indicating maximum expression. The two new branches detected in the NP137-treated trajectory are labelled epithelial-B1 and epithelial-B2. c, Combined box plot and violin plot showing the activity of glycolysis and keratinization gene sets in tumour cells belonging to the new epithelial state and other EMT states based on GO-term analysis in NP137-treated tumours (n = 2). The centre line represents median, box edges delineate 25th and 75th percentiles and whiskers extend to 1.5 times the IQR. Two-sided Wilcoxon rank-sum test with Bonferroni correction. d, Immunostaining for YFP and RNA in situ hybridization (RNAscope) for Krt14, Vim or Aqp1 in control and NP137-treated skin SCCs from LKRP mice (n = 2 independent biological replicates). Scale bars, 20 μm. e, Krt15 expression analysis using 10x Visium spatialtranscriptomic analysis on tumour sections. Gene expression values are normalized in the control and treated sample and are visualized as a colour gradient. Scale bars, 500 μm.
Figure 5
Figure 5. Netrin-1 and Unc5b knockdown inhibits EMT and promotes epithelial state.
a, EPCAM expression following in vitro culture of FACS-isolated primary EPCAM+ tumour cells transduced with empty vector, or Ntn1 or Unc5b shRNA knockdown (KD) (n = 8 independent replicates for empty vector, n = 6 independent replicates for Unc5b knockdown and n = 3 independent replicates for Ntn1 knockdown). Data are mean ± s.e.m. Two-tailed t-test. b, The percentage of migrated EPCAM cells from LKPR mice quantified by crystal violet staining (n = 2 independent replicates, 3 wells per condition). Data are mean ± s.e.m. Twotailed Mann-Whitney U test. c, Venn diagram showing the overlap between upregulated and downregulated genes in Ntn1-KD and Unc5b-KD cell lines. d, mRNA expression of upregulated epithelial genes by RNA-seq of EPCAM+ cells 6 days after plating of 100% EPCAM+ tumour cells. Histograms represent mean; n = 2 for empty vector, Ntn1-KD and Unc5b-KD. e, mRNA expression of mesenchymal genes that are downregulated following Ntn1 knockdown or Unc5b knockdown, determined by RNA-seq in EPCAM+ cells 6 days after plating of 100% EPCAM+ tumour cells. Histograms represent mean; n = 2. f,g, In situ hybridization (RNAscope) for Nrp1 (f) and Aqp5 (g) in empty vector control, Ntn1-KD and Unc5B-KD cell lines (n = 2 independent biological replicates). Scale bars, 20 μm.
Figure 6
Figure 6. Anti-netrin-1 therapy inhibits EMT in human cancer cells.
a, Scatter plots of NTN1 and UNC5B expression versus Hallmark EMT signatures are shown for LUSCC (n = 484 primary tumours) and LUAD (n = 510 primary tumours) cancer types from the TCGA. Spearman correlations are shown at the top of each graph. b, Bar plots showing Spearman correlations between NTN1, UNC5B expression and three EMT signature scores,, acrossLUSCC (n = 484 primary tumours), LUAD (n = 510 primary tumours) and SKCM (n = 443 tumours including 76 primary tumours and 367 metastases) cancer types from TCGA, with 95% confidence intervals (clipped at 0 for low correlations). To obtain EMT scores, the Hallmark signature was computed using single-sample Gene Set Enrichment Analysis (ssGSEA) on genes from the HALLMARK_EPITHELIAL_ MESENCHYMAL_TRANSITION signature, from MSigDB; the Thiery signature was computed similarly using genes from ref. 11; the Mak signature was calculated from the gene sets in ref. 40 as the difference of two signatures: a mesenchymal signature defined as the mean of mesenchymal gene expression and an epithelial signature defined as the mean of epithelial gene expression. c, Microscopic appearance of A549 NSCLC cells, following no treatment or after 3 days of TGFβ1 treatment (n = 3). Scale bars, 20 μm. d, Western blot analysis of netrin-1, E-cadherin (CDH1) and vimentin expression in the A549 NSCLC cell line in control conditions or following 3 days of TGFβ1 treatment. e, Co-immunostaining of E-cadherin and pan-cytokeratin on tumours arising from subcutaneous grafting into immunodeficient mice of A549 cells pre-treated with TGFβ1 in vitro for 6 days. The mice were treated with physiologic serum or NP137 for 25 days and the tumours were collected for histological analysis. Scale bars, 20 μm. f, Tumour cells expressing high levels of E-cadherin as a percentage of pan-cytokeratin-positive tumour cells (each dot represents the mean of E-cadherin-high cells in 4 representative areas from each tumour; n = 6 control tumours and n = 6 NP137-treated tumours). Data are mean ± s.e.m. Two-tailed t-test.

Comment in

References

    1. Ye X, Weinberg RA. Epithelial-Mesenchymal Plasticity: A Central Regulator of Cancer Progression. Trends Cell Biol. 2015;25:675–686. doi: 10.1016/j.tcb.2015.07.012. - DOI - PMC - PubMed
    1. Shibue T, Weinberg RA. EMT, CSCs, and drug resistance: the mechanistic link and clinical implications. Nat Rev Clin Oncol. 2017;14:611–629. doi: 10.1038/nrclinonc.2017.44. - DOI - PMC - PubMed
    1. Lambert AW, Weinberg RA. Linking EMT programmes to normal and neoplastic epithelial stem cells. Nat Rev Cancer. 2021;21:325–338. doi: 10.1038/s41568-021-00332-6. - DOI - PubMed
    1. Puisieux A, Brabletz T, Caramel J. Oncogenic roles of EMT-inducing transcription factors. Nat Cell Biol. 2014;16:488–494. doi: 10.1038/ncb2976. - DOI - PubMed
    1. Brabletz S, Schuhwerk H, Brabletz T, Stemmler MP. Dynamic EMT: a multi-tool for tumor progression. EMBO J. 2021;40:e108647. doi: 10.15252/embj.2021108647. - DOI - PMC - PubMed

Publication types

MeSH terms

Associated data