. 2023 Aug;620(7973):374-380.
doi: 10.1038/s41586-023-06373-1. Epub 2023 Aug 2.

cGAS-STING drives ageing-related inflammation and neurodegeneration

Affiliations

cGAS-STING drives ageing-related inflammation and neurodegeneration

Muhammet F Gulen et al. Nature. 2023 Aug.

Abstract

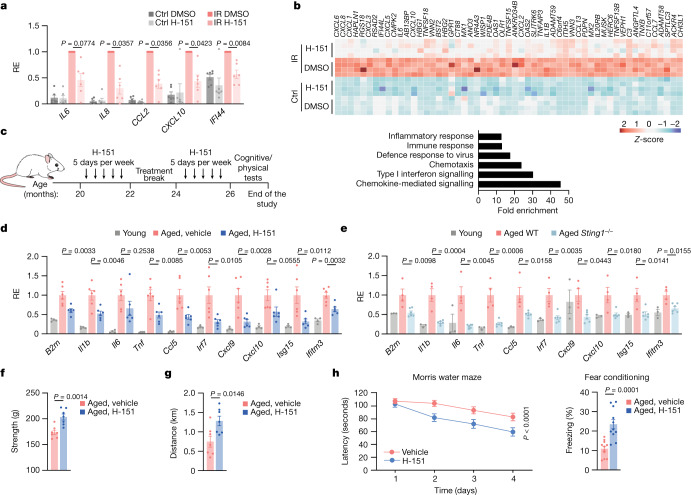
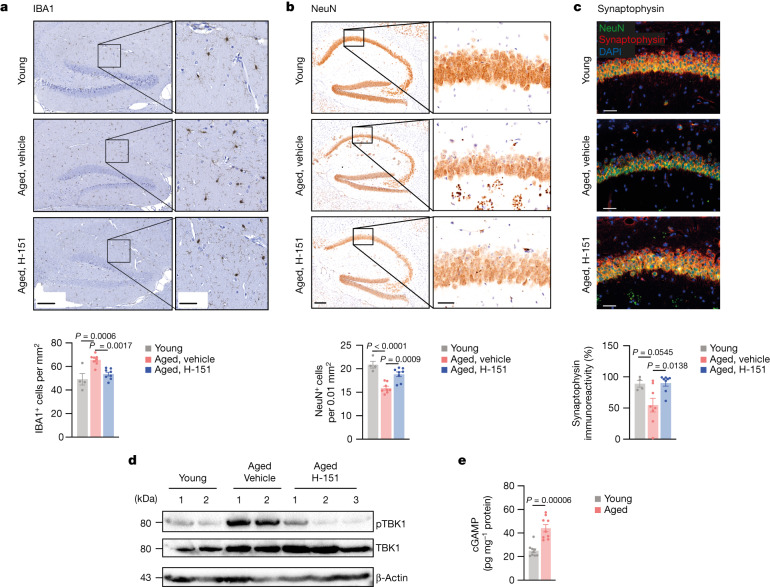
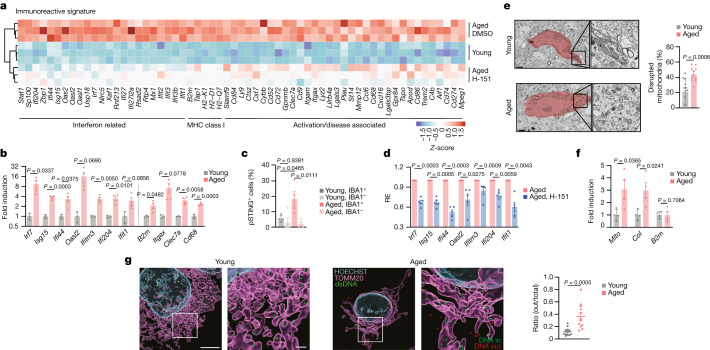
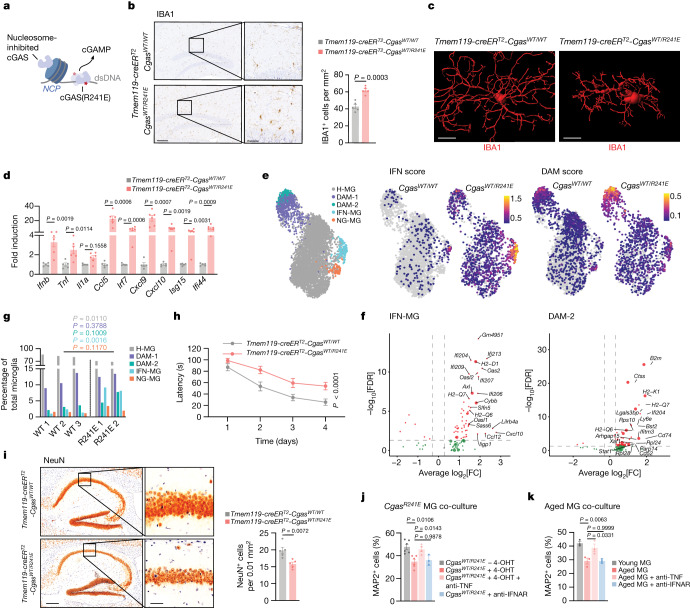
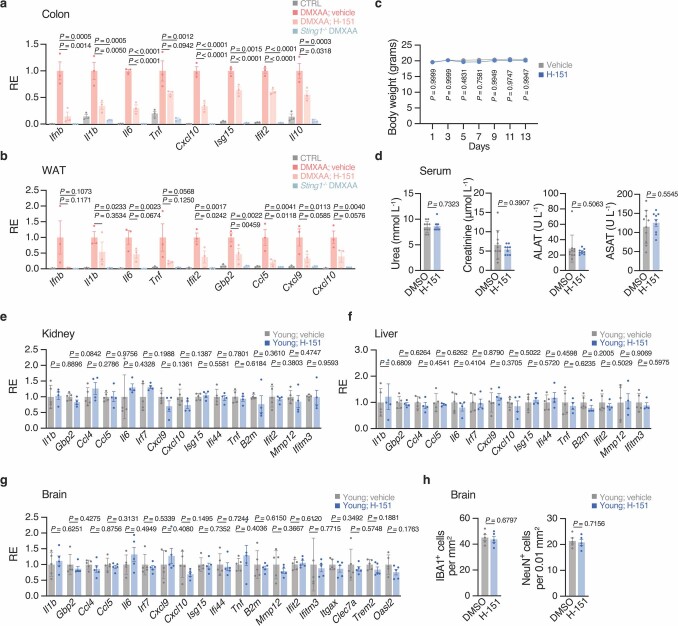
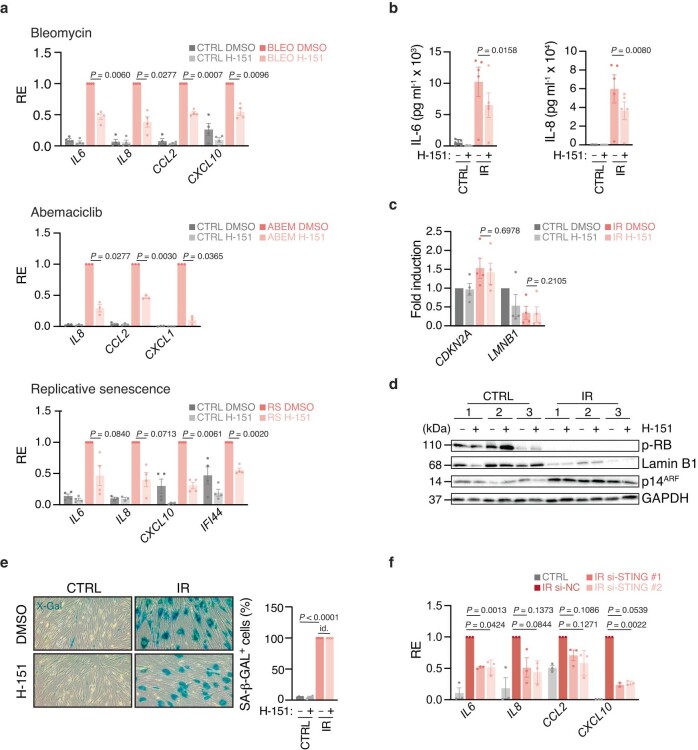
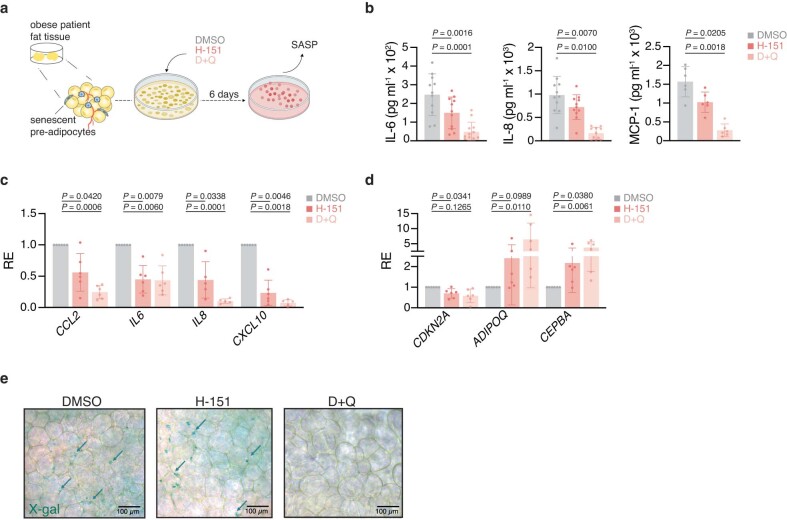
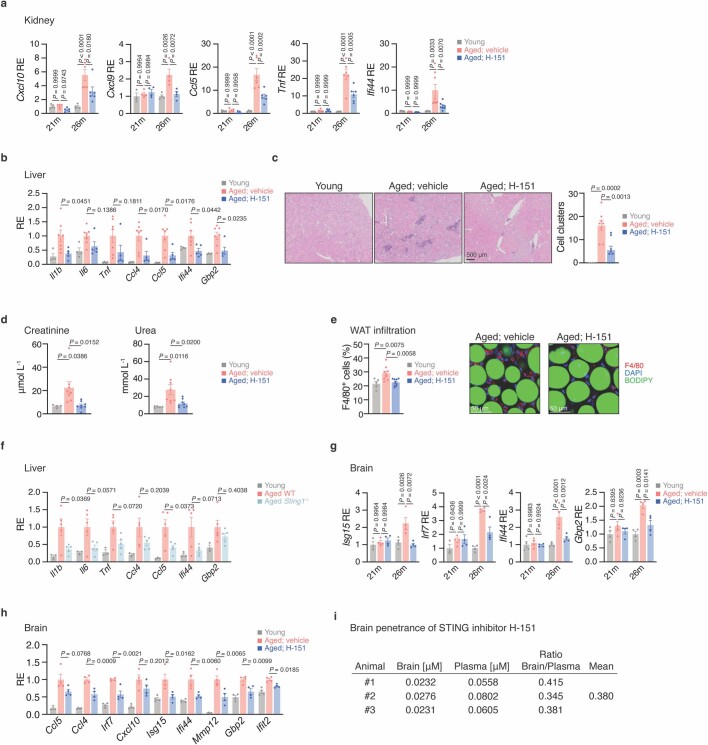
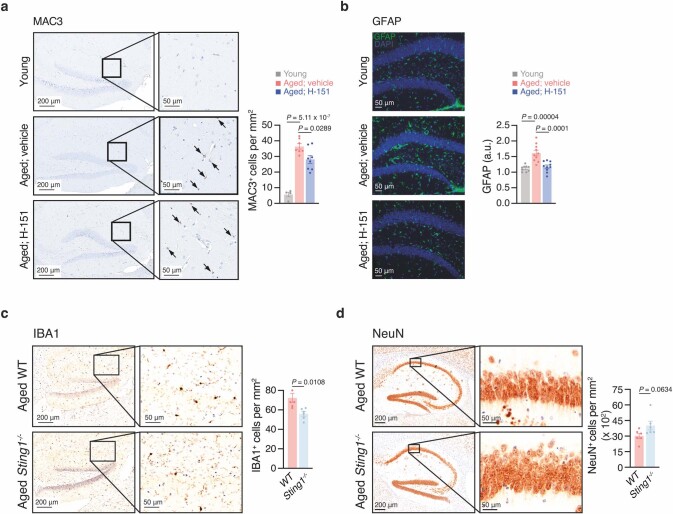
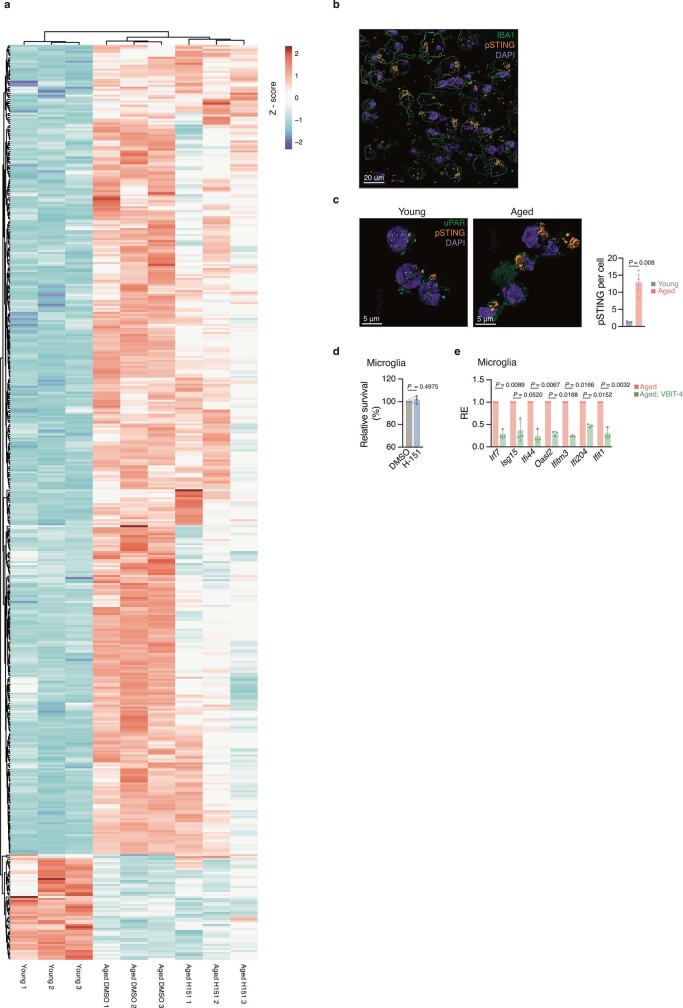
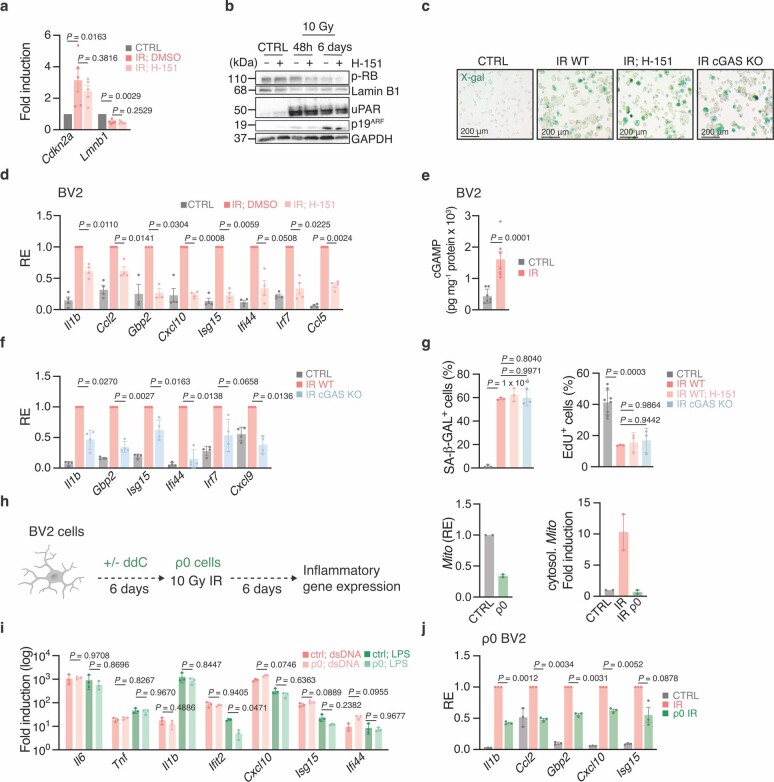
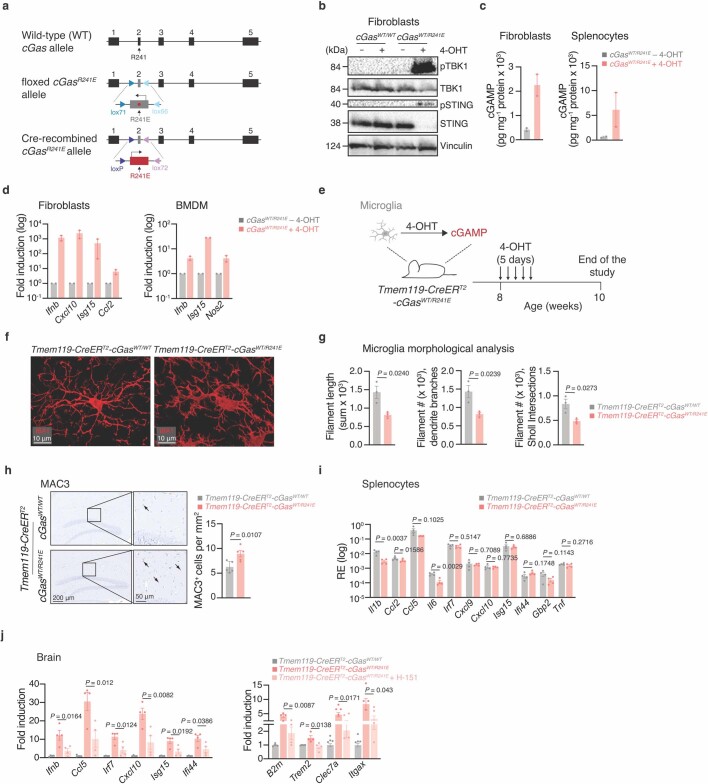
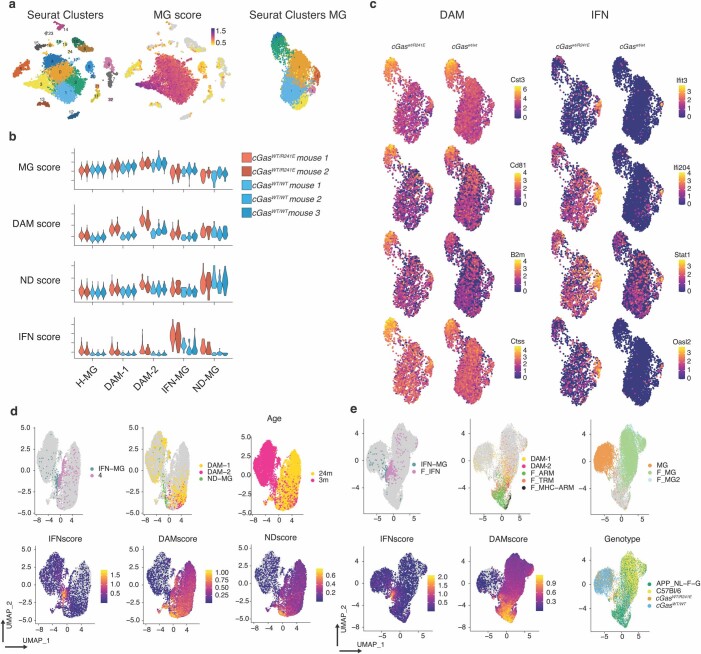
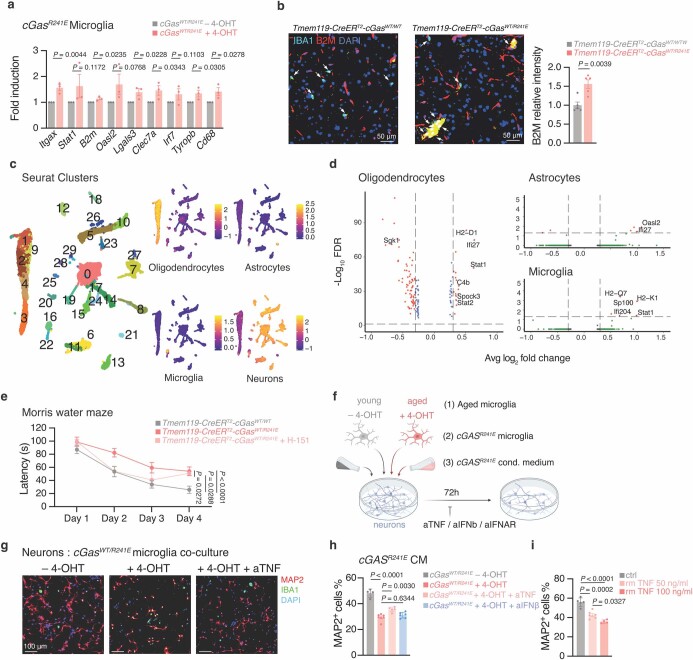
Low-grade inflammation is a hallmark of old age and a central driver of ageing-associated impairment and disease1. Multiple factors can contribute to ageing-associated inflammation2; however, the molecular pathways that transduce aberrant inflammatory signalling and their impact in natural ageing remain unclear. Here we show that the cGAS-STING signalling pathway, which mediates immune sensing of DNA3, is a critical driver of chronic inflammation and functional decline during ageing. Blockade of STING suppresses the inflammatory phenotypes of senescent human cells and tissues, attenuates ageing-related inflammation in multiple peripheral organs and the brain in mice, and leads to an improvement in tissue function. Focusing on the ageing brain, we reveal that activation of STING triggers reactive microglial transcriptional states, neurodegeneration and cognitive decline. Cytosolic DNA released from perturbed mitochondria elicits cGAS activity in old microglia, defining a mechanism by which cGAS-STING signalling is engaged in the ageing brain. Single-nucleus RNA-sequencing analysis of microglia and hippocampi of a cGAS gain-of-function mouse model demonstrates that engagement of cGAS in microglia is sufficient to direct ageing-associated transcriptional microglial states leading to bystander cell inflammation, neurotoxicity and impaired memory capacity. Our findings establish the cGAS-STING pathway as a driver of ageing-related inflammation in peripheral organs and the brain, and reveal blockade of cGAS-STING signalling as a potential strategy to halt neurodegenerative processes during old age.


Conflict of interest statement

A.A. is a scientific co-founder of IFM Due. The other authors declare no competing interests.

Figures

Fig. 1
Fig. 1. STING promotes low-grade inflammation and functional decline in aged mice.
a,b, mRNA expression levels of proinflammatory genes and ISGs (a) and RNA-seq analysis (b) of human WI-38 fibroblasts irradiated (12 Gy, IR) or maintained at 5% O2 (Ctrl), and treated with H-151 (daily, 0.5 μM) or DMSO for 10 days when senescent (day 10 to 20). The relative expression (RE) was measured for each experiment (n = 6) relative to the induction level in the irradiated DMSO condition (a). b, The top 50 genes most upregulated after irradiation and suppressed after H-151 treatment (n = 4 experiments) (top), and a gene set enrichment analysis showing the fold enrichment based on the above list of genes (bottom). c, Schematic of the treatment of wild-type (WT) aged mice with H-151 related to data shown in d and fh. d,e, Kidney mRNA expression levels of proinflammatory genes and ISGs in young (n = 4) and aged mice treated with or without H-151 (n = 6) (d) and of young (n = 3), aged WT (n = 4) and Sting1−/− mice (n = 6) (e). Expression was measured relative to the average of aged vehicle-treated (d) or aged WT (e) mice. f,g, The physical condition of aged mice treated with or without H-151 (n = 7), evaluated by grip strength (f) and treadmill running distance (g). h, Cognitive function tests (n = 11 mice) were evaluated using the Morris water maze test (left, latency to reach the platform over multiple days) and fear conditioning (right, percentage of time spent freezing. P = 3 × 10−5. Data are mean ± s.e.m. P values were obtained using two-sided paired ratio Student’s t-tests (a), two-sided unpaired Student’s t-tests (fh (right)), one-way analysis of variance (ANOVA) followed by Tukey’s multiple-comparison test (d and e) and ordinary two-way ANOVA (h, left). Source Data
Fig. 2
Fig. 2. cGAS–STING activity drives degenerative processes in the aged brain.
ac, Representative images and quantification of hippocampal IBA1+ cells (a), NeuN+ cells (b) and synaptophysin intensity (c) in the CA1 region from brain sections of young (n = 4) and aged mice (n = 8) that were treated or not with H-151. Scale bars, 200 μm (a and b (left)), 50 μm (a and b (right) and c). P = 3 × 10−5. d, Western blot analysis of pTBK1 in the brain lysates of young mice (n = 2), aged mice (n = 2) and aged mice acutely treated with H-151 (daily for 5 consecutive days, n = 3). e, cGAMP production measured by enzyme-linked immunosorbent assay (ELISA) in brain lysates of young and aged mice (n = 9). Data are mean ± s.e.m. P values were calculated using ordinary one-way ANOVA followed by Tukey’s multiple-comparison tests (ac) or two-sided unpaired Student’s t-tests (e). Source Data
Fig. 3
Fig. 3. Aberrant cGAS–STING activation in microglia of aged mice involves mtDNA.
a, Differential gene expression from bulk hippocampus RNA-seq analysis of young and aged mice treated with or without H-151 (n = 3). The heat map shows type I IFN, MHC class I and microglial activation/disease-associated genes from the total list of significant DEGs (Extended Data Fig. 6a; false-discovery rate (FDR) ≤ 0.01, |log2[fold change (FC)]| ≥ 0.6). b, mRNA expression levels of immunoreactive genes, ISGs and activation markers in primary microglia isolated from young (n = 3) and aged (n = 4) mice. c, Confocal imaging quantification of pSTING staining in young and aged hippocampal sections (average from 100–200 cells per mouse, n = 4), differentially quantified in IBA1 and IBA1+ cells. d, mRNA expression levels of immunoreactive genes and ISGs in microglia from aged mice treated or not with H-151. n = 5. e, Transmission electron microscopy images representing age-related microglial morphological differences and the percentage of disrupted mitochondria per hippocampal microglia in young (n = 13) and aged (n = 10) cells, randomly selected from 3 mice per condition. Scale bars, 1 μm. f, Cytosolic expression levels of Mito (mitochondrial DNA sequence), CoI and B2m in microglia isolated from young and aged mice (n = 4). g, Representative 3D reconstructions from Airyscan images and quantification of cytosolic DNA foci outside the mitochondria in microglia isolated from young and aged mice. The ratio of DNA foci outside the mitochondria was measured for each cell relative to the total counts of cytosolic foci (inside (green) and outside (red)). n = 12 cells, from 3 mice. Scale bars, 5 μm (top) and 1 μm (bottom). Data are mean ± s.e.m. P values were calculated using two-sided unpaired Student’s t-tests (b and dg) and one-way ANOVA followed by Tukey’s multiple-comparison test (c). Source Data
Fig. 4
Fig. 4. Selective engagement of cGAS promotes age-associated microglial states and features of neurodegeneration.
a, Schematic of the nucleosome-binding-defective cGAS-mutant activation. b, Representative images and quantification of hippocampal IBA1 staining of Tmem119-creERT2-CgasWT/WT and Tmem119-creERT2-CgasWT/R241E mice. n = 5. Scale bars, 200 μm (left) and 50 μm (right). c, Representative IBA1+ microglia reconstructed by IMARIS. Scale bars, 10 μm. d, Brain mRNA expression levels of proinflammatory genes and ISGs from Tmem119-creERT2-CgasWT/WT (n = 5) and Tmem119-creERT2-CgasWT/R241E (n = 6) mice. e, Uniform manifold approximation and projection (UMAP) plots visualizing microglial single nuclei, coloured by cell identity (left, homeostatic microglia (H-MG); disease-associated microglia (DAM-1/2); IFN-associated microglia (IFN-MG); neurodegenerative-associated microglia (ND-MG)), and IFN/DAM gene expression scores split by Cgas genotype (right). Colour scale bars denote the gene burden score. f, DEGs between CgasWT/WT and CgasWT/R241E in IFN-MG and DAM-2-MG (FDR ≤ 0.05, log2[FC] ≥ 0.3). Oversized points represent genes linked with associated states (Supplementary Table 6). g, The relative proportions of microglial populations identified from snRNA-seq analysis of Tmem119-creERT2-CgasWT/WT (WT, n = 3) and Tmem119-creERT2-CgasWT/R241E (R241E, n = 2) microglia. h, Morris water maze test of Tmem119-creERT2-CgasWT/WT (n = 6) and Tmem119-creERT2-CgasWT/R241E (n = 11) mice. P = 1 × 10−5. i, Representative images and quantification of NeuN+ cells in the hippocampal CA1 region of Tmem119-creERT2-CgasWT/WT and Tmem119-creERT2-CgasWT/R241E mice. n = 5. Scale bars, 250 μm (left) and 50 μm (right). j,k, The relative survival of MAP2+ neurons cultured with Rosa26-creERT2-CgasWT/R241E-isolated microglia treated with or without 4-OHT (n = 6) and with TNF-neutralizing (n = 4) or IFNAR-neutralizing antibodies (n = 3 slides), from n = 3 mice (j); or microglia from young and aged mice treated with TNF- or IFNAR-neutralizing antibodies (k) (averaged per mouse, n = 3). Data are mean ± s.e.m. P values were calculated using two-sided Student’s unpaired t-tests (b, d, g and i), one-way ANOVA followed by Tukey’s multiple-comparison test (j and k) and ordinary two-way ANOVA (h). Source Data
Extended Data Fig. 1
Extended Data Fig. 1. In vivo efficacy and tolerability measurements of H-151.
a, b mRNA expression levels of proinflammatory and interferon-related genes in the colon (a) and the white adipose tissue (WAT, b) of WT and Sting1−/− mice DMXAA-treated or not (CTRL), combined with vehicle or H-151 (n = 3), measured relative to the average induction levels of DMXAA vehicle-treated mice. Colon: H-151 P = 3 × 10−6 (Il6), 8 × 10−5 (Cxcl10), 9 × 10−7 (Isg15), 8 × 10−5 (Ifit2); Sting1−/− P = 2 × 10−7 (Il6), 4 × 10−6 (Cxcl10), 5 × 10−8 (Ifit2). ch, Young mice were treated daily with H-151 for 14 days. c, Body weight change with time from mice vehicle- or H-151-treated (n = 10). d, Serum creatinine, urea, ALAT, and ASAT levels in mice treated (n = 9) or not (n = 10) with H-151. eg, mRNA expression levels of proinflammatory and interferon-related genes in the kidney (e), liver (f), and brain (g) of young mice treated (kidney, liver n = 4, brain n = 5) or not (n = 5) with H-151. Relative expression measured to the average induction levels of DMXAA vehicle-treated mice. h, Brain hippocampal counts of IBA1+ microglia (left) and NeuN+ neurons (right) from young mice treated or not with H-151 (n = 5). Data are mean ± s.e.m. P values were calculated by one-sided ordinary ANOVA followed by Tukey’s multiple comparisons tests (a,b), with two-sided Student’s unpaired t-test (dh) or RM two-way ANOVA with Geisser-Greenhouse correction, followed by Sidak’s multiple comparisons tests (c). Source Data
Extended Data Fig. 2
Extended Data Fig. 2. STING inhibition compromises the inflammatory phenotype of senescent cells.
a, mRNA expression levels of proinflammatory and interferon-stimulated genes of human WI-38 fibroblasts rendered senescent by treatment with DNA metabolism inhibitor Bleomycin (n = 4 experiments), CDK4/6 inhibitor Abemaciclib (n = 3 experiments), repetitive passaging (n = 4 experiments) or maintained in 5% O2 (CTRL) and then treated with DMSO or H-151 (daily 0.5 μM for 10 days), measured for each experiment relative to the induction levels in the stimulated DMSO condition. b, Cytokine production measured by ELISA in the cultured medium of control and irradiated WI-38 cells treated with DMSO or H-151 (daily 0.5 μM from day 10 to day 20, from n = 5 experiments). c, mRNA expression levels of senescence characteristic genes in cells treated as in b (n = 4 experiments), measured for each experiment relative to the control DMSO condition. d, Western blot characterization of irradiated cells treated as in (b) harvested on day 20 (n = 3 experiments). e, Representative images and quantification of senescence-associated ß-galactosidase (SA-ß-GAL) staining from control and irradiated WI-38 cells treated as in (b), measured relative to total DAPI+ cells (n = 4 FOV, represents n = 3 experiments), P = 4 × 10−5. Id., identical values. f, mRNA expression levels of proinflammatory and interferon-stimulated genes in control and irradiated (12 Gy, IR) human BJ fibroblasts treated with si-NC or si-STING (72h, 10 days after irradiation). Relative expression normalized for each experiment (n = 3) to the induction in the irradiated si-NC condition. Data are mean ± s.e.m. P values were obtained with two-sided paired ratio Student’s t-test (ac, e,f). Source Data
Extended Data Fig. 3
Extended Data Fig. 3. STING blockade decreases proinflammatory cytokine production in human adipose tissue.
a, Schematic of omental adipose tissue explants studies. b, ELISA measurement, from individual patients, of IL-6 (n = 11), IL-8 (n = 11) and MCP-1 (n = 6) in the conditioned medium of tissue explants. c,d, mRNA expression levels of proinflammatory and interferon-stimulated genes (c) and adipose tissue functional genes (d), normalized per patient (n = 6) to the DMSO control condition. e, Representative images of senescence-associated β-galactosidase (SA-β-GAL) staining of omental fat tissue (n = 1 tissue, represents n = 11 patients), cleared with RapiClear. Arrows indicate examples of SA-β-GAL+ cells. Scale bars, 100 μm. Data are mean ± s.e.m. P values were obtained with two-sided paired ratio Student’s t-test (bd). D + Q; senolytic drug combination Dasatinib and Quercetin. Source Data
Extended Data Fig. 4
Extended Data Fig. 4. STING controls inflammatory signals in peripheral organs and the brain of aged mice.
a, Kidney mRNA expression levels of proinflammatory and interferon-stimulated genes in young mice (21m n = 5 -Cxcl9 n = 3-, 26m n = 4), and mice at 21- and 26-months H-151-treated (21m n = 5 -Cxcl9 n = 4-, 26m n = 6 -Cxcl9 n = 4, Ifi44 n = 8-) or not (21m n = 5 -Cxcl9 n = 4-, 26m n = 6 -Cxcl9 n = 4, Ifi44 n = 8-). P = 3 × 10-5 (Cxcl10), 4 × 10−7 (Ccl5), 2 × 10−7 (Tnf). b, Liver mRNA expression levels of proinflammatory and interferon-stimulated genes in young (n = 4) and aged mice H-151-treated (n = 5) or not (n = 7). c, Representative histological images and quantification of inflammatory clusters in young (n = 4) and aged mice kidney H-151-treated or not (n = 8). Scale bar, 500 μm. d, Serum creatinine (left) and urea (right) levels in young (n = 4) and aged (n = 8) mice H-151-treated or not. e, Representative images and quantification of F4/80+ macrophages (red) in the white adipose tissue (WAT) of young (n = 5) and aged mice (n = 9) H-151-treated or not, relative to DAPI+ cells. Scale bars, 50 μm. f, Liver mRNA expression levels of proinflammatory and interferon-stimulated genes in young (n = 3) and aged WT/Sting1−/− mice (n = 5), normalized to aged mice average. g, Brain mRNA expression levels of proinflammatory and interferon-stimulated genes in young (21m n = 4 -Isg15, Irf7 n = 3-, 26m n = 4), and mice at 21- and 26-months H-151-treated or not (n = 4). P = 4 × 10−6 (Irf7), 6 × 10−5 (Ifi44). h, Brain mRNA expression levels of proinflammatory and interferon-stimulated genes in young/aged mice H-151-treated or not (n = 4), normalized to aged vehicle-treated mice average. i, Brain penetrance measurements of H-151 in mice. Data are mean ± s.e.m. P values were calculated by one-way ANOVA followed by Tukey’s multiple comparisons tests (ah). Source Data
Extended Data Fig. 5
Extended Data Fig. 5. STING activation disrupts brain cell homeostasis in aged mice.
a, Representative images and quantification of hippocampal MAC3 in brain sections of young (n = 4) and aged mice vehicle- (n = 7) or H-15-treated (n = 8). Arrows indicate MAC3+ cells. Scale bars, 200 μm (left), 50 μm (right). b, Representative images and quantification of hippocampal GFAP in brain sections of young (n = 9) and aged mice (n = 10) vehicle- or H-151-treated. Scale bar, 50 μm; a.u., arbitrary units. c,d, Representative images and quantification of hippocampal IBA (c) and NeuN (d) in the CA1 region of aged WT (IBA1, n = 5; NeuN, n = 6) and Sting1−/− mice (n = 6). Scale bars, 200 μm (left), 50 μm (right). Data are mean ± s.e.m. P values were calculated by one-way ANOVA followed by Tukey’s multiple comparisons tests (a,b) or two-sided Student’s unpaired t-test (c,d). Source Data
Extended Data Fig. 6
Extended Data Fig. 6. STING-dependent effects in aged microglia.
a, Heatmap depicting aging responsive genes (459 genes, FDR ≤ 0.01, Log2FC ≥ 0.6 n = 3 per condition). Colours are representative of normalized counts per million. Genes and samples are ordered by unsupervised clustering. b, Representative confocal image of pSTING staining in aged hippocampi sections (n = 1, represents n = 4 mice). Scale bar, 20 μm. c, Representative confocal images and quantification of pSTING foci in microglia cultured from young and aged mice (average from 20 cells per mouse, n = 3). Scale bars, 5 μm. d, Relative survival of primary microglia treated with H-151 for 24 h, measured by Cell titre blue (CTB) assay (n = 3 mice). e, mRNA expression levels of immunoreactive and interferon-stimulated genes in primary microglia from aged mice treated or not VBIT-4 (10 μm) for 4 days (n = 3). Data are mean ± s.e.m. P values were calculated by two-sided Student’s unpaired (c,d) or two-sided Student’s paired (e) t-test. uPAR, urokinase-type plasminogen activator receptor. Source Data
Extended Data Fig. 7
Extended Data Fig. 7. Senescent microglial BV2 cells display cGAS–STING-dependent innate immune activation.
ad, BV2 cells were irradiated (10 Gy, IR), then DMSO- or H151-treated (daily, 1 μM, day 4-6 post-irradiation). mRNA expression levels of senescence markers (n = 5 experiments) (a), Western blot characterization (b), and senescence-associated-β-galactosidase staining (n = 1, represents n = 3 experiments) (c). Scale bars, 200 μm. mRNA expression levels of proinflammatory and interferon-stimulated genes (d) in control and irradiated, DMSO- or H-151-treated cells, measured for each experiment (n = 4) relative to irradiated DMSO-treated cells. e, cGAMP levels in cell lysates of control and irradiated BV2 cells (n = 7 experiments). f, mRNA expression levels of proinflammatory and interferon-stimulated genes in control and irradiated WT and cGAS-KO BV2 cells (n = 4 experiments). g, Senescence-associated-β-galactosidase (left, n = 3 FOV) and % EdU+ cells (right) from control (n = 8 FOV) and irradiated (n = 3 FOV) WT BV2, H-151-treated or not as in (a) and cGAS-KO BV2 (n = 3 FOV), represents n = 3 experiments. h, Experimental set-up for the analysis of mtDNA-depleted BV2 cells (ρ0 BV2) (left). Mitochondrial DNA sequence Mito levels in ρ0 BV2 whole cell lysate (middle), and in the cytosol after irradiation (right) (n = 2 experiments). i, mRNA expression levels of proinflammatory and interferon-stimulated genes in ρ0 BV2 cells stimulated with LPS or dsDNA 90mer transfection (n = 3 experiments). j, mRNA expression levels of proinflammatory and interferon-stimulated genes in control and irradiated ρ0 BV2 cells, measured for each experiment (n = 3) relative to irradiated untreated (IR) cells. Data are mean ± s.e.m. P values were obtained with two-sided paired ratio Student’s t-test (a,d,e,j), two-sided unpaired Student’s t-test (f), and one-way ANOVA followed by Tukey’s multiple comparisons tests (g,i). uPAR, urokinase-type plasminogen activator receptor. Source Data
Extended Data Fig. 8
Extended Data Fig. 8. Genetic activation of cGAS-STING signalling in diverse cells of cGasR241E mice in vitro and in vivo.
a, Schematic illustrating the knock-in cGAS gain-of-function mouse model. b, Western blot analysis of cGAS activation in tail-tip fibroblasts of Rosa26-creERT2-cGasWT/WT and Rosa26-creERT2-cGasWT/R241E mice, treated or not with 4-OHT. c, cGAMP levels in cell lysates of tail-tip fibroblasts and splenocytes from Rosa26-creERT2-cGasWT/WT and Rosa26-creERT2-cGasWT/R241E mice (n = 2). d, mRNA expression levels of interferon-stimulated genes in tail-tip fibroblasts and bone-marrow-derived macrophages (BMDM) from Rosa26-creERT2-cGasWT/R241E mice (n = 2), 4-OHT-treated or not. e, Experimental set-up for the analysis of microglia-specific cGAS activation. f, g, IBA1+ microglia analysis from Tmem119-creERT2-cGasWT/WT and Tmem119-creERT2-cGasWT/R241E mice by IMARIS, showing raw images pre-reconstruction (f) and morphological analysis (g), with image-based quantification (n = 3 mice). h, Representative images and quantification of hippocampal MAC3 in brain sections of Tmem119-creERT2-cGasWT/WT or Tmem119-creERT2-cGasWT/R241E mice (n = 5). i, mRNA expression levels of proinflammatory and interferon-stimulated genes in splenocytes of Tmem119-creERT2-cGasWT/WT and Tmem119-creERT2-cGasWT/R241E mice treated with 4-OHT (n = 4). j, Brain mRNA expression levels of proinflammatory and interferon-stimulated genes (left) and microglia activation markers (right) from Tmem119-creERT2-cGasWT/WT and Tmem119-creERT2-cGasWT/R241E mice 4-OHT-treated, and additionally with H-151 or not (n = 4). Data are mean ± s.e.m. P values were obtained with two-sided Student’s unpaired t-test (g-i) or one-way ANOVA followed by Tukey’s multiple comparisons tests (j). RE, relative expression. Source Data
Extended Data Fig. 9
Extended Data Fig. 9. SnRNA-seq in microglia and hippocampi of mg-cGasR241E mice.
a, UMAP plots of unsupervised clustering of enriched microglia (25 individual clusters), microglia specific expression score, identifying clusters 0-4 and 17 as microglia, and unsupervised clustering of filtered microglia. b, Violin plots of gene expression scores related to microglia states between individual mice. c, Representative UMAP plots of genes associated with, and differentially expressed between cGasWT/R241E and cGasWT/WT mice in the DAM and IFN subpopulations. d, Integration of cGasWT/R241E and cGasWT/WT microglia with 24m aged microglia from (Tabula Muris, GSM4505405). UMAP plots of IFN-MG and Louvain cluster 4 (IFN-related aged microglia), DAM-1/2-MG and ND-MG, mouse age and gene expression scoring of microglia-related subpopulation genes showing co-clustering of IFN populations and DAM/ND populations with aged microglia expressing high levels of DAM and neurodegenerative (ND) markers. e, Integration of cGasWT/R241E and cGasWT/WT microglia with disease-associated microglia from (Sala Frigerio, GSE127892, F_IFN: Interferon response microglia, F_ARM: Activated Response Microglia, F_TRM: Transiting response microglia, F_MHC-ARM: Major Histocompatibility high ARMs, F_MG: homeostatic microglia). UMAP plots of IFN-MG and F_IFN, DAM-1/2-MGs and F_ARM, F_TRM, F_MHC-ARM, MG and F_MG/2 and gene expression scoring of microglia-related subpopulation genes showing co-clustering of IFN populations and DAM/TRM populations with disease-associated microglia expressing high levels of IFN and DAM markers.
Extended Data Fig. 10
Extended Data Fig. 10. Effects of cGAS-activated microglia on brain cells.
a, mRNA expression levels of interferon-stimulated genes and activation markers in microglia from Tmem119-creERT2-cGasWT/R241E mice 4-OHT-treated or not (n = 3). b, Representative images and quantification of IBA1+ microglia B2M intensity from brain sections of Tmem119-creERT2-cGasWT/WT and Tmem119-creERT2-cGasWT/R241E mice (averaged per mouse, n = 5, from 10–15 cells). Arrows indicate IBA+ microglia. Scale bars, 50 μm. c, UMAP plots of sorted hippocampi nuclei’s unsupervised clustering (38 clusters) with identified oligodendrocytes-, astrocyte-, microglia- and neuron-specific gene expression scores. d, Volcano plots of genes differentially expressed between Tmem119-creERT2-cGASWT/WT and Tmem119-creERT2-cGASWT/R241E mice (n = 4) in oligodendrocytes, astrocyte, and microglia MG (FDR ≤ 0.05, Log2FC ≥ 0.3, genes listed in Supplementary Table 6). e, Morris water maze memory test of Tmem119-creERT2-cGasWT/WT (n = 6) and Tmem119-creERT2-cGasWT/R241E mice (data in Fig. 4h), additionally H-151-treated (n = 5) or not (n = 11), P = 1 × 10−5. f, Schematic illustrating neuronal cell co-culture experiments. g, Representative images of neurons (MAP2, red) cultured with microglia from Rosa26-creERT2-cGasWT/R241E mice (IBA1, green), 4-OHT-treated or not, and aTNF (represents n = 3 experiments). Scale bars, 100 μm. h, Relative survival of MAP2+ neurons cultured with conditioned medium from Rosa26-creERT2-cGasWT/R241E-isolated macrophages, 4-OHT-treated (n = 6 FOV) or not (n = 4 FOV), and with aTNF (n = 5 FOV), aIFNb (n = 6 FOV, from n = 3 mice) addition, P = 3 × 10−9. i, Relative survival of MAP2+ neurons treated with increasing doses of recombinant TNF (untreated n = 5, 50 ng/ml n = 5, 100 ng/ml n = 4 FOV), from 3 slides per condition, P = 1 × 10−5. Data are mean ± s.e.m. P values were obtained by one-sided (a) or two-sided (b) unpaired Student’s t-test, one-way ANOVA followed by Tukey’s multiple comparisons tests (h,i) or two-way ANOVA (e). Source Data

References

    1. Franceschi C, Garagnani P, Parini P, Giuliani C, Santoro A. Inflammaging: a new immune–metabolic viewpoint for age-related diseases. Nat. Rev. Endocrinol. 2018;14:576–590. doi: 10.1038/s41574-018-0059-4. - DOI - PubMed
    1. Frasca D, Blomberg BB. Inflammaging decreases adaptive and innate immune responses in mice and humans. Biogerontology. 2016;17:7–19. doi: 10.1007/s10522-015-9578-8. - DOI - PMC - PubMed
    1. Ablasser, A. & Chen, Z. J. cGAS in action: expanding roles in immunity and inflammation. Science363, eaat8657 (2019). - PubMed
    1. Partridge L, Fuentealba M, Kennedy BK. The quest to slow ageing through drug discovery. Nat. Rev. Drug Discov. 2020;19:513–532. doi: 10.1038/s41573-020-0067-7. - DOI - PubMed
    1. Gluck S, et al. Innate immune sensing of cytosolic chromatin fragments through cGAS promotes senescence. Nat. Cell Biol. 2017;19:1061–1070. doi: 10.1038/ncb3586. - DOI - PMC - PubMed

Publication types

MeSH terms