. 2023 Aug;620(7973):381-385.
doi: 10.1038/s41586-023-06378-w. Epub 2023 Aug 2.

Synergy and oxygen adaptation for development of next-generation probiotics

Affiliations

Synergy and oxygen adaptation for development of next-generation probiotics

Muhammad Tanweer Khan et al. Nature. 2023 Aug.

Abstract

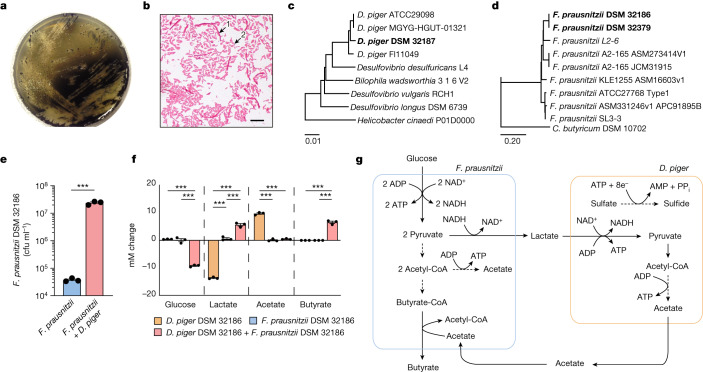
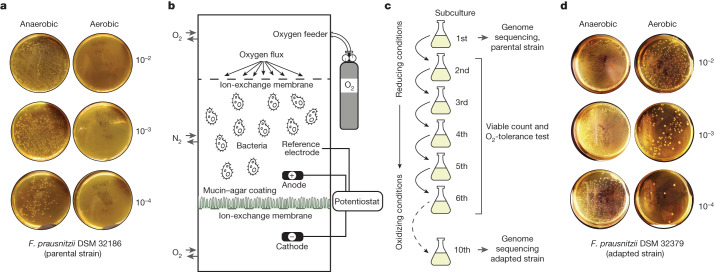
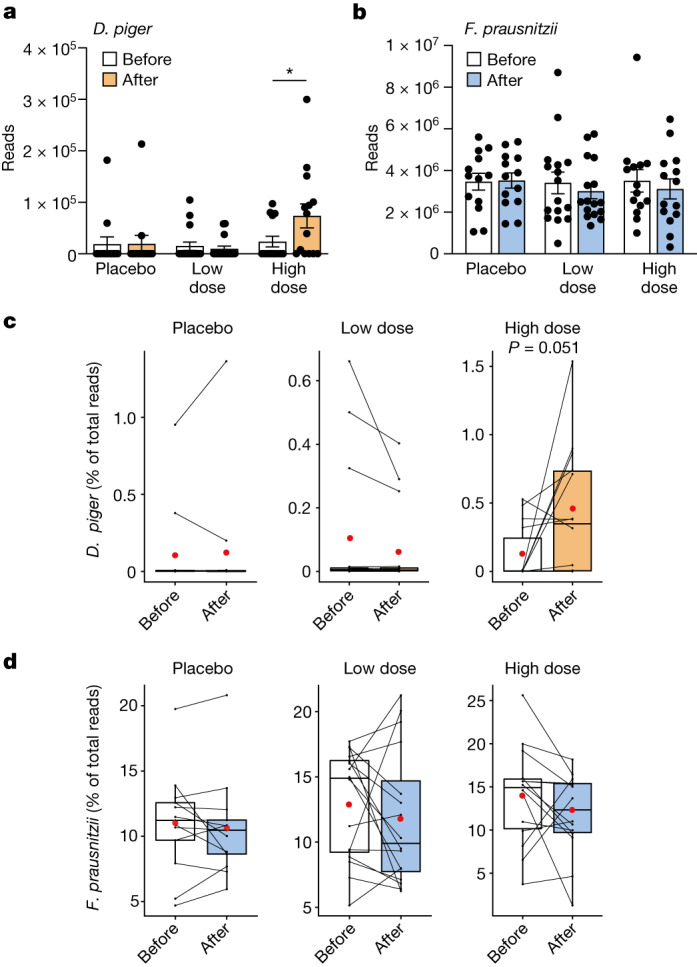
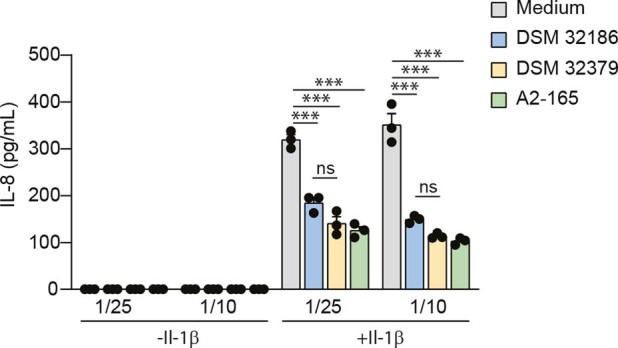
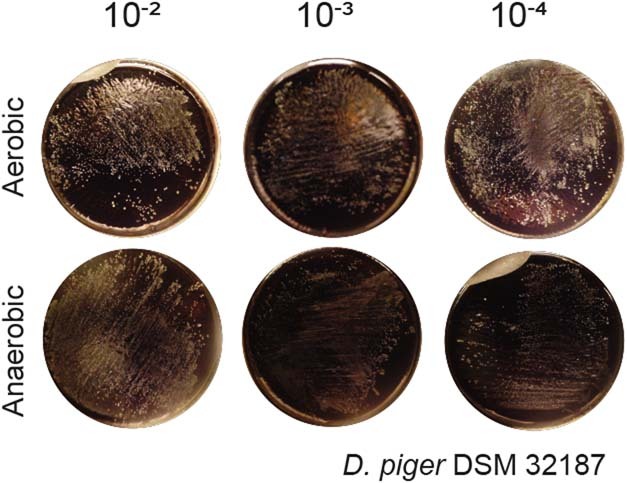
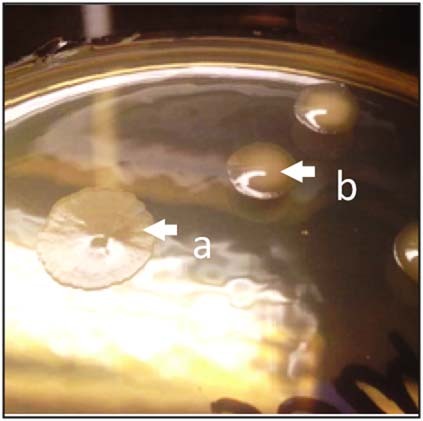
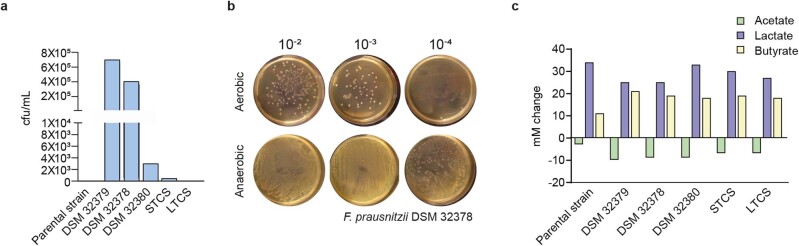
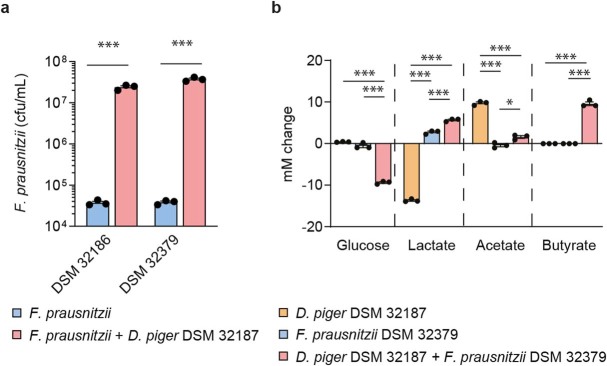
The human gut microbiota has gained interest as an environmental factor that may contribute to health or disease1. The development of next-generation probiotics is a promising strategy to modulate the gut microbiota and improve human health; however, several key candidate next-generation probiotics are strictly anaerobic2 and may require synergy with other bacteria for optimal growth. Faecalibacterium prausnitzii is a highly prevalent and abundant human gut bacterium associated with human health, but it has not yet been developed into probiotic formulations2. Here we describe the co-isolation of F. prausnitzii and Desulfovibrio piger, a sulfate-reducing bacterium, and their cross-feeding for growth and butyrate production. To produce a next-generation probiotic formulation, we adapted F. prausnitzii to tolerate oxygen exposure, and, in proof-of-concept studies, we demonstrate that the symbiotic product is tolerated by mice and humans (ClinicalTrials.gov identifier: NCT03728868 ) and is detected in the human gut in a subset of study participants. Our study describes a technology for the production of next-generation probiotics based on the adaptation of strictly anaerobic bacteria to tolerate oxygen exposures without a reduction in potential beneficial properties. Our technology may be used for the development of other strictly anaerobic strains as next-generation probiotics.


Conflict of interest statement

M.T.K. is employed in part by Metabogen AB and F.B. is founder of Metabogen AB. Metabogen AB has contributed with economic support and product for the human intervention, but was not involved in analyses of the data. F.B. receives research funding from Biogaia AB and is on the scientific advisory board of Bactolife A/S. The other authors declare no competing interests.

Figures

Fig. 1
Fig. 1. Co-isolation and cross-feeding of F. prausnitzii and D. piger in vitro.
a, Co-culture of F. prausnitzii DSM 32186 and D. piger DSM 32187 on PGM plates without supplementation of glucose or acetate. b, Gram staining of colonies from isolation of F. prausnitzii DSM 32186 and D. piger DSM 32187. Arrows indicate F. prausnitzii (long fusiform rods) (1) and D. piger (short rods) (2). Scale bar, 10 μm. c, Dendrogram illustrating the relationship between D. piger DSM 32187 and related genomes. d, Dendrogram illustrating the relationship between F. prausnitzii DSM 32186 and related genomes. e, The number of colony-forming units of F. prausnitzii DSM 32186 in monoculture and in co-culture with D. piger DSM 32187 under anaerobic conditions in mPGM (PGM containing 25 mM of glucose) for 24 h. P = 0.0003. f, Metabolite profiles of F. prausnitzii DSM 32186 and D. piger DSM 32187 cultivated as monocultures or co-culture under anaerobic conditions in mPGM medium for 24 h. Glucose: P = 0.0000031 (F. prausnitzii + D. piger versus D. piger), P = 0.0000038 (F. prausnitzii + D. piger versus F. prausnitzii); lactate: P = 0.0000001 (F. prausnitzii + D. piger versus D. piger), P = 0.0000005 (F. prausnitzii versus D. piger), P = 0.00014 (F. prausnitzii + D. piger versus F. prausnitzii); acetate: P = 0.0000004 (F. prausnitzii + D. piger versus D. piger), P = 0.0000003 (F. prausnitzii versus D. piger); butyrate: P = 0.000001(F. prausnitzii + D. piger versus D. piger), P = 0.0000031 (F. prausnitzii + D. piger versus F. prausnitzii). ‘mM change’ on the y axis indicates the difference in concentration from the inoculated medium at baseline. g, Schematic of the suggested cross-feeding between F. prausnitzii and D. piger as co-culture in mPGM. n = 3 independent experiments, ***P < 0.001 determined by two-tailed t-test (e) or one-way ANOVA (f). Data are mean ± s.e.m.
Fig. 2
Fig. 2. Development of oxygen tolerance in F. prausnitzii by stepwise adaptation.
a, Oxygen tolerance of F. prausnitzii DSM 32186 in YCFAG medium after exposure to ambient air for 20 min compared with control plates incubated in anaerobiosis. b, Schematic presentation of the modified simulated human redox intestinal model (m-SHIRM) bioreactor. c, The oxidative adaptation strategy used to develop oxygen-tolerant strains of F. prausnitzii. d, Oxygen tolerance of the oxygen-adapted F. prausnitzii DSM 32379 developed from the parental strain DSM 32186. Oxygen exposure performed as in Fig. 2a. Numbers to the right of agar plates in a,d indicate dilution.
Fig. 3
Fig. 3. Abundance of D. piger and F. prausnitzii in healthy volunteers after administration of D. piger DSM 32187 and F. prausnitzii DSM 32379 for eight weeks.
a,b, Total faecal counts of D. piger (P = 0.033) (high dose) (a) and F. prausnitzii (b) in metagenomic data before and after administration of the investigational product. c,d, The relative abundance of D. piger DSM 32187 (c) and F. prausnitzii DSM 32186 (d) in metagenomic data before and after administration. n = 13 (placebo), 16 (low dose) and 14 (high dose); **P < 0.01, two-sided Wilcoxon signed-rank test. Data are mean ± s.e.m.
Extended Data Fig. 1
Extended Data Fig. 1. Anti-inflammatory properties of parental F. prausnitzii DSM 32186 and oxygen tolerant DSM 32379.
Modulation of IL-1β-induced IL-8 secretion by Caco-2 cells in contact with F. prausnitzii supernatants (strain A2-165 (DSM 17677) included as reference). Cells were exposed to bacterial supernatant with or without 4 ng/mL IL-1β for 6 hr. The horizontal axis group labels indicate dilution of filtered medium from the F. prausnitzii culture. p = 0.025 (DSM 32186 vs. A2-165, 1/25), p = 0.0000089 (LYBHI vs. A2-165, 1/25), p = 0.00013 (LYBHI vs. DSM32186, 1/25), p = 0.000016 (LYBHI vs. DSM32379, 1/25), p = 0.0000028 (LYBHI vs. A2-165, 1/10), p = 0.000013 (LYBHI vs. DSM32186, 1/10), p = 0.0000039 (LYBHI vs. DSM32379, 1/10). n = 3, ***p < 0.001, *p < 0.05 as determined by One-way ANOVA. The results were repeated in two independent experiments. Data are presented as mean ± s.e.m.
Extended Data Fig. 2
Extended Data Fig. 2. Oxygen tolerance profile of D. piger DSM 32187 isolated as co-culture with F. prausnitzii DSM 32186.
Serial dilutions were inoculated on PGM plates that were exposed to ambient air for 20 min, and compared with control plates incubated in a Coy anaerobic chamber. Numbers beside agar plates indicate dilution.
Extended Data Fig. 3
Extended Data Fig. 3. Morphotype of the oxygen adapted F. prausnitzii DSM 32379.
Morphotype of F. prausnitzii DSM 32379 (arrow b) isolated from m-SHIRM bioreactor during the 10th subculture step. The parental strain F. prausnitzii DSM 32186 is shown as reference (arrow a).
Extended Data Fig. 4
Extended Data Fig. 4. Oxygen tolerance and fermentation profiles of F. prausnitzii oxygen tolerant variants.
a, Quantification of oxygen tolerance of parental strain and oxygen adapted variants in YCFAG. b, Oxygen tolerance of the oxygen adapted F. prausnitzii DSM 32378. Serial dilutions (shown on top) were inoculated on YCFAG plates and exposed to ambient air for 20 min, and compared with control plates incubated in anaerobiosis. c, Metabolite profile of parental DSM 32186 and oxygen adapted variants cultured in YCFAG medium. mM change on the y-axis indicates difference from inoculated medium at baseline.
Extended Data Fig. 5
Extended Data Fig. 5. Growth and cross-feeding of parental F. prausnitzii DSM 32186 or oxygen tolerant DSM 32379 with D. piger DSM 32187.
a, Colony forming units of parental F. prausnitzii DSM 32186 and oxygen tolerant DSM 32379 in mono-culture or co-culture with D. piger DSM 32187 in modified Postgate’s medium (i.e., Postgate’s medium containing 25 mM of glucose; mPGM) after 24 h of growth. p = 0.00000073 (DSM 32186), p = 0.00000022 (DSM 32379). b, Metabolite profiles of F. prausnitzii DSM 32379 and D. piger DSM 32187 as mono-cultures or co-culture in mPGM after 24 h of growth. Glucose: p = 0.0000008 (F. prausnitzii + D. piger vs. D. piger), p = 0.0000012 (F. prausnitzii + D. piger vs. F. prausnitzii); lactate: p = 0.0000000001 (F. prausnitzii + D. piger vs. D. piger), p = 0.0000000013 (F. prausnitzii vs. D. piger), p = 0.00018 (F. prausnitzii + D. piger vs. F. prausnitzii); acetate: p = 0.000005 (F. prausnitzii + D. piger vs. D. piger), p = 0.0000015 (F. prausnitzii vs. D. piger), p = 0.012 (F. prausnitzii + D. piger vs. F. prausnitzii); butyrate: p = 0.0000007 (F. prausnitzii + D. piger vs. D. piger), p = 0.0000007 (F. prausnitzii + D. piger vs. F. prausnitzii); mM change on the y-axis indicates difference from inoculated medium at baseline. n = 3 independent experiments. ***p < 0.001, *p < 0.05 as determined by two-tailed t-test (a) or one-way ANOVA (b) Data are presented as mean ± s.e.m.
Extended Data Fig. 6
Extended Data Fig. 6. Riboflavin-mediated extracellular electron shuttling of parental F. prausnitzii DSM 32186 and oxygen tolerant DSM 32379.
After energising the resting cells with glucose (100 mM), both parental F. prausnitzii DSM 32186 and oxygen tolerant DSM 32379 generated measurable current waves when riboflavin was spiked (200 µM), as previously described for A2-165.
Extended Data Fig. 7
Extended Data Fig. 7. Analysis of overall fecal microbiota composition in the healthy volunteers after administration of D. piger DSM 32187 and F. prausnitzii DSM 32379 for 8 weeks.
Principal coordinate analysis for the Bray-Curtis dissimilarity calculated based on species abundances for: a, fecal samples at baseline (r2 = 0.018; p = 1; adonis); b, fecal samples at the end of the administration (r2 = 0.040; p = 0.660; adonis); c, fecal samples from the placebo group at baseline (v2) and at the end of the administration (v5) (r2 = 0.009; p = 0.997; adonis); d, fecal samples from the low dose group at baseline (v2) and at the end of the administration (v5) (r2 = 0.014; p=0.971; adonis); e, fecal samples from the high dose group at baseline (v2) and at the end of the administration (v5) (r2 = 0.001; p = 0.996; adonis). Differences in composition were tested by a permutational multivariate ANOVA using the adonis2 function with 10,000 permutations in the vegan package in R (https://github.com/vegandevs/vegan/). Adjustments for multiple comparisons were made. The dots in the plots indicate fecal samples the 43 individuals with metagenomic data: placebo, n = 13; low dose, n = 16; high dose, n = 14. The analyses show no difference in microbiota composition among the groups at baseline or at the end of the administration (panels a and b, respectively), and no difference at the end of the administration compared to baseline in any of the groups (panels c, d and e).
Extended Data Fig. 8
Extended Data Fig. 8. Genome capture for the abundance of F. prausnitzii DSM 32186 and D. piger DSM 32187 in fecal samples from the high dose group.
Change in relative abundance in samples with high baseline D. piger DSM 32187 (> 0.05% of total microbiota; n = 4, p = 0.875, two-sided Wilcoxon signed-rank test) and low baseline D.piger DSM 32187 (<0.05% of total microbiota; n = 10, p = 0.042, Wilcoxon signed-rank test). v2, fecal samples at baseline; v5, fecal sample at the end of the administration. For box plots the middle line is the median, the lower and upper hinges are the first and third quartiles, the whiskers extend from the hinge to the largest and smallest value no further than 1.5 × the inter-quartile range (IQR).
Extended Data Fig. 9
Extended Data Fig. 9. Measurement of hydrogen sulfide in fecal samples.
Hydrogen sulfide was measured in fecal samples at baseline as well as at the end of the administration (40 individuals: placebo, n = 12; low dose, n = 16; high dose, n = 12; no sufficient material available for 1 individual in the placebo and 2 in the high dose groups). Two-sided Wilcoxon signed-rank test was performed. Data are presented as mean ± s.e.m.

Comment in

References

    1. Schroeder, B. O. & Backhed, F. Signals from the gut microbiota to distant organs in physiology and disease. Nat. Med.22, 1079–1089 (2016). 10.1038/nm.4185 - DOI - PubMed
    1. O’Toole, P. W., Marchesi, J. R. & Hill, C. Next-generation probiotics: the spectrum from probiotics to live biotherapeutics. Nat. Microbiol.2, 17057 (2017). 10.1038/nmicrobiol.2017.57 - DOI - PubMed
    1. Sender, R., Fuchs, S. & Milo, R. Revised estimates for the number of human and bacteria cells in the body. PLoS Biol.14, e1002533 (2016). 10.1371/journal.pbio.1002533 - DOI - PMC - PubMed
    1. Li, J. et al. An integrated catalog of reference genes in the human gut microbiome. Nat. Biotechnol.32, 834–841 (2014). 10.1038/nbt.2942 - DOI - PubMed
    1. Allin, K. H. et al. Aberrant intestinal microbiota in individuals with prediabetes. Diabetologia61, 810–820 (2018). 10.1007/s00125-018-4550-1 - DOI - PMC - PubMed

Publication types

Supplementary concepts

Associated data