Clinical Trial
. 2023 Aug;620(7973):409-416.
doi: 10.1038/s41586-023-06367-z. Epub 2023 Aug 2.

Netrin-1 blockade inhibits tumour growth and EMT features in endometrial cancer

Affiliations
Clinical Trial

Netrin-1 blockade inhibits tumour growth and EMT features in endometrial cancer

Philippe A Cassier et al. Nature. 2023 Aug.

Abstract

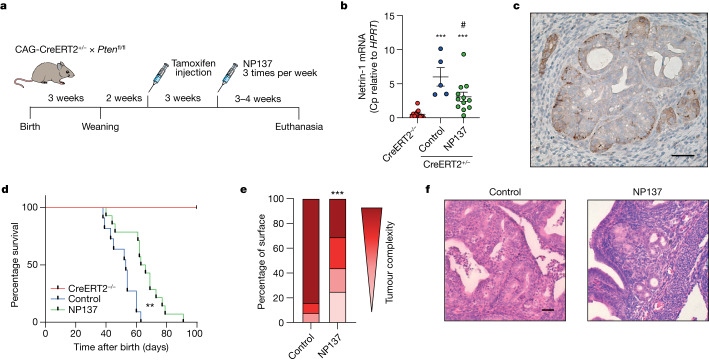
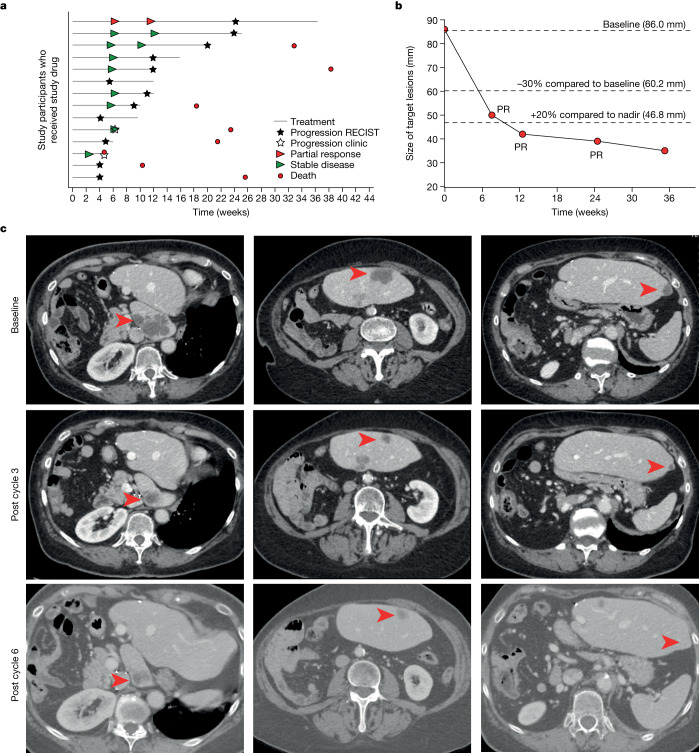
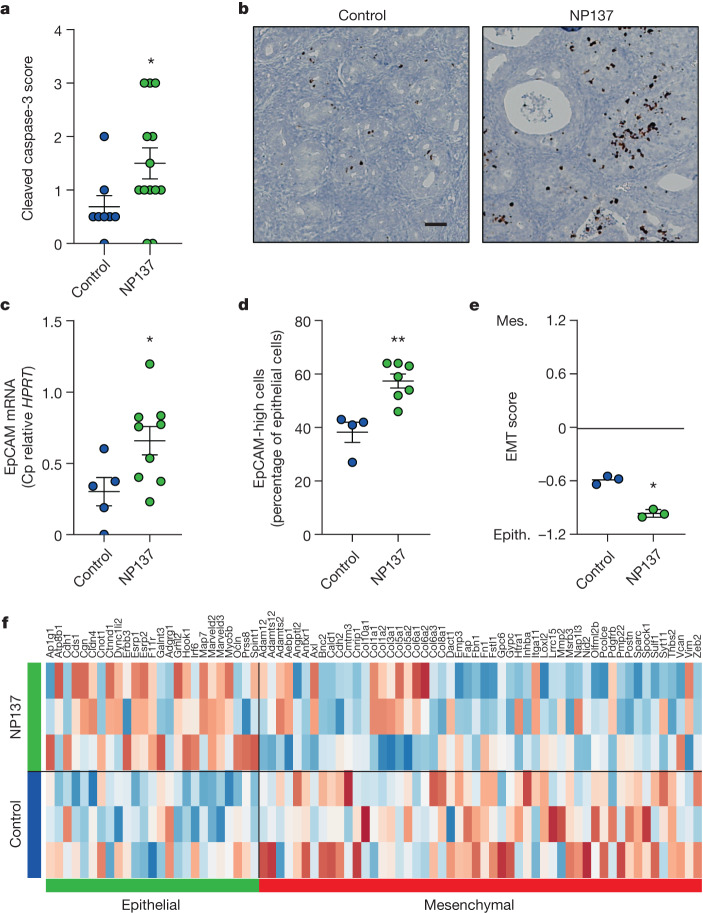
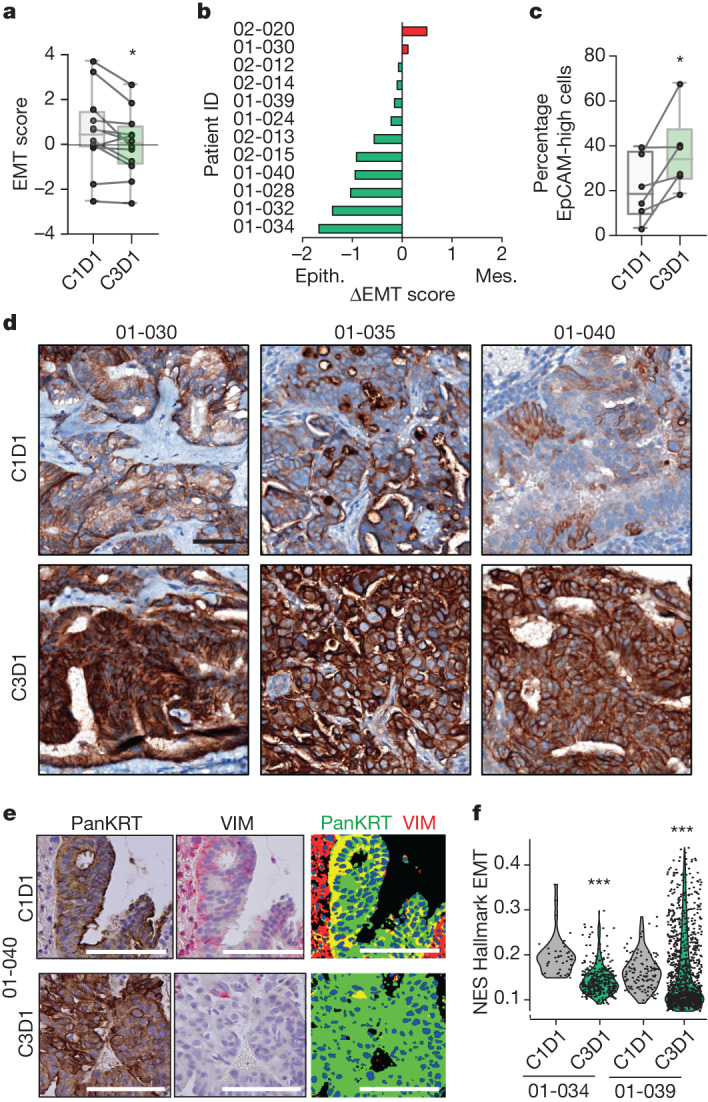
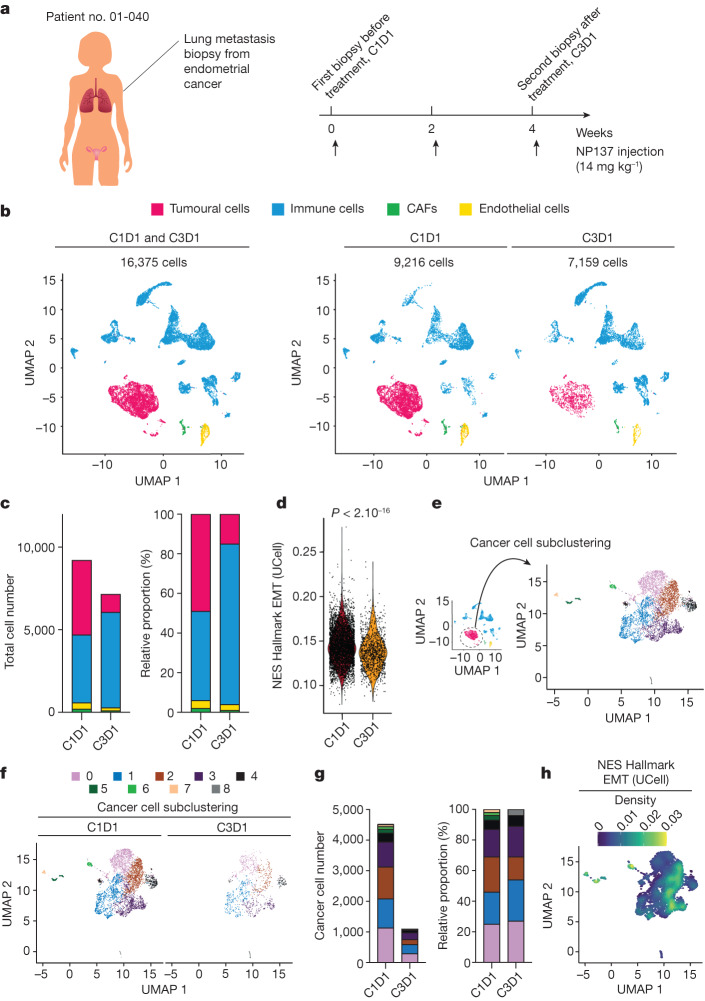
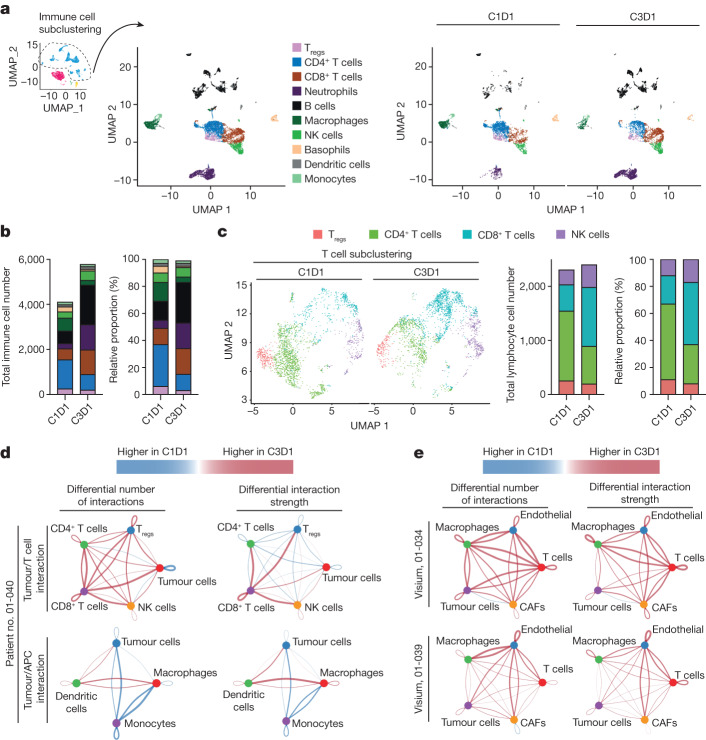
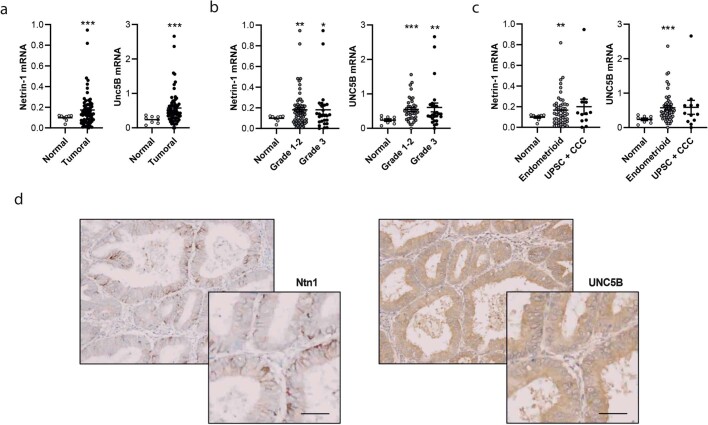
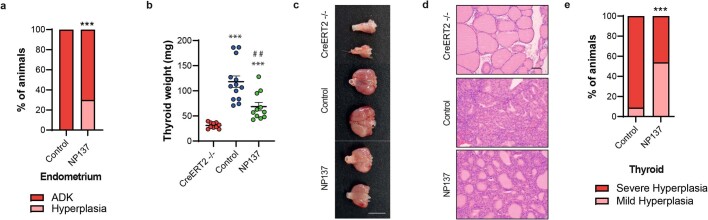
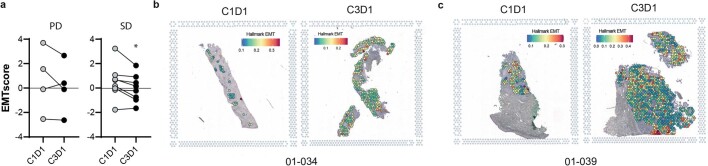
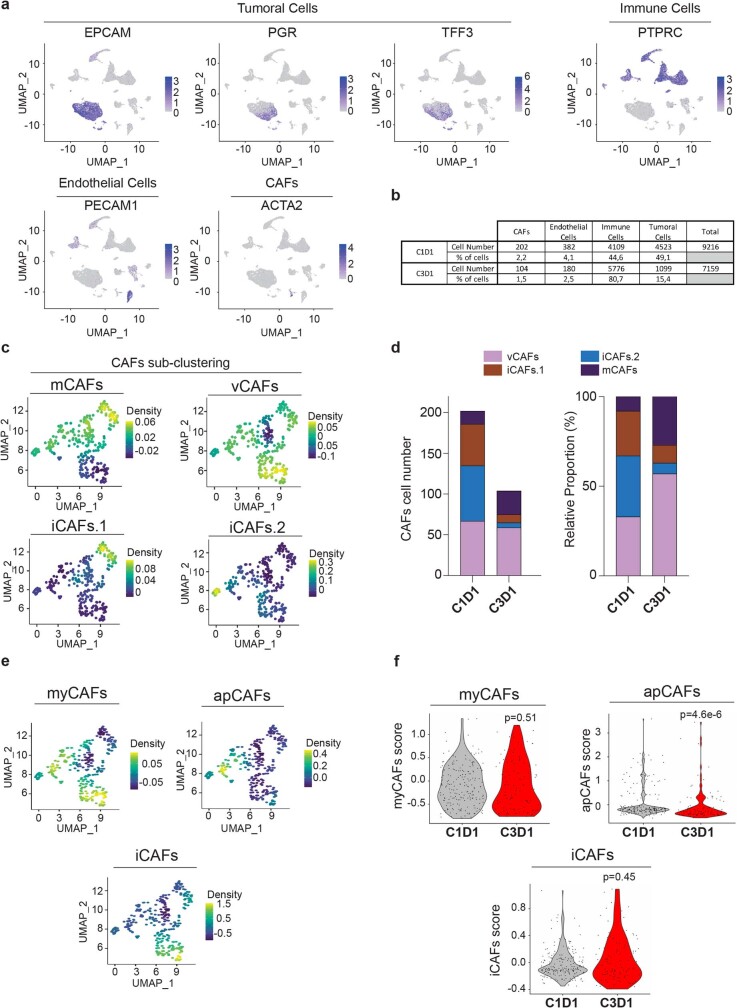
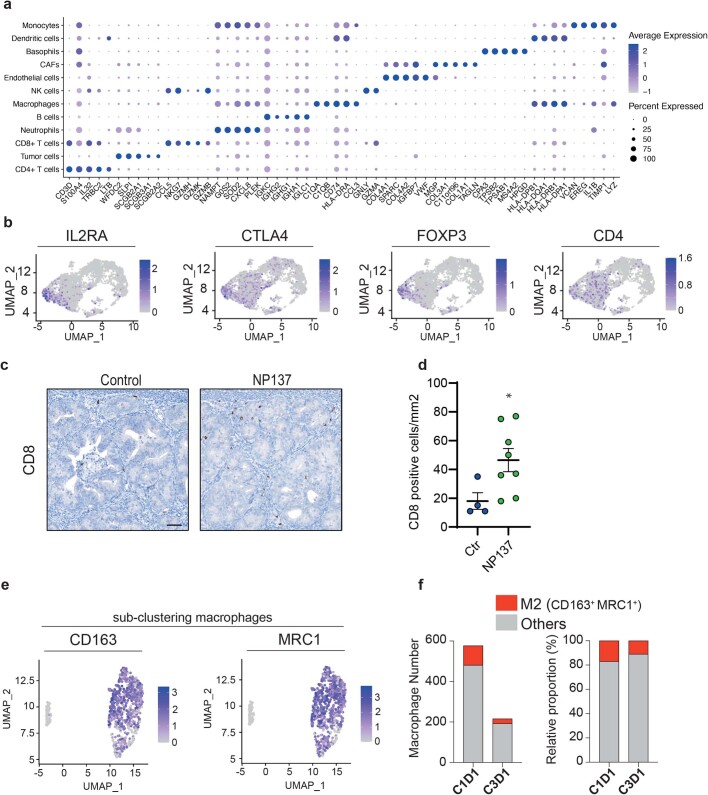
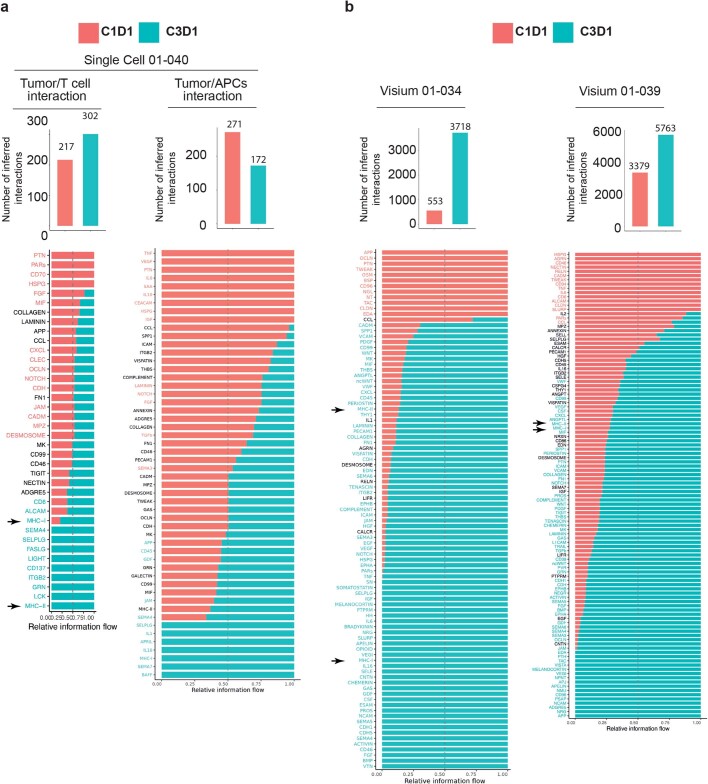
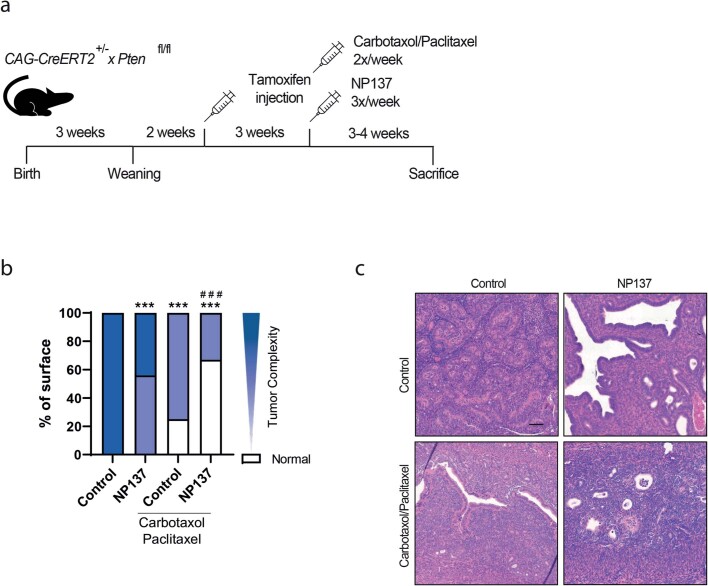
Netrin-1 is upregulated in cancers as a protumoural mechanism1. Here we describe netrin-1 upregulation in a majority of human endometrial carcinomas (ECs) and demonstrate that netrin-1 blockade, using an anti-netrin-1 antibody (NP137), is effective in reduction of tumour progression in an EC mouse model. We next examined the efficacy of NP137, as a first-in-class single agent, in a Phase I trial comprising 14 patients with advanced EC. As best response we observed 8 stable disease (8 out of 14, 57.1%) and 1 objective response as RECIST v.1.1 (partial response, 1 out of 14 (7.1%), 51.16% reduction in target lesions at 6 weeks and up to 54.65% reduction during the following 6 months). To evaluate the NP137 mechanism of action, mouse tumour gene profiling was performed, and we observed, in addition to cell death induction, that NP137 inhibited epithelial-to-mesenchymal transition (EMT). By performing bulk RNA sequencing (RNA-seq), spatial transcriptomics and single-cell RNA-seq on paired pre- and on-treatment biopsies from patients with EC from the NP137 trial, we noted a net reduction in tumour EMT. This was associated with changes in immune infiltrate and increased interactions between cancer cells and the tumour microenvironment. Given the importance of EMT in resistance to current standards of care2, we show in the EC mouse model that a combination of NP137 with carboplatin-paclitaxel outperformed carboplatin-paclitaxel alone. Our results identify netrin-1 blockade as a clinical strategy triggering both tumour debulking and EMT inhibition, thus potentially alleviating resistance to standard treatments.


Conflict of interest statement

A.B. and P.M. declare a conflict of interest as founders and shareholders of NETRIS Pharma. D.N., B.D., M.B., J.L. and P.M. declare a conflict of interest as employees of NETRIS Pharma. A.B., A.P. and N.R. declare a conflict of interest as consultants for NETRIS Pharma. No patent has been filed based on this study. The NP137 patent is fully owned by NETRIS Pharma and none of the authors are inventors. The remaining authors declare no competing interests.

Figures

Fig. 1
Fig. 1. Netrin-1 blockade inhibits endometrial adenocarcinoma progression in preclinical models.
a, Diagram showing the experimental strategy used to induce Pten deletion into CAG-CreERT2+/−Pten f/f mice using tamoxifen injection and either treatment with NP137 or control. Mice were euthanized if they experienced breathing difficulties. b, Relative messenger RNA expression of netrin-1 as defined by RT–qPCR in the endometrium of CreERT2–/– animals (n = 12) and in tumours induced following Pten deletion (tamoxifen injection) in CreERT2+/− Pten f/f mice intraperitoneally treated with NP137 (10 mg kg–1) (n = 12) and in control (n = 5). Bars are mean ± s.e.m.; data normalized to HPRT gene; Cp, crossing point. ***P < 0.001 CreERT2+/– versus CreERT2–/– and #P = 0.0284 NP137 versus control by Mann–Whitney two-sided test. c, Representative netrin-1 IHC analysis of EC in CreERT2+/− Pten f/f mouse following 6 weeks of tamoxifen injection. Scale bar, 100 µm. d, Kaplan–Meier curves indicating percentage survival for normal mice (CreERT2–/–, red, n = 8), Pten-deleted mice treated with NP137 (green, n = 14) and control (blue, n = 11). **P < 0.01 by Mantel–Cox test. e, Quantification by pathologists of endometrial lesions, presented by tumour complexity (progressively darker colour from hyperplasia through mild, then moderate, endometrial intraepithelial neoplasia to adenocarcinoma) between control mice (n = 12) and those treated with NP137 mAb (n = 16). ***P < 0.001 by chi-squared test and Fisher’s two-sided exact test. f, Representative images of H&E staining of uterus from mice killed at week 6 of tamoxifen injection, those treated with NP137 and control. Scale bar, 50 µm. Source data
Fig. 2
Fig. 2. Clinical response in patients with EC following NP137 treatment.
ac, Fourteen patients (median age, 68.3 years (44.7–80.6); ECOG performance status 0, n = 5; ECOG performance status 1, n = 9) who had advanced or metastatic stage IV EC and were previously treated with a median of three (2.0–6.0) systemic treatment lines before inclusion were treated with NP137 (14 mg kg–1, n = 11 patients or 20 mg kg–1, n = 3 patients) with a median of 5.5 injections (2.0–17.0). a, Each bar represents one patient. Best responses to treatment are presented based on investigator review (according to protocol). Filled stars, radiological progression as per RECIST v.1.1; hollow stars, clinical progression as per investigator assessment; red arrowheads, partial response according to RECIST v.1.1; green arrowheads, stable disease according to RECIST v.1.1; red circles, death. b, Graph presenting the size evolution of target lesions (sum of two liver target lesions) from patient no. 02-004 treated intravenously with 14 mg kg–1 NP137 Q2W. Tumour response was assessed as partial response (PR) at 6 weeks and then at 3, 6 and 9 months; −30% reduction in target lesions size compared to baseline indicates partial response according to RECIST v.1.1. A dotted line showing the 20% increase in target lesions size compared to the nadir (minimum lesions size upon NP137 treatment) is also indicated. c, Abdominal transversal scans presenting liver metastasis at baseline, C3D1 (post cycle 3) and C6D1 (post cycle 6) from patient no. 02-004. Red arrowheads indicate lesions of interest. Source data
Fig. 3
Fig. 3. Netrin-1 blockade triggers apoptosis and EMT inhibition in a preclinical mouse model.
a, Quantification of cell death using cleaved caspase-3 IHC in control (n = 8) and NP137 (n = 13)-treated tumours of CreERT2+/−Pten f/f mice. Bars are mean ± s.e.m.; *P = 0.0389 by Mann–Whitney two-sided test. b, Representative images of cleaved caspase-3 staining of a. Scale bar, 100 µm. c, Relative mRNA expression of EpCAM epithelial marker by RT–qPCR in mouse tumours, control (n = 5) and NP137 (n = 9). Bars are mean ± s.e.m., data normalized to HPRT gene; *P = 0.032 by Mann–Whitney two-sided test. d, Percentage of EpCAM high-expressing cells in control tumours (n = 4) versus NP137-treated (n = 7) as assessed by IHC. Bars are mean ± s.e.m.; **P = 0.0061 by Mann–Whitney two-sided test. e, EMT score (mouse orthologues of epithelial (epith.) or mesenchymal (mes.) signature from ref. ) analysis derived from RNA-seq data, between control (n = 3) and NP137 (n = 3)-treated mice. Bars are mean ± s.e.m.; *P = 0.05 by Mann–Whitney one-sided test. f, Heatmap derived from RNA-seq data showing expression of EMT genes; control (n = 3) and NP137 (n = 3). Note that epithelial genes were upregulated under NP137-treated condition whereas mesenchymal genes were downregulated. Source data
Fig. 4
Fig. 4. NP137 treatment inhibits EMT in patients with EC.
a, Diagram showing EMT score calculated with Mak’s signature from RNA-seq of biopsies before (C1D1) and following two cycles of NP137 (C3D1) treatment (n = 12). Boxplots represent mean (25th–75th), whiskers range from minimum to maximum values and paired samples are identified on single-value representation; *P = 0.0161 by two-sided t-test. b, Swimmer plots showing individual evolution of EMT score for each patient; ΔEMT is the EMT score at C3D1 minus that at C1D1; ΔEMT < 0 means evolution towards epithelial phenotype (green) and >0 towards mesenchymal (red). c, Percentage of EpCAM high-expressing cells in C1D1 versus C3D1 biopsy samples as identified by IHC; *P = 0.0313 by Wilcoxon two-sided test (n = 6 patients). Boxplots represent mean (25th–75th), whiskers range from minimum to maximum values and paired samples are identified on single-value representation. d, Representative IHC of EpCAM in tumours in C1D1 and C3D1 for patient nos. 01-030, 01-035 and 01-040. Scale bar, 50 µm. e, Representative images of pancytokeratin (PanKRT) and vimentin (VIM) expression (colocalization of pancytokeratin (green) and vimentin (red) in the merged picture, right) in primary endometrial adenocarcinoma from patient no. 01-040 before and after NP137 treatment. Scale bars, 50 μm. Quantifications were performed on the full slides and similar results were observed for patient nos. 01-030 and 01-034. f, Analysis of tumour cell compartment in patient nos. 01-034 and 01-039 by Visium spatial gene expression. Violin plot of EMT UCell normalized enrichment score (NES) from tumoural histologically selected Visium spot between cells of C1D1 and C3D1 biopsy. ***P < 0.01 by Mann–Whitney two-sided test. Source data
Fig. 5
Fig. 5. Single-cell RNA-seq analysis pre and post biopsy of a patient with EC.
a, Illustration of patient no. 01-040 with two lung metastasis biopsies—one before treatment (C1D1), and one after two cycles of NP137 treatment (C3D1). b, Uniform manifold approximation and projection (UMAP) plot of 16,375 cells from two lung metastasis biopsies (left) or before treatment with 9,216 cells (C1D1, middle) and after treatment with 7,159 cells (C3D1, right), coloured by their four major cell types. c, Composition of major cell types in C1D1 and C3D1 biopsies. Left, total cell numbers in each condition; right, proportion of cells in each sample (note that cancer cell number decreased markedly after treatment). Colour coding as in b. d, Violin plot of EMT UCell enrichment score between cells of C1D1 and C3D1 biopsy (two-sided Wilcoxon test, P < 2.10−16). e, UMAP plot of subclustered cancer cells from the whole integrated dataset (C1D1 + C3D1). f, UMAP plot of subclustered cancer cells before and after treatment. g, Composition of cancer cell clusters in C1D1 and C3D1 biopsies. Left, cell numbers; right, proportion of cells in each sample (note that cancer cell number decreased markedly after treatment). h, Density plot of EMT UCell enrichment score showing clusters 2/3 with strong EMT enrichment (note that cluster 2 decreased after treatment (g, right)).
Fig. 6
Fig. 6. Immunological changes observed from single-cell RNA-seq analysis pre and post biopsy of a patient with endometrial adenocarcinoma.
a, UMAP plots of subclustered immune cells from the whole integrated dataset (C1D1 + C3D1) for patient no. 01-040, illustrating the composition of major immune cell clusters in C1D1/C3D1 biopsies (left) or separately for C1D1 and C3D1 (right). b, Number (left) and proportion (right) of immune cell types in each sample. c, Left, UMAP plot of subclustered lymphocyte/NK cells from the whole integrated dataset (C1D1 and C3D1). T regulatory cells (Tregs) were determined according to the markers shown in Extended Data Fig. 5b. Middle, right,composition of T/NK cell clusters in C1D1 and C3D1 biopsies; cell number (middle) and proportion of cells in each sample (right). Note that cytotoxic CD8+ T cell number increased after treatment whereas that of CD4+ cells decreased. d, CellChat analysis of single-cell assay in patient no. 01-040, showing the differential (C3D1/C1D1) number of interactions (left) and strength of interactions (right) between tumour cells and lymphocytes (top) and between tumour cells and APCs (bottom). e, CellChat analysis of Visium assay on patient nos. 01-034 (top) and 01-039 (bottom), showing the differential (C3D1/C1D1) number of interactions (left) and strength of interactions (right) between tumour cells and stromal cells. Line colours indicate higher numbers or strength interactions in C3D1 (red) and C1D1 (blue). Segment size is proportional to the difference in the number or strength of interactions between C3D1 and C1D1.
Extended Data Fig. 1
Extended Data Fig. 1. Netrin-1 and UNC5B are up-regulated in human endometrium adenocarcinoma.
a, b, c, Relative mRNA expression of netrin-1 (left) and UNC5B (right) in patients with endometrial carcinoma (n = 73) compared to unpaired normal tissue (n = 8) (a) global expression (*** P < 0.001 by T-test one-sided) (b) expression reported to grades: Grade1+2 n = 38, Grade 3 n = 26, (** P = 0.002 and * P = 0.038, respectively normal vs grade 1-2 and grade 3 for Ntn1 and p < 0.001 and ** p = 0.004 for Unc5B by T-test one-sided) (c) expression reported to types: Endometrioid n = 51, UPSC+CCC n = 12 (UPSC: Uterine papillary serous carcinoma, CCC: Clear cell carcinoma) (** p = 0.002 and * p = 0.097, respectively normal vs endometrioid and UPSC+CCC for Ntn1 and *** p < 0.001 for Unc5B by T-test one-sided), defined by qRT-PCR (Bars are mean values mean ± s.e.m., data are normalized to TBP, PPIA and GUSB genes). d, Representative netrin-1 and UNC5B immunohistochemistry analysis of an endometrioid carcinoma (grade 1). 2x magnification field (bottom right). Scale bar (represented by a line,100 µm). Source data
Extended Data Fig. 2
Extended Data Fig. 2. Netrin-1 blockade impacts tumor growth in a preclinical mouse model.
a, Percentage of mice treated with control (n = 12) or NP137 (n = 16), showing hyperplasia or Adenocarcinoma (ADK) of the endometrium. *** P < 0.001 by Chi-square test and Fischer’s exact test. b, Quantification of the thyroid weight in CreERT2−/− mice (n = 10) or after Pten deletion (Tamoxifen injection) in CreERT2+/−x Pten f/f mice treated with control (n = 13) or NP137 (n = 11). Bars are mean values mean ± s.e.m., *** P < 0.001 against CreERT2−/−; ## P = 0.015 NP137 against control by Mann-Whitney two-sided. c, Representative images of the thyroids in panel b. d, Representative images of H&E staining of thyroid from mice sacrificed in weeks 5-6 after tamoxifen injection. Scale bar represented by a line, (100 µm) similar observations have been done on the full cohort. e, Percentage of mice showing mild or severe hyperplasia of the thyroid in mice treated (n = 16) or not with NP137 (n = 12). *** P < 0.001 by Chi-square test and Fischer’s exact test. Source data
Extended Data Fig. 3
Extended Data Fig. 3. Pre/post biopsies analysis by bulk RNAseq or Visium Spatial Gene Expression.
a. Diagram showing EMT-score calculated with the Mak’s signature as in Fig. 4a. Patients are segregated in PD (progression at 6 weeks) and SD (stable disease at least 6 weeks) according to their clinical benefit determined upon centralized review. * P = 0.0023; by T-Test two-sided. b, c, H&E-stained tissue from C1D1 (left panel) and C3D1 (right panel) with EMT score enrichment on Visium tumoral spot by UCell method. Source data
Extended Data Fig. 4
Extended Data Fig. 4. Pre/post biopsies scRNAseq identify global cell types and cancer cell sub-clustering.
a, UMAP plot with the 2 integrated samples of patient 01-040 showing the normalized expression of major cell type markers: immune cells (PTPRC, also known as CD45), endothelial cells (PECAM), tumor cells (EPCAM, PGR, TFF3), CAF cells (ACTA2). b, Table showing the cell number in each cell type. c, Identification of CAFs subtypes (markers used: mCAFs: MMP2, DCN, COL12A1, FBLN1; vCAFs : MCAM, COL4A1, COL18A1; iCAFs.1: MUSTN1, TAGLN, S100A4, CXCL2; iCAFs.2: S100A8, CXCL8, SPLI). d, CAFs subcluster composition analysis, the left panel shows the total CAFs numbers per cluster in each condition and the right panel shows the proportion of CAFs per cluster in each samples. e, UMAP plot of sub-clustered CAFs showing other CAFs subtypes (markers used: myCAFs: ACTA2, CTGF, POSTN, PDGFR, TGFB1, COL1; iCAFs : IL6, CXCL1, CCL2, PDGFRA, HAS1, FAP, IL11, LIF; apCAFs: H2-AB1, CD74, SAA3). f, Violin plot showing CAFs subtypes scores before and after treatment (C1D1 or C3D1) (Wilcoxon test, two-sided).
Extended Data Fig. 5
Extended Data Fig. 5. Pre/post biopsies scRNAseq identify various immune cell types.
a, Validation of the cluster annotation with dot plot showing top 5 genes markers that are enriched in clusters which were previously characterized by automatic cell annotation package. b, Tregs cluster identification with UMAP plot of sub-clustered lymphocyte showing Tregs expression markers: IL2RA, CTLA4, FOXP3 and CD4. c,d CD8 detection and quantification by IHC in mouse Pten driven tumors treated with control or NP137. c, representative image of IHC. Scale bar = 50 µm. d, Quantification of CD8 positive cells in control tumors (n = 4) vs NP137 treated (n = 8). Bars are mean values mean ± s.e.m., * P = 0.0162 by Mann-Whitney two-sided. e, Analysis of M2-macrophages, we used CD163 and MRC1 as markers on the UMAP plot of sub-clustered macrophages with the 2 integrated samples. f, The 2 panels show the M2 cell type number and the proportion of M2 in each sample compared to the total macrophage number. Source data
Extended Data Fig. 6
Extended Data Fig. 6. NP137 treatment impacts tumor cell communication with immune cell types.
a, Histograms showing the number of inferred interaction (upper panel) from the single cell RNA seq analysis (patient 01-040) by CellChat packages and (lower panel) the significant genes were ranked based on their differences of overall information flow between C1D1 and C3D1. The left panels investigate the communication between Tumor and lymphocyte cells. The right panels investigate the communication between Tumor and APCs. b, Histograms showing the number of inferred interaction (upper panel) from the Visium assays (patients 01-034 and 01-039) by CellChat packages and (lower panel) the significant genes were ranked based on their differences of overall information flow between C1D1 and C3D1. The left and right panels correspond respectively to patient 01-034 and 01-039. Red and green are more enriched in C1D1 and C3D1 sample, respectively. Arrows indicate MHC-I and II genes which expression is enriched in C3D1 samples.
Extended Data Fig. 7
Extended Data Fig. 7. Combining NP137 and chemotherapy in Pten mutant mice.
a, Diagram showing the experimental strategy to combine NP137 (10 mg/Kg, I.P. 3x/week) and Carboplatin Paclitaxel (respectively 30 mg/Kg and 15 mg/Kg, I.P. 2x/week) treatments in CAG-CreERT2+/−Pten f/f mice. b, Quantification by pathologists of the endometrial lesions presented by tumor complexities (progressively darker color from normal through hyperplasia, slight EIN (Endometrial intraepithelial neoplasia), moderate EIN and to adenocarcinoma) between mice treated with control (n = 6) or NP137 Ab (n = 9) alone or in combination with Carboplatin and Paclitaxel (n = 4 and 6). *** P < 0.001 against control alone; ###P < 0.001 against control with chemotherapy by Chi-square test and Fischer’s exact test. c, Representative H&E staining pictures of uterus from mice sacrificed in weeks 5-6 after tamoxifen injection, treated with control or NP137 alone or in combination with chemotherapy. Scale bar (represented by a line, 100 µm). Source data

Comment in

References

    1. Mehlen P, Delloye-Bourgeois C, Chédotal A. Novel roles for Slits and netrins: axon guidance cues as anticancer targets? Nat. Rev. Cancer. 2011;11:188–197. doi: 10.1038/nrc3005. - DOI - PubMed
    1. Shibue T, Weinberg RA. EMT, CSCs, and drug resistance: the mechanistic link and clinical implications. Nat. Rev. Clin. Oncol. 2017;14:611–629. doi: 10.1038/nrclinonc.2017.44. - DOI - PMC - PubMed
    1. Brisset M, Grandin M, Bernet A, Mehlen P, Hollande F. Dependence receptors: new targets for cancer therapy. EMBO Mol. Med. 2021;13:e14495. doi: 10.15252/emmm.202114495. - DOI - PMC - PubMed
    1. Wu Z, et al. Long-range guidance of spinal commissural axons by netrin1 and sonic hedgehog from midline floor plate cells. Neuron. 2019;101:635–647. doi: 10.1016/j.neuron.2018.12.025. - DOI - PubMed
    1. Sung P-J, et al. Cancer-associated fibroblasts produce netrin-1 to control cancer cell plasticity. Cancer Res. 2019;79:3651–3661. doi: 10.1158/0008-5472.CAN-18-2952. - DOI - PubMed

Publication types

MeSH terms