. 2023 Aug;620(7975):830-838.
doi: 10.1038/s41586-023-06389-7. Epub 2023 Aug 2.

Einkorn genomics sheds light on history of the oldest domesticated wheat

Affiliations

Einkorn genomics sheds light on history of the oldest domesticated wheat

Hanin Ibrahim Ahmed et al. Nature. 2023 Aug.

Abstract

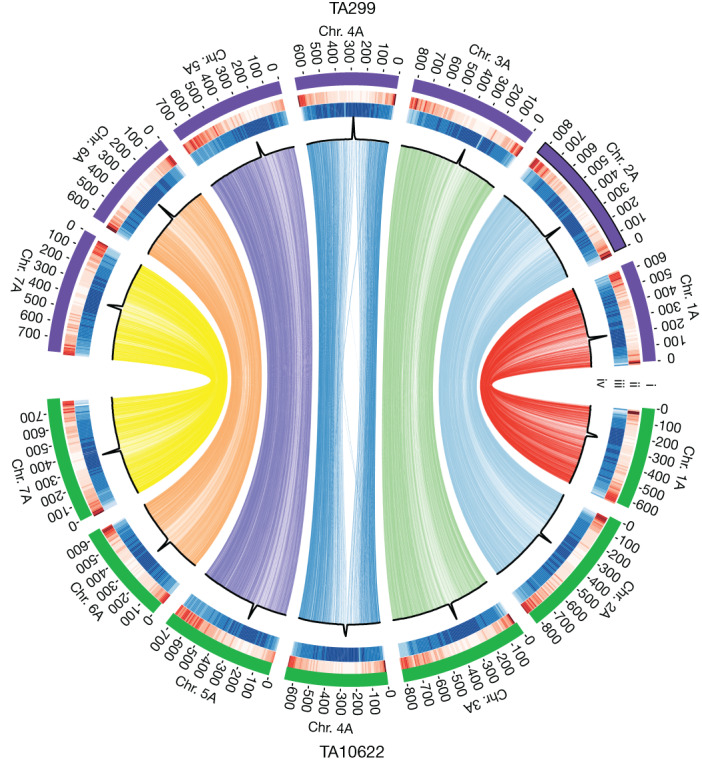
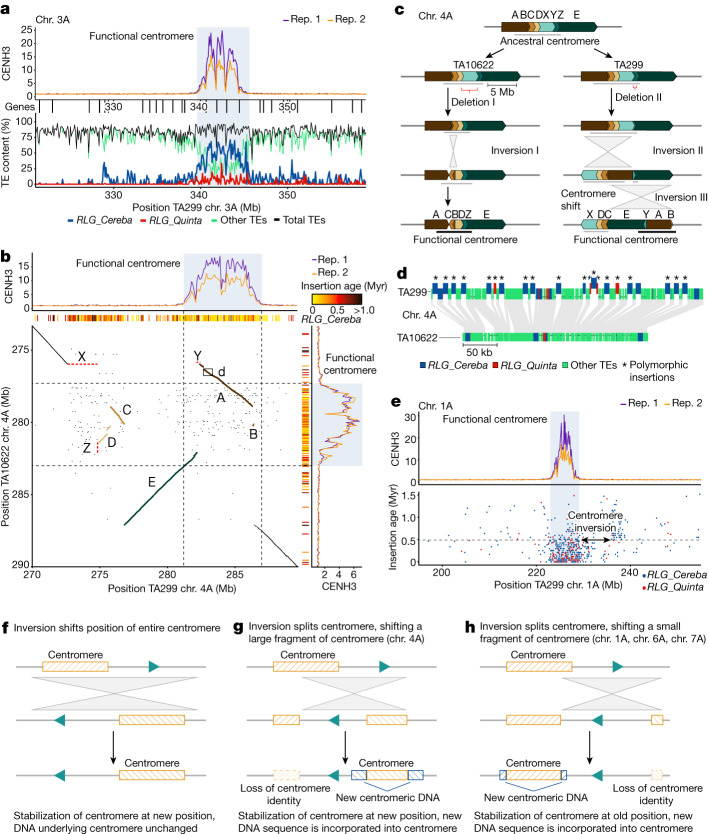
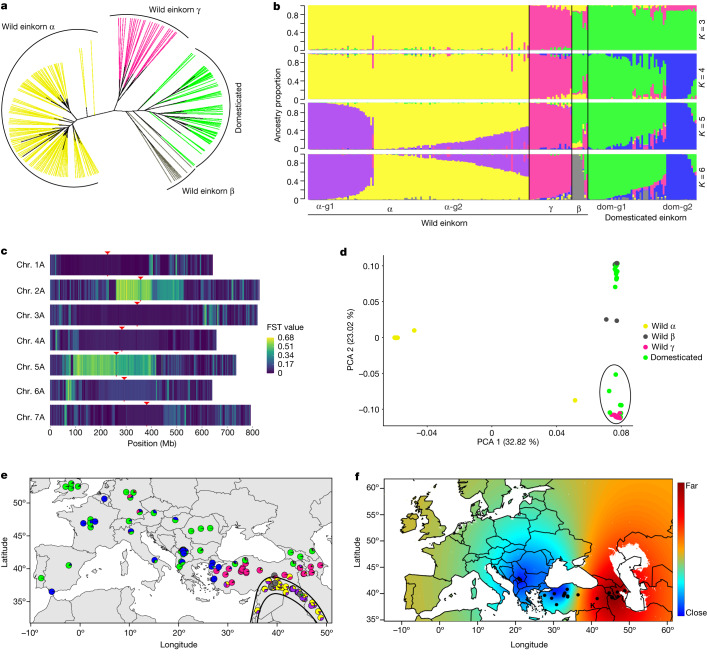
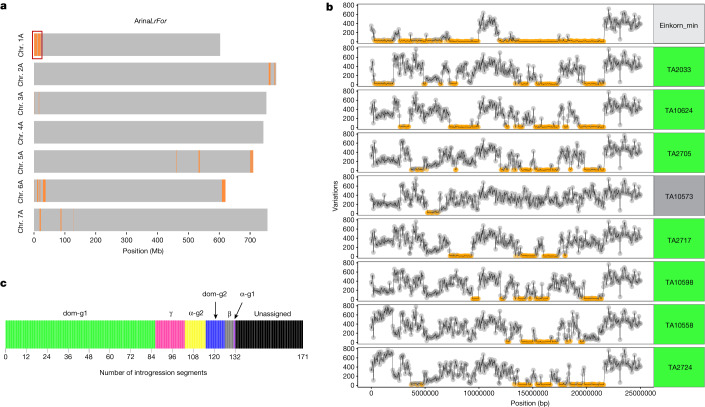
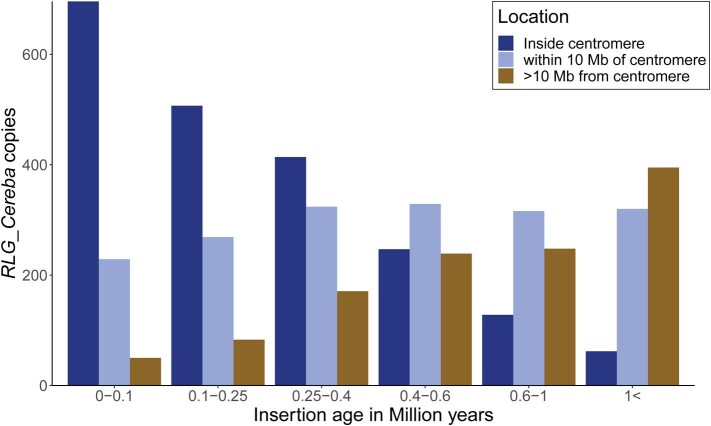
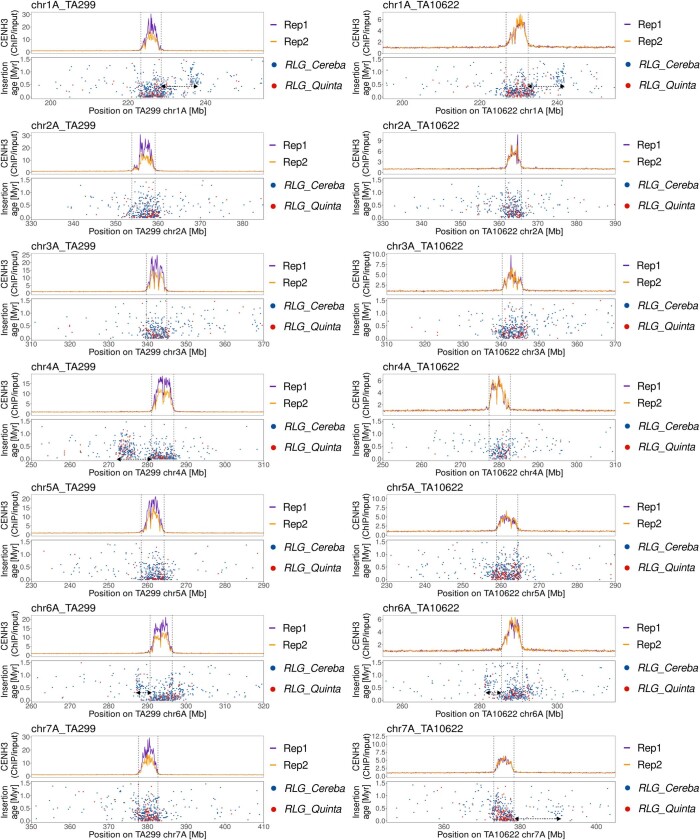
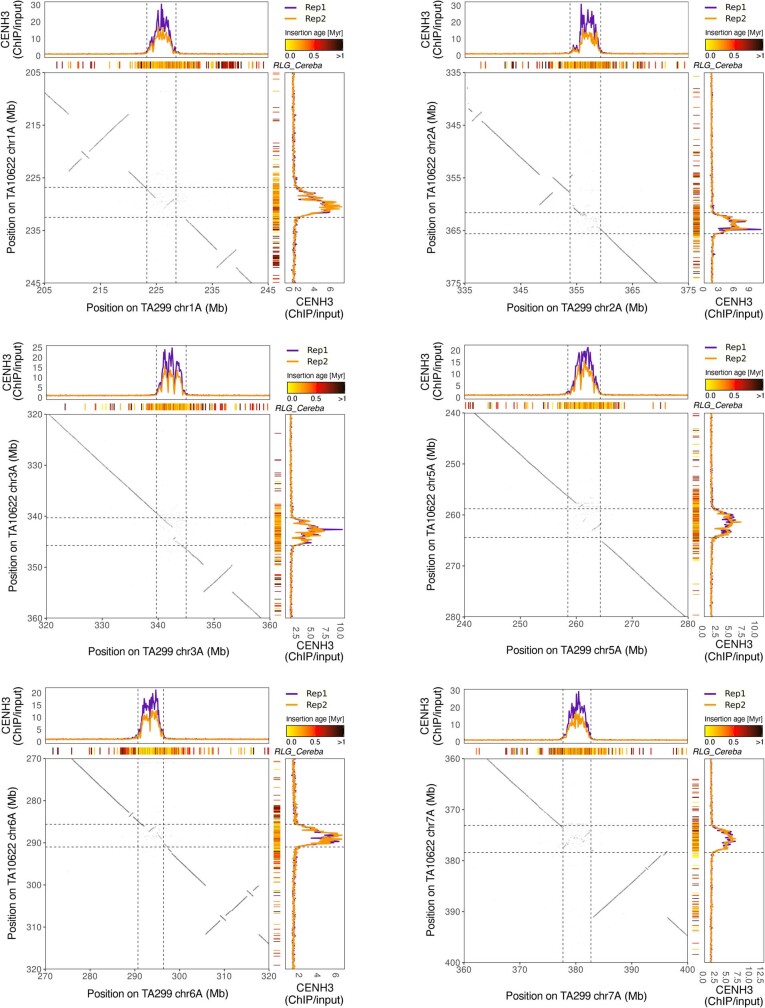
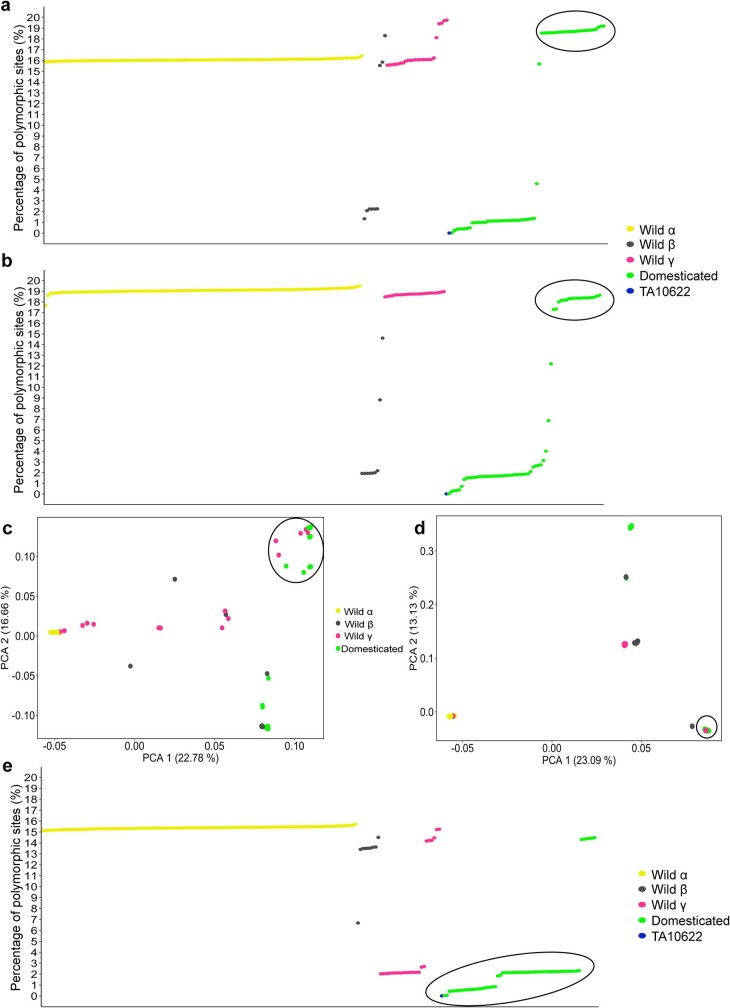
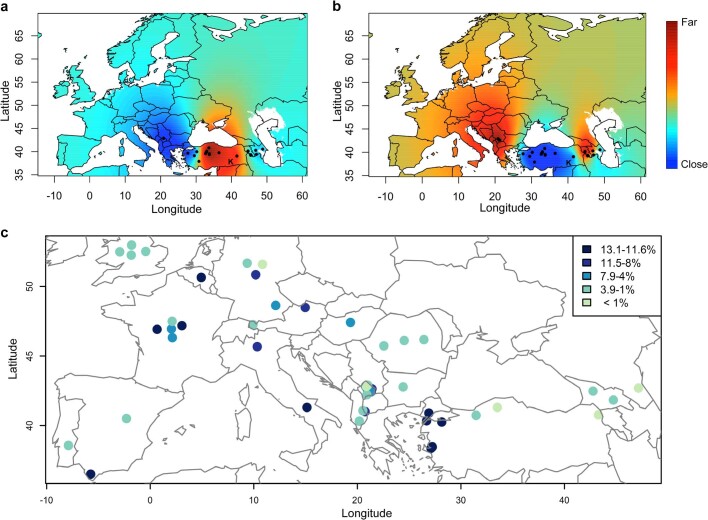
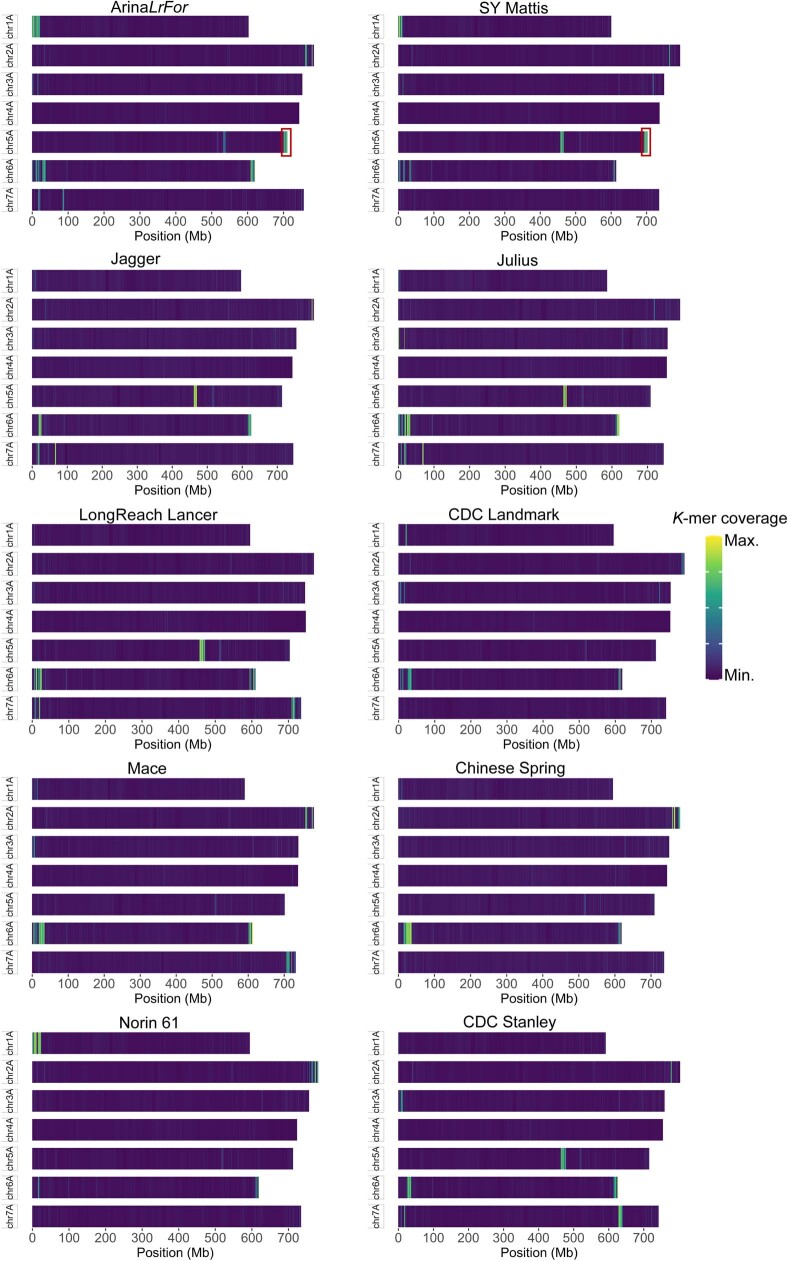
Einkorn (Triticum monococcum) was the first domesticated wheat species, and was central to the birth of agriculture and the Neolithic Revolution in the Fertile Crescent around 10,000 years ago1,2. Here we generate and analyse 5.2-Gb genome assemblies for wild and domesticated einkorn, including completely assembled centromeres. Einkorn centromeres are highly dynamic, showing evidence of ancient and recent centromere shifts caused by structural rearrangements. Whole-genome sequencing analysis of a diversity panel uncovered the population structure and evolutionary history of einkorn, revealing complex patterns of hybridizations and introgressions after the dispersal of domesticated einkorn from the Fertile Crescent. We also show that around 1% of the modern bread wheat (Triticum aestivum) A subgenome originates from einkorn. These resources and findings highlight the history of einkorn evolution and provide a basis to accelerate the genomics-assisted improvement of einkorn and bread wheat.


Conflict of interest statement

The authors declare no competing interests.

Figures

Fig. 1
Fig. 1. Einkorn genome structure and functional features.
Circos plot showing synteny between the assemblies of wild einkorn (TA299) and domesticated einkorn (TA10622). The tracks depict structural and functional features of the two einkorn reference assemblies. The number and length of pseudomolecules (i), gene density along pseudomolecules (ii), repeat density along pseudomolecules (iii) and CENH3 ChIP–seq read coverage along pseudomolecules (iv) are shown. Peaks in each pseudomolecule define the centromeres (iv). The lines in the inner circle represent 17,586 orthologous high-confidence genes between TA299 and TA10622. Only relationships between the same chromosomes are shown.
Fig. 2
Fig. 2. Dynamics of einkorn centromeres.
a, The composition of the TA299 chromosome 3A centromere. The top track shows CENH3 ChIP–seq coverage. The vertical lines underneath the track indicate genes. The bottom track shows TE composition. The x axis indicates chromosomal positions in megabases. The functional centromere is highlighted (blue shading). b, Dot plot alignment of chromosome 4A centromeric regions of TA299 (horizontal) and TA10622 (vertical). CENH3 ChIP–seq coverage and positions of RLG_Cereba insertions are aligned with the dot plot. RLG_Cereba insertion age is colour-coded in million of years (Myr). Rearranged chromosomal segments are shown in colours that correspond to those in c. The small rectangle indicates an approximately 400 kb region that is shown in detail in d. c, Evolutionary model explaining the organization of chromosome 4A centromeres in TA10622 and TA299. A–E indicate segments that experienced inversions compared with the ancestral centromere. X–Z represent segments that were deleted in one of the two accessions. d, Comparison of the shifted TA299 chromosome 4A centromere with its counterpart in TA10622. Conserved sequences are connected by the shaded grey areas. New TE insertions are shown partially raised. All new TE insertions are of the RLG_Cereba and RLG_Quinta families. e, Evidence of an additional inversion of around 10 Mb in chromosome 1A that moved part of the functional centromere (indicated by the two-headed arrow). Top, CENH3 ChIP–seq coverage. Bottom, the chromosomal positions of RLG_Cereba and RLG_Quinta retrotransposons (x axis) and their insertion age (y axis). The distribution and insertion ages of retrotransposons indicate that the inversion occurred around 500,000 years ago (grey dashed line) in a common ancestor of TA10622 and TA299. f,g, Examples of how inversions can cause centromere shifts. h, Example of how a centromere remains at or near to its original location after a segment is moved by an inversion.
Fig. 3
Fig. 3. Einkorn population genomics.
a, Unrooted neighbour-joining tree. b, Population structure (from K = 3 to K = 6). Each vertical bar represents one accession, and the bars are filled with colours representing the proportion of each ancestry. Einkorn groups were assigned considering K = 6 (on the basis of the cross-entropy value) based on the maximal local contribution of ancestry except for β (all β accessions were assigned as one group, regardless of the contribution of an ancestry). α group 1 (α-g1, n = 37) is shown in purple, α group 2 (α-g2, n = 87) is shown in yellow, γ (n = 24), β (n = 9), domesticated einkorn group 1 (dom-g1, n = 44) is shown in green and domesticated einkorn group 2 (dom-g2, n = 17) is shown in blue. A detailed list of accessions is provided in Supplementary Table 9. c, The mean fixation index (FST) between the two domesticated einkorn groups calculated in 1 Mb sliding windows. Only accessions with 80% ancestry threshold at K = 4 were considered. Centromere midpoints are indicated by red arrowheads. d, PCA using only variants that are present on the introgressed segment on chromosome 5A. Accessions were coloured according to the structure analysis in b. Circled accessions include wild γ accessions and some domesticated einkorn accessions. e, The geographical location of einkorn collection sites. The colours in pie charts correspond to the ancestry at K = 6. The Fertile Crescent is indicated by black lines. Only accessions with known collection sites are shown. f, Geographical projection of the first PCA axis for γ accessions on the basis of the introgressed segment on chromosome 2A (this analysis was performed excluding α and β accessions). The black dots represent the location of γ accessions. Blue colour represents the collection sites of γ accessions that were genetically the least diverged from the γ introgression found in domesticated einkorn. The Karacadağ region (K) is indicated on the map.
Fig. 4
Fig. 4. Einkorn introgression into bread wheat.
a, Einkorn introgressions (highlighted in orange) into ArinaLrFor identified using the k-mer variation approach (IBSpy; Supplementary Note 2). The red square on chromosome arm 1AS corresponds to the region shown in detail in b. b, IBSpy variations between ArinaLrFor (chromosome 1A, position 0–25 Mb) and einkorn. Regions with variation scores of ≤30 (identical by state) are indicated in orange, corresponding to einkorn introgressions. Einkorn_min represents a consensus that shows the lowest variation scores across all resequenced einkorn accessions. The remaining plots illustrate the variation scores between ArinaLrFor and eight selected einkorn accessions. Accession names highlighted in green and grey belong to domesticated groups 1 (dom-g1) and β, respectively. c, The number of introgression segments that could be assigned to a particular einkorn group.
Fig. 5
Fig. 5. Positional cloning of tin3 and translational research in hexaploid bread wheat.
a, Phenotypes of wild-type T. monococcum accession TA4342-L96 (top left) and tin3 (top right) at the tillering stage. Bottom left, scanning electron microscopy (SEM) images of seedlings showing primary shoot bud and axillary tiller bud formation (indicated by asterisks) in TA4342-L96 after leaf removal at the eight-leaf stage. Bottom right, SEM image of a seedling showing only the primary bud (indicated by an asterisk) at the shoot apex with no axillary buds in the tin3 mutant after leaf removal at the six-leaf stage. The SEM experiment was repeated three times. b, The SNP index in a mutant tin3 bulk (n = 30 F2 plants) across einkorn chromosome 3A. The TA10622 reference assembly was used for read mapping. c, The tin3 target interval in TA10622. Xpsr1205 and Xwmc169 indicate the positions of previously identified tin3-flanking markers. The triangles indicate the positions of EMS-induced point mutations. d, Tin3 (Tm.TA10622.r1.3AG0164370) gene structure. The boxes represent exons and the line represents the intron. The G to A point mutation in tin3 is indicated by a red arrow. The locations of SNPs found within the Jagger TILLING population for all three homeologous tin3 copies is indicated in black. T.m., T. monococcum. e, Tiller numbers in bread wheat cultivar Jagger (n = 20), tin3A (n = 12), tin3B (n = 6), tin3D (n = 14), tin3AB (n = 7), tin3AD (n = 8), tin3BD (n = 12) and tin3ABD (n = 8). All eight tin3ABD triple mutants developed exactly three tillers. The box boundaries indicate the first and third quartiles. The lines extending from the boxes (whiskers) indicate the variability outside the lower and upper quartiles. The lines in the middle of the boxes represent the median values of π. Outliers are plotted as individual points. P values were calculated using two-sided Tukey’s honest significant difference tests, comparing with Jagger. f, Representative images showing the tillering phenotypes of Jagger (left) and tin3 triple mutants (right).
Extended Data Fig. 1
Extended Data Fig. 1. Characterization of a large tandem duplication in einkorn.
a, Sequence around the middle breakpoint of the two tandemly duplicated segments on chromosome 4A of TA10622. The 1 Mb duplication was confirmed by designing a PCR marker across the breakpoint. Primer sequences are underlined and indicated in bold. The nucleotides at the breakpoint are highlighted in orange (located in the RLG_Laura element) and in blue (located in the RLG_Erika element). b, Dot plot showing a comparison of a 2.3 Mb region of chromosome 4A of TA10622 against itself. The two red lines indicate the megabase-sized tandem duplication. The positions of the MADS-box transcription factor genes are indicated by black arrows. A schematic representation of the retroelements is shown at the bottom. Arrows indicate long terminal repeats (LTRs). c, Sequence identity across the two duplicated segments, calculated in 5 kb non-overlapping windows. d, Schematic diagram showing the proposed unequal recombination between two retrotransposons that led to the tandem duplication. e, The presence - absence of the tandem duplication on chromosome 4A was estimated by normalized read coverage across the MADS1 gene (including 2 kb of flanking sequence). Outliers: α: TA316, β: TA10573 and TA10910, domesticated einkorn: TA10548 and TA10577.
Extended Data Fig. 2
Extended Data Fig. 2. Evolutionary origin of large-scale duplications and inversions in the centromere of TA299 chromosome 2A.
a, Dot plot alignment of a segment inside the centromere of chromosome 2A. A large duplication is labelled with “b” and a duplication/inversion with “c”. b, Evolutionary model for the duplication event b. We propose that the large duplication originated from unequal recombination between two RLG_Cereba retrotransposons that were ~700 kb apart, resulting in the duplication of the entire sequence between them. The RLG_Cereba elements that served as templates for the unequal recombination are shown in red and green. The 5 bp target site duplications (TSD) produced by their insertions were used as diagnostic sequences to identify the recombinant element in the centre of the two duplicated units. Parts of the duplication that were deleted in later events are shown in grey (this includes one of the RLG_Cereba copies that served as a template for the initial event). c, The second duplication/inversion “c” occurred following the same mechanisms. The duplication was followed by a second independent event resulting in an inversion that affected nearly the same region. The inversion was caused by recombination between different RLG_Cereba elements near the original duplication breakpoints but in the opposite orientation. Subsequently, deletions near the borders of the inverted segment removed some of the diagnostic motifs (indicated in grey). We emphasize that the presented model is based exclusively on homology-based recombination between different RLG_Cereba retrotransposons and that it is possible that events resulting in a duplication plus an inversion may also involve alternative mechanisms.
Extended Data Fig. 3
Extended Data Fig. 3. Definition of functional centromeres (shaded in blue) in T. monococcum accessions TA299 (left column) and TA10622 (right column) from CENH3 ChIP-Seq data.
Centromeric regions plus ~15 Mb of flanking regions are shown. The top graph of each panel shows the ratio of CENH3 ChIP-Seq reads divided by input control reads. ChIP-Seq and control reactions were performed in duplicates, which are shown in purple (Rep1) and orange (Rep2). The region of functional centromeres was determined based on epic2 ChIP-Seq peak call density and is indicated by a shaded area. The middle track below shows the positions of genes as vertical lines. The bottom graph shows the average transposable element (TE) content in 100 kb windows. Note that RLG_Cereba and RLG_Quinta retrotransposons are highly enriched in functional centromeres, while other TE families dominate outside of centromeres.
Extended Data Fig. 4
Extended Data Fig. 4. Comparison of RLG_Cereba insertion ages with physical distance from centromeres.
Note that ~95% of RLG_Cereba elements younger than 1 million years are found inside functional centromeres.
Extended Data Fig. 5
Extended Data Fig. 5. CENH3 ChIP-Seq read coverage in relation to insertion ages of centromere-specific retrotransposons in T. monococcum accessions TA299 (left column) and TA10622 (right column).
The top panels show the ratio of CENH3 ChIP-Seq reads divided by input control reads. ChIP-Seq and control reactions were performed in duplicates, which are shown in purple (Rep1) and orange (Rep2). The bottom panels show the chromosomal positions of RLG_Cereba (blue) and RLG_Quinta (red) retrotransposons (x-axis) and their insertion age (y-axis). The youngest retrotransposon insertions are generally found in the functional centromeres. Retrotransposon insertions on chromosomes 1A, 4A, 6A and 7A indicate that parts of the functional centromeres were moved at different evolutionary time points. The observed patterns can be explained by large-scale inversions that moved parts of centromeres (indicated by two-headed arrows, with y positions indicating the approximate time of the inversion event).
Extended Data Fig. 6
Extended Data Fig. 6. Dot plot comparisons of centromeric and peri-centromeric regions of T. monococcum accessions TA299 (horizontal) and TA10622 (vertical).
Aligned with the dot plots are plots of the average coverage of CENH3 ChIP-Seq reads and positions of RLG_Cereba retrotransposon insertions colour-coded according to their insertion ages. The plot for chromosome 4A is shown in the main Fig. 2.
Extended Data Fig. 7
Extended Data Fig. 7. Population genomic analyses on diverged genomic regions.
(a-b), The percentage of polymorphic sites of each einkorn accession compared to the TA10622 assembly considering SNPs present only in the two highly diverged genomic segments on chromosomes 2A (a) and 5A (b). The circles highlight domesticated einkorn accession that diverged from the TA10622 reference assembly. (cd), Principal component analyses (PCA) based on SNPs found only in the two large introgressed segments on chromosomes 2A (c) and chromosome 7A (d) revealed that γ accessions cluster with some domesticated einkorn accessions. The circles highlight domesticated einkorn accessions that cluster with wild γ accessions instead of β. e, The percentage of polymorphic sites compared to the TA10622 assembly of the introgressed region on chromosome 7A showed that the majority of the domesticated einkorn accessions (highlighted in the circle) are not diverged from TA10622, which also carries the introgression on chromosome 7A.
Extended Data Fig. 8
Extended Data Fig. 8. Wild einkorn γ race introgression into domesticated einkorn.
a, Geographical projection of the second PCA axis based on variants found only in the large introgressed segment on chromosomes 5A. b, Geographical projection of the first PCA axis based on variants found only in the large introgressed segment on chromosomes 7A. Blue colour indicates γ accessions with close genetic relatedness to the introgressed segments found in domesticated einkorn accessions. Black dots represent the coordinates of γ accessions. The analysis was done excluding α and β accessions. Maps in both a and b were created using the Kriging function in the fields v10.3 R package (https://cran.r-project.org/web/packages/fields). c, The proportion of γ race introgression in domesticated einkorn. Each dot represents the coordinates of a domesticated einkorn accessions. Dark blue and light green represent the highest and the lowest proportions of γ introgressions in domesticated einkorn, respectively (legend at top right). The map was created using the graphic plot function in R.
Extended Data Fig. 9
Extended Data Fig. 9. Einkorn introgression into 10 chromosome-scale bread wheat assemblies based on k-mer mapping approach.
Putative introgressions are identified as regions with increased coverage of mapped k-mers from T. monococcum and visualized in the blue–yellow heat map (legend at the right). Red squares around chromosome 5AL in both ArinaLrFor and SY Mattis indicate the Yr34-carrying region that was used as control. Source data

References

    1. Levy AA, Feldman M. Evolution and origin of bread wheat. Plant Cell. 2022;34:2549–2567. doi: 10.1093/plcell/koac130. - DOI - PMC - PubMed
    1. Salamini F, Ozkan H, Brandolini A, Schafer-Pregl R, Martin W. Genetics and geography of wild cereal domestication in the Near East. Nat. Rev. Genet. 2002;3:429–441. doi: 10.1038/nrg817. - DOI - PubMed
    1. Arranz-Otaegui A, Gonzalez Carretero L, Ramsey MN, Fuller DQ, Richter T. Archaeobotanical evidence reveals the origins of bread 14,400 years ago in northeastern Jordan. Proc. Natl Acad. Sci. USA. 2018;115:7925–7930. doi: 10.1073/pnas.1801071115. - DOI - PMC - PubMed
    1. Pourkheirandish M, et al. On the origin of the non-brittle rachis trait of domesticated einkorn wheat. Front. Plant Sci. 2018;8:2031. doi: 10.3389/fpls.2017.02031. - DOI - PMC - PubMed
    1. Marcussen T, et al. Ancient hybridizations among the ancestral genomes of bread wheat. Science. 2014;345:1250092. doi: 10.1126/science.1250092. - DOI - PubMed

Publication types