. 2023 Aug;620(7975):898-903.
doi: 10.1038/s41586-023-06405-w. Epub 2023 Aug 2.

TDP-43 forms amyloid filaments with a distinct fold in type A FTLD-TDP

Affiliations

TDP-43 forms amyloid filaments with a distinct fold in type A FTLD-TDP

Diana Arseni et al. Nature. 2023 Aug.

Abstract

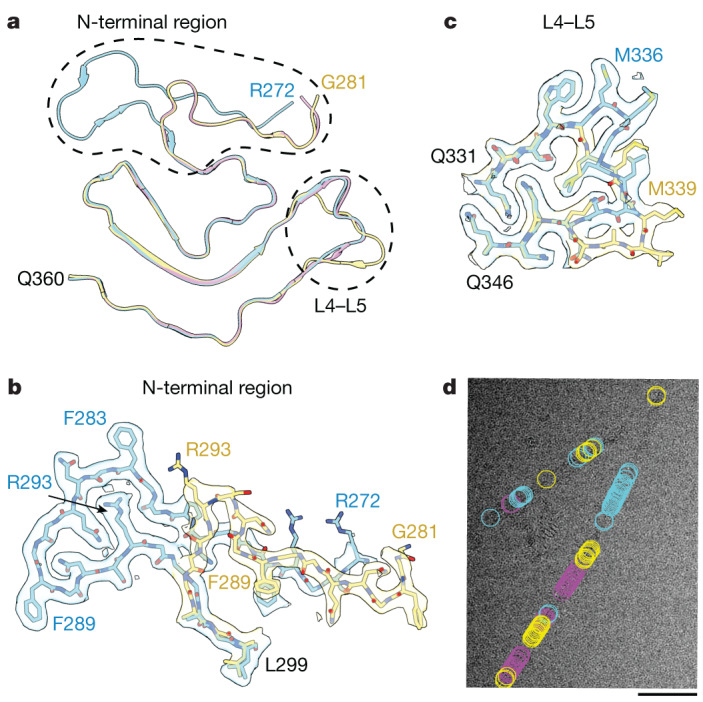
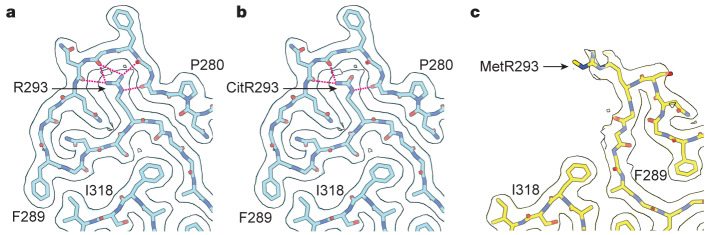
The abnormal assembly of TAR DNA-binding protein 43 (TDP-43) in neuronal and glial cells characterizes nearly all cases of amyotrophic lateral sclerosis (ALS) and around half of cases of frontotemporal lobar degeneration (FTLD)1,2. A causal role for TDP-43 assembly in neurodegeneration is evidenced by dominantly inherited missense mutations in TARDBP, the gene encoding TDP-43, that promote assembly and give rise to ALS and FTLD3-7. At least four types (A-D) of FTLD with TDP-43 pathology (FTLD-TDP) are defined by distinct brain distributions of assembled TDP-43 and are associated with different clinical presentations of frontotemporal dementia8. We previously showed, using cryo-electron microscopy, that TDP-43 assembles into amyloid filaments in ALS and type B FTLD-TDP9. However, the structures of assembled TDP-43 in FTLD without ALS remained unknown. Here we report the cryo-electron microscopy structures of assembled TDP-43 from the brains of three individuals with the most common type of FTLD-TDP, type A. TDP-43 formed amyloid filaments with a new fold that was the same across individuals, indicating that this fold may characterize type A FTLD-TDP. The fold resembles a chevron badge and is unlike the double-spiral-shaped fold of ALS and type B FTLD-TDP, establishing that distinct filament folds of TDP-43 characterize different neurodegenerative conditions. The structures, in combination with mass spectrometry, led to the identification of two new post-translational modifications of assembled TDP-43, citrullination and monomethylation of R293, and indicate that they may facilitate filament formation and observed structural variation in individual filaments. The structures of TDP-43 filaments from type A FTLD-TDP will guide mechanistic studies of TDP-43 assembly, as well as the development of diagnostic and therapeutic compounds for TDP-43 proteinopathies.


Conflict of interest statement

The authors declare no competing interests.

Figures

Fig. 1
Fig. 1. Cryo-EM structures of TDP-43 amyloid filaments from individuals with type A FTLD-TDP.
a, Cryo-EM maps of TDP-43 filaments from the prefrontal cortex of three individuals with type A FTLD-TDP, shown as central slices perpendicular to the helical axis. GRN indicates individuals with mutations in GRN associated with type A FTLD-TDP. Scale bars, 25 Å. b, Schematic of the domain organization of TDP-43. Disease-associated phosphorylation sites are shown. The black line indicates the region that forms the ordered filament fold. NLS, nuclear localization signal. c, Amino acid sequence alignment of the secondary structure elements of the filament fold. Arrows indicate β-strands. d, Cryo-EM map shown at high (grey) and low (yellow) contour levels and atomic model, shown for a single TDP-43 molecule perpendicular to the helical axis. The five layers of the filament fold are labelled. Less well-resolved protein-like density extending from R272 (black arrow), an isolated peptide-like density adjacent to G351–N355 (yellow arrow), and non-protein densities within cavities between layers 1 to 3 (red arrows) are indicated. In c and d, the glycine-rich (G274–G310, magenta), hydrophobic (M311–S342, white) and Q/N-rich (Q343–Q360, green) regions are highlighted.
Fig. 2
Fig. 2. Alternative local conformations of TDP-43 amyloid filaments from type A FTLD-TDP.
a, Overlay of atomic models of TDP-43 filaments from type A FTLD-TDP with different local conformations of the N-terminal region and of the turn connecting the fourth layer to the fifth (L4–L5). b,c, Cryo-EM maps and atomic models with different local conformations of the the N-terminal region (b) and of the turn connecting the fourth layer to the fifth (L4–L5) (c), shown for a single TDP-43 molecule perpendicular to the helical axis. d, Example micrograph showing the positions of filament segments contributing to cryo-EM maps with different local conformations, which occur in individual filaments. Scale bar, 50 nm. Further examples are shown in Extended Data Fig. 6. In ad, the main conformation is shown in cyan, the alternative local conformation of the N-terminal region in magenta, and the alternative local conformation of the N-terminal region and the turn connecting the fourth layer to the fifth in yellow.
Fig. 3
Fig. 3. Post-translational modifications of R293 in TDP-43 amyloid filaments from type A FTLD-TDP.
ac, Cryo-EM maps and atomic models of TDP-43 filaments from type A FTLD-TDP around R293 with the main conformation of the N-termnial region and unmodified R293 (a), the main conformation of the N-terminal region and citrullinated R293 (CitR293) (b), and the alternative conformation of the N-terminal region and monomethylated R293 (MetR293) (c). The maps and models are shown for a single TDP-43 molecule perpendicular to the helical axis. Hydrogen bonds to the side chains of unmodified and modified R293 are shown as dashed magenta lines.
Fig. 4
Fig. 4. Comparison of the TDP-43 amyloid filament folds of type A FTLD-TDP and of ALS and type B FTLD-TDP.
a, Amino acid sequence alignment of the secondary structure elements of the TDP-43 filament folds of type A FTLD-TDP and of ALS and type B FTLD-TDP (PDB 7PY2). The N-terminal truncation site at P280 is indicated by a scissor symbol. R293 is indicated by a blue dot. b, Schematic of the secondary structure elements of the filament folds, shown for a single TDP-43 molecule perpendicular to the helical axis. Alternative local conformations of the type A FTLD-TDP filament fold are transparent, and R293 is highlighted. In a and b, arrows indicate β-strands. The glycine-rich (G274–G310, magenta), hydrophobic (M311–S342, white) and Q/N-rich (Q343–Q360, green) regions are highlighted.
Extended Data Fig. 1
Extended Data Fig. 1. TDP-43 pathology of type A FTLD-TDP.
a,b, Immunohistochemistry for TDP-43 (brown) in the prefrontal cortex of individuals 1–5 with antibodies against TDP-43 N-terminus (a) and TDP-43 phosphorylated at S409 and S410 (b). Sections were counterstained with hematoxylin (blue). Scale bars, 25 μm. c, Immunoblots of the sarkosyl-soluble and sarkosyl-insoluble fractions from the prefrontal cortex of individuals 1–3 and a control case without TDP-43 pathology (C) with an antibody against TDP-43 phosphorylated at S409 and S410. For gel source data, see Supplementary Fig. 1. d, Cryo-EM images of TDP-43 filaments from the prefrontal cortex of individuals 1–3. Scale bar, 50 nm. e, Immuno-gold negative-stain EM images of TDP-43 filaments from the prefrontal cortex of individuals 1 and 2 with an antibody against TDP-43 phosphorylated at S409 and S410. Scale bars, 100 nm. For a–e, similar results were obtained in at least three independent experiments.
Extended Data Fig. 2
Extended Data Fig. 2. Cryo-EM density map and atomic model.
a, Fourier shell correlation (FSC) curves for the two independently-refined cryo-EM half-maps of TDP-43 filaments from Type A FTLD-TDP (black line); for the refined atomic model against the cryo-EM density map (magenta); for the atomic model shaken and refined using the first half-map against the first half-map (cyan); and for the same atomic model against the second half-map (yellow). FSC thresholds of 0.143 (black dashed line) and 0.5 (magenta dashed line) are shown. b, Local resolution estimate for the cryo-EM density map. c, Cryo-EM density map viewed along the helical axis. Scale bar, 10 Å. d,e, Views of the cryo-EM density map and atomic model showing representative densities for ordered solvent (red arrows) (d) and main chain oxygen atoms in β-strands, which reveal the chirality of the map (e).
Extended Data Fig. 3
Extended Data Fig. 3. TMEM106B filaments from type A FTLD-TDP.
a, Cryo-EM images of TMEM106B filaments from the prefrontal cortex of individuals 1–3. Arrows indicate examples of single (cyan) and double (magenta) TMEM106B filaments. Scale bars, 100 nm. Similar results were obtained in at least three independent experiments. b, Mass spectrometry TMEM106B peptide coverage from the prefrontal cortex of individuals 1-3. The peptides map to the region that forms the ordered core of TMEM106B filaments, with the exception of one peptide from individual 2, which maps to the transmembrane helix (TM) of TMEM106B. The counts are given for each peptide. Peptide sequences are shown in Supplementary Data Table 1.
Extended Data Fig. 4
Extended Data Fig. 4. The TDP-43 filament fold of type A FTLD-TDP.
a, Schematic representation of the type A FTLD-TDP fold. b, Cryo-EM map and atomic model, shown for the Q/N-rich region of five TDP-43 molecules in line with the helical axis. c–e, Secondary structure of the type A FTLD-TDP fold, shown for a single TDP-43 molecule perpendicular to the helical axis with the five layers highlighted in different colours (c); shown for five TDP-43 molecules in line with the helical axis (d); and shown for a single TDP-43 molecule perpendicular to the helical axis with regions of zipper packing highlighted in orange (e). f, Atomic model of the fold depicting intramolecular hydrogen bonds (cyan dashed lines), shown for three TDP-43 molecules perpendicular to the helical axis. g, Hydrophobicity of the fold from most hydrophilic (cyan) to most hydrophobic (yellow), shown for a single TDP-43 molecule perpendicular to the helical axis. The red asterisk indicates the hydrophobic cluster formed at the interface of the second and third layers. h, View of the atomic model and non-proteinaceous densities, shown for five TDP-43 molecules in line with the helical axis. i, Surface representation of the fold, shown for a single TDP-43 molecule perpendicular to the helical axis. For b,d,f, the glycine-rich (G274–G310, magenta), hydrophobic (M311–S342, white) and Q/N-rich (Q343–Q360, green) regions are highlighted.
Extended Data Fig. 5
Extended Data Fig. 5. Alternative local conformations of the type A FTLD-TDP filament fold.
a, Cryo-EM maps of TDP-43 filaments from type A FTLD-TDP with different local conformations of the N-terminal region (cyan arrows) and of the turn connecting the fourth layer to the fifth (yellow arrows), shown as central slices perpendicular to the helical axis. Scale bars, 25 Å. b, Fourier shell correlation (FSC) curves for the two independently-refined cryo-EM half-maps (black lines); for the refined atomic model against the cryo-EM density map (magenta); for the atomic model shaken and refined using the first half-map against the first half-map (cyan); and for the same atomic model against the second half-map (yellow) . FSC thresholds of 0.143 (black dashed line) and 0.5 (magenta dashed line) are shown. c, Local resolution estimates for the cryo-EM density maps. d, Cryo-EM density maps viewed along the helical axis. Scale bar, 10 Å. e, Cryo-EM density maps and atomic models, shown for a single TDP-43 molecule perpendicular to the helical axis.
Extended Data Fig. 6
Extended Data Fig. 6. Structural variation within individual TDP-43 filaments from type A FTLD-TDP.
Example micrographs of TDP-43 filaments from type A FTLD-TDP individual 1 showing the positions of filament segments contributing to cryo-EM maps with different local conformations, which can occur within individual filaments. Filament segments with the main local conformations are shown in cyan; with the alternative local conformation of the N-terminal region in magenta; and with the alternative local conformation of the N-terminal region and the turn connecting the fourth layer to the fifth in yellow. Scale bar, 100 nm.
Extended Data Fig. 7
Extended Data Fig. 7. Citrullination of R293 in TDP-43 filaments from type A FTLD-TDP.
Mass spectra of TDP-43 peptides containing citrullinated R293 from TDP-43 filaments isolated from the prefrontal cortex of individuals 1–5.
Extended Data Fig. 8
Extended Data Fig. 8. Mono-methylation of R293 in TDP-43 filaments from type A FTLD-TDP.
Mass spectra of TDP-43 peptides containing mono-methylated R293 from TDP-43 filaments isolated from the prefrontal cortex of individuals 1 and 2. Such peptides were not detected for individuals 3–5, possibly because fewer total peptides containing R293 of TDP-43 were detected for these individuals compared to individuals 1 and 2.

Comment in

References

    1. Neumann M, et al. Ubiquitinated TDP-43 in frontotemporal lobar degeneration and amyotrophic lateral sclerosis. Science. 2006;314:130–133. doi: 10.1126/science.1134108. - DOI - PubMed
    1. Arai T, et al. TDP-43 is a component of ubiquitin-positive tau-negative inclusions in frontotemporal lobar degeneration and amyotrophic lateral sclerosis. Biochem. Biophys. Res. Commun. 2006;351:602–611. doi: 10.1016/j.bbrc.2006.10.093. - DOI - PubMed
    1. Sreedharan J, et al. TDP-43 mutations in familial and sporadic amyotrophic lateral sclerosis. Science. 2008;319:1668–1672. doi: 10.1126/science.1154584. - DOI - PMC - PubMed
    1. Kabashi E, et al. TARDBP mutations in individuals with sporadic and familial amyotrophic lateral sclerosis. Nat. Genet. 2008;40:572–574. doi: 10.1038/ng.132. - DOI - PubMed
    1. Van Deerlin VM, et al. TARDBP mutations in amyotrophic lateral sclerosis with TDP-43 neuropathology: a genetic and histopathological analysis. Lancet Neurol. 2008;7:409–416. doi: 10.1016/S1474-4422(08)70071-1. - DOI - PMC - PubMed

Publication types

MeSH terms