Case Reports
. 2024 Feb 1;19(2):266-275.
doi: 10.2215/CJN.0000000000000276. Epub 2023 Aug 3.

Molecular Signatures of Glomerular Neovascularization in a Patient with Diabetic Kidney Disease

Collaborators, Affiliations
Case Reports

Molecular Signatures of Glomerular Neovascularization in a Patient with Diabetic Kidney Disease

Michael J Ferkowicz et al. Clin J Am Soc Nephrol. .

Abstract

The Kidney Precision Medicine Project (KPMP) aims to create a kidney tissue atlas, define disease subgroups, and identify critical cells, pathways, and targets for novel therapies through molecular investigation of human kidney biopsies obtained from participants with AKI or CKD. We present the case of a 66-year-old woman with diabetic kidney disease who underwent a protocol KPMP kidney biopsy. Her clinical history included diabetes mellitus complicated by neuropathy and eye disease, increased insulin resistance, hypertension, albuminuria, and relatively preserved glomerular filtration rate (early CKD stage 3a). The patient's histopathology was consistent with diabetic nephropathy and arterial and arteriolar sclerosis. Three-dimensional, immunofluorescence imaging of the kidney biopsy specimen revealed extensive periglomerular neovascularization that was underestimated by standard histopathologic approaches. Spatial transcriptomics was performed to obtain gene expression signatures at discrete areas of the kidney biopsy. Gene expression in the areas of glomerular neovascularization revealed increased expression of genes involved in angiogenic signaling, proliferation, and survival of endothelial cells, as well as new vessel maturation and stability. This molecular correlation provides additional insights into the development of kidney disease in patients with diabetes and spotlights how novel molecular techniques used by the KPMP can supplement and enrich the histopathologic diagnosis obtained from a kidney biopsy.


Conflict of interest statement

D. Barwinska reports other interests or relationships with Kidney Precision Medicine Project. J.M. Henderson reports consultancy for Novartis and Pfizer and research funding from Pfizer, Q32 Bio, and Visterra. C.L. Phillips reports ownership interest in Alphabet, Berkshire Hathaway, and Disney. P.S. Silva reports consulting and speaker fees from Bayer, Novartis, and Roche and research funding from Kubota Vision, Optomed, and Optos. D.W. Steenkamp reports consultancy for Abbott Diabete Care and grant funding to institution from Abbott Diabetes Care, Novo Nordisk, and Tandem Diabetes Care. A. Verma reports advisory or leadership roles for Editorial Boards for BMC Medicine, BMC Nephrology, Therapeutic Advances in Chronic Disease, and Therapeutic Advances in Endocrinology and Metabolism. A. Verma is a contributor to BMJ Best Practices. S.S. Waikar reports consultancy for Bain, BioMarin, CANbridge, Goldfinch, Google, GSK, Ikena, Novo Nordisk, PepGen, Sironax, Strataca, and Wolters Kluewer; research funding from JNJ, Natera, Pfizer, and Vertex; and serving as an expert witness for litigation related to dialysis lab testing (DaVita), PPIs (Pfizer), PFAO exposure (Dechert), and voclosporin patent (Aurinia). S.S. Waikar's spouse reports employment with Advanced Clinical. All remaining authors have nothing to disclose.

Figures

Figure 1
Figure 1
Ophthalmic and clinical laboratory findings of the patient. (A–D) Ultrawide field retinal images of the right and left eye of the patient at the time of presentation. (A and B) Color composite images showing proliferative diabetic retinopathy with diabetic macular edema. Panretinal laser photocoagulation marks are seen throughout the mid and far peripheral retina. There are hemorrhages and microaneurysms less than standard 2A and intraretinal microvascular abnormalities less than standard 8A. (C and D) Fluorescein angiography images showing more extensive hemorrhages and microaneurysms than what is seen in color images. There is angiographic evidence of macular edema with leakage that involves the center of the macula. New vessels are seen in the superior temporal periphery of the right eye and superior periphery of the left eye. (E) The patient's longitudinal values for serum creatinine and albuminuria during her clinical course.
Figure 2
Figure 2
Pathologic changes and evidence of periglomerular capillary neovascularization in kidney biopsy. (A) Section of formalin-fixed, paraffin-embedded tissue showing typical pathologic changes observed throughout the kidney biopsy and corresponding to diabetic nephropathy, RPS class III, including glomeruli with severe mesangial expansion and early nodule formation, focal tubular atrophy and interstitial fibrosis (left arrow), severe arterial sclerosis (upper left), and arteriolar hyaline degeneration (right arrow). Arrowheads indicate clusters of capillary neovascularization in the connective tissue adjacent to the viable glomeruli (PAS; bar=100 μm). Inset shows glomerular segment with Kimmelstiel–Wilson nodule (arrow); areas of periglomerular neovascularization are also indicated by arrowheads (PAS; bar=50 μm). (B) High magnification of glomerulus showing areas of periglomerular neovascularization (arrowheads) adjacent to Bowman capsule and a possible capillary anastomosis crossing Bowman capsule through the glomerular hilum and potentially connecting the glomerular capillaries to the neovasculature (arrow); note that this apparent anastomosis is distinct from the adjacent arteriole (PAS; bar=50 μm). (C) Electron micrograph of glomerulus reveals ultrastructural features of diabetic nephropathy, including nodular mesangial expansion by matrix and cells in the absence of granular or organized electron-dense deposits (lower left third of image); segmental glomerular basement membrane thickening (arrows), early segmental double contour formation (arrowheads), endothelial swelling and loss of fenestrations (open arrows), segmental podocyte foot process effacement (open arrowheads), and other features of podocyte injury including microvillus change and cytoplasmic vacuolization (asterisks). Bar=20 μm. PAS, periodic acid–Schiff; RPS, Renal Pathology Society.
Figure 3
Figure 3
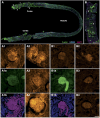
Immunofluorescence staining of the biopsy specimen from the patient reveals extensive coronal vasculature around glomeruli. (A) Fifty-micrometer thick section of the biopsy specimen from the patient, with cortex, medulla (demarcated by dashed lines), and four glomeruli of interest highlighted with square boxes. (B) Fifty-micrometer thick section of reference nephrectomy cortex tissue with four glomeruli marked with square outlines. Scale bar=1000 μm. (A1–A4) Higher magnification of the corresponding four glomeruli from (A), visualized with CD31/PECAM1 immunofluorescence. (A1a) Glomerulus from panel (A1), visualized using F-actin staining. (A1b) Connectivity of CD31-stained vasculature (magenta) of glomerulus (A1) visualized using Imaris. (B1–B4) Higher magnification of the corresponding four reference glomeruli identified in the nephrectomy (B) and stained for CD31/PECAM1. (B1a and B1b) F-actin and Imaris visualization. Scale bar=100 μm.
Figure 4
Figure 4
Spatial transcriptomics signature of periglomerular neovascularization. (A) Immunofluorescence image of the biopsy indicating the localization of a section used for spatial transcriptomics. (B) Spatial transcriptomics of the case and a reference biopsy. Using the KPMP single nucleus atlas, the 55-µm spots were deconvoluted in the underlying cell types (POD, EC, VSM/P, PT, TAL, Others). Scale bar—300 µm in both images. (C) Magnification of four selected glomeruli in the DKD and reference biopsies. The left column displays the tissue stained with H&E, and the right column displays the deconvoluted spots. Scale bar—300 µm in all panels. (D) Proportion of cell-type signature in glomerular spots in both samples. (E) Expression of neovascularization-associated genes in glomerular spots of both samples. (F) Spatial localization of expression of PECAM1 and MAPK1 on both biopsies. DKD, diabetic kidney disease; EC, endothelial cells; H&E, hematoxylin and eosin; KPMP, Kidney Precision Medicine Project; POD, podocytes; PT, proximal tubules; Ref, reference; TAL, thick ascending limb; VSM/P, vascular smooth muscles/pericytes.

References

    1. Tervaert TW Mooyaart AL Amann K, et al. . Pathologic classification of diabetic nephropathy. J Am Soc Nephrol. 2010;21(4):556–563. doi:10.1681/ASN.2010010010 - DOI - PubMed
    1. Ferkowicz MJ Winfree S Sabo AR, et al. . Large-scale, three-dimensional tissue cytometry of the human kidney: a complete and accessible pipeline. Lab Invest. 2021;101(5):661–676. doi:10.1038/s41374-020-00518-w - DOI - PMC - PubMed
    1. Melo Ferreira R Sabo AR Winfree S, et al. . Integration of spatial and single-cell transcriptomics localizes epithelial cell-immune cross-talk in kidney injury. JCI Insight. 2021;6(12):e147703. doi:10.1172/jci.insight.147703 - DOI - PMC - PubMed
    1. Lake BB Menon R Winfree S, et al. . An atlas of healthy and injured cell states and niches in the human kidney. Nature. 2023;619:585–594. doi:10.1038/s41586-023-05769-3 - DOI - PMC - PubMed
    1. Min W, Yamanaka N. Three-dimensional analysis of increased vasculature around the glomerular vascular pole in diabetic nephropathy. Virchows Arch A Pathol Anat Histopathol. 1993;423(3):201–207. doi:10.1007/bf01614771 - DOI - PubMed

Publication types