. 2023 Sep 5;122(17):3516-3531.
doi: 10.1016/j.bpj.2023.07.029. Epub 2023 Aug 2.

Eu3+ detects two functionally distinct luminal Ca2+ binding sites in ryanodine receptors

Affiliations

Eu3+ detects two functionally distinct luminal Ca2+ binding sites in ryanodine receptors

Zsuzsanna É Magyar et al. Biophys J. .

Abstract

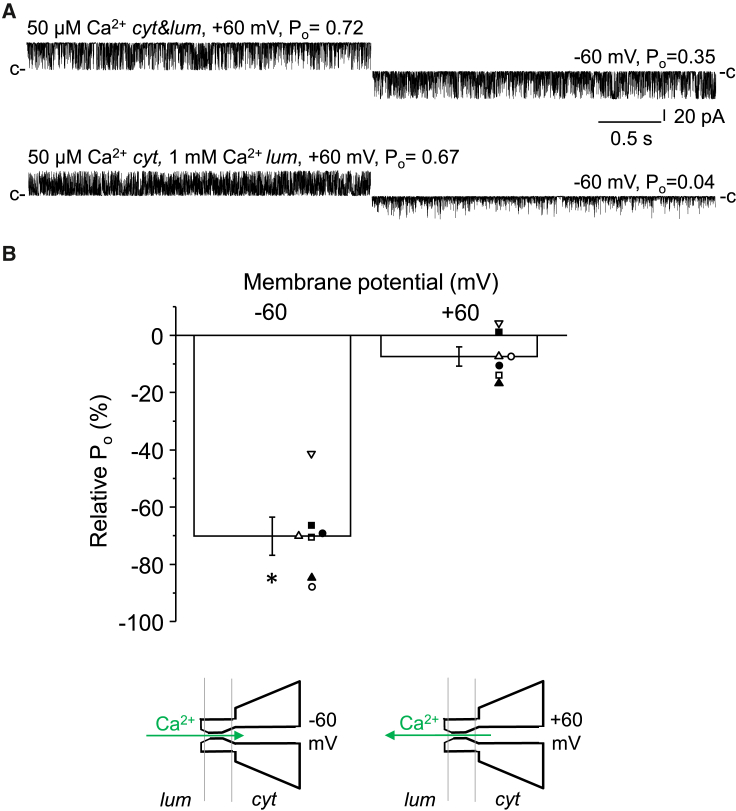
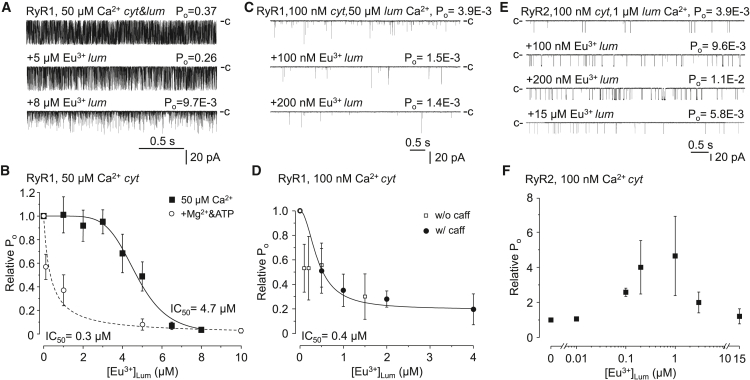
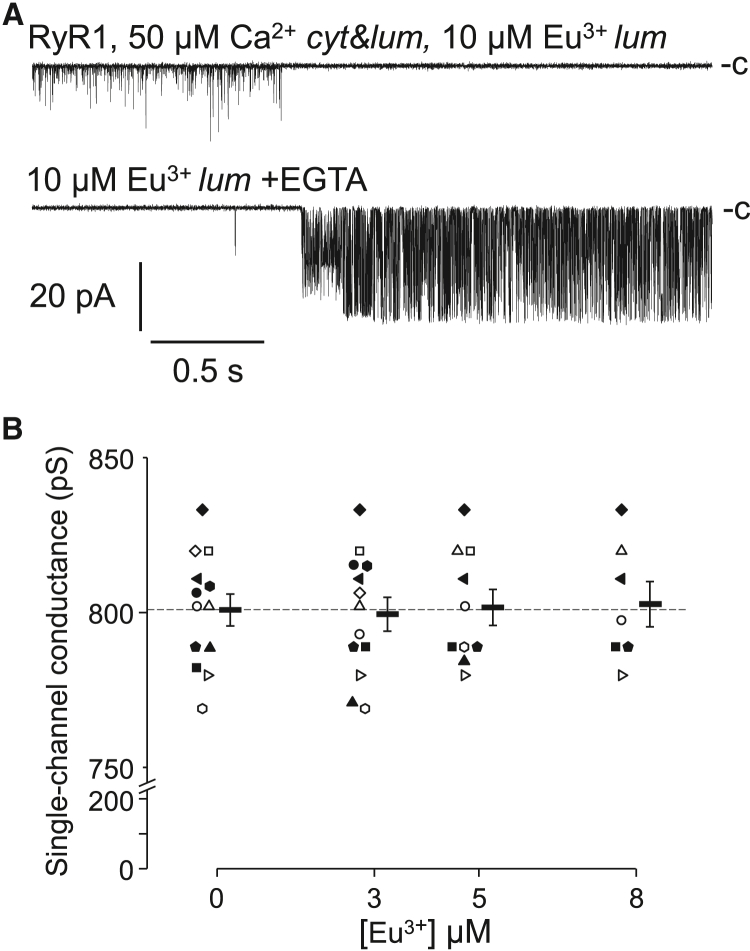
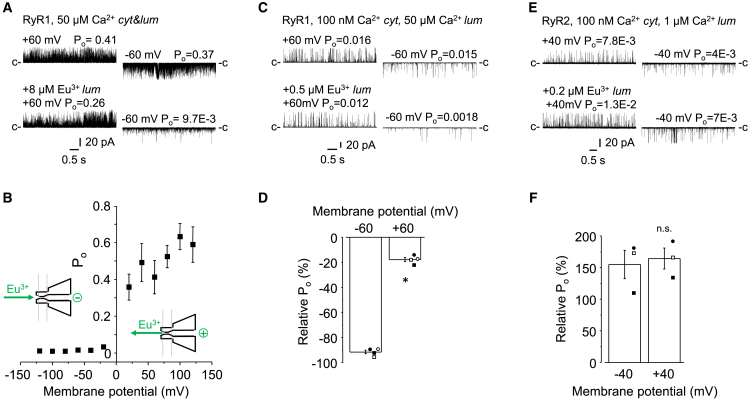
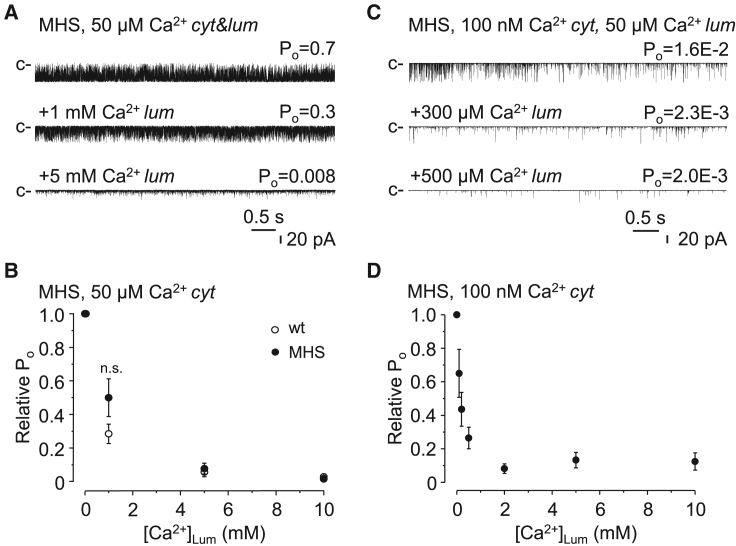
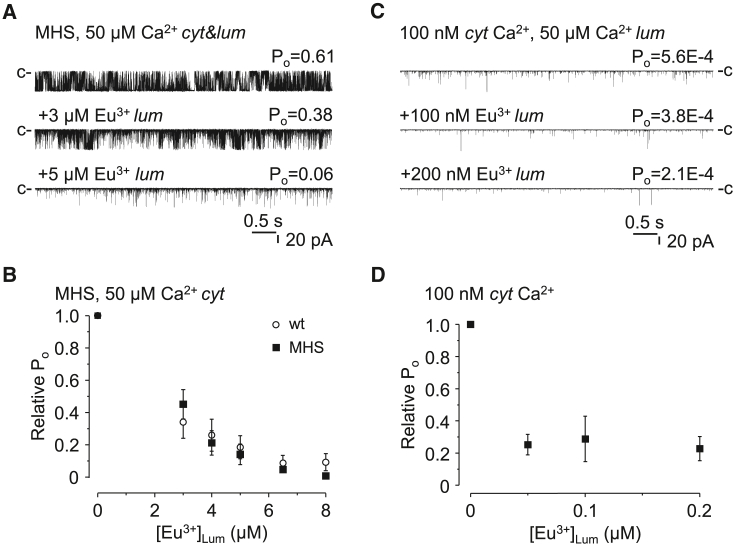
Ryanodine receptors (RyRs) are Ca2+ release channels, gated by Ca2+ in the cytosol and the sarcoplasmic reticulum lumen. Their regulation is impaired in certain cardiac and muscle diseases. Although a lot of data is available on the luminal Ca2+ regulation of RyR, its interpretation is complicated by the possibility that the divalent ions used to probe the luminal binding sites may contaminate the cytoplasmic sites by crossing the channel pore. In this study, we used Eu3+, an impermeable agonist of Ca2+ binding sites, as a probe to avoid this complication and to gain more specific information about the function of the luminal Ca2+ sensor. Single-channel currents were measured from skeletal muscle and cardiac RyRs (RyR1 and RyR2) using the lipid bilayer technique. We show that RyR2 is activated by the luminal addition of Ca2+, whereas RyR1 is inhibited. These results were qualitatively reproducible using Eu3+. The luminal regulation of RyR1 carrying a mutation associated with malignant hyperthermia was not different from that of the wild-type. RyR1 inhibition by Eu3+ was extremely voltage dependent, whereas RyR2 activation did not depend on the membrane potential. These results suggest that the RyR1 inhibition site is in the membrane's electric field (channel pore), whereas the RyR2 activation site is outside. Using in silico analysis and previous results, we predicted putative Ca2+ binding site sequences. We propose that RyR2 bears an activation site, which is missing in RyR1, but both isoforms share the same inhibitory Ca2+ binding site near the channel gate.


Conflict of interest statement

Declaration of interests The authors declare that they have no conflicts of interest with the contents of this article.

Figures

Figure 1
Figure 1
Luminal Ca2+ activates RyR2 but inhibits RyR1. (AD) Representative single-channel current traces of RyR1 (rabbit) or RyR2 (dog) channels are displayed on the left. Recording conditions, cytoplasmic (cyt) and luminal (lum) Ca2+ concentrations are indicated in the headline. The closed state current levels are labeled by “c”. Downward deflections represent channel openings. Open probability (Po) values are indicated in the top right corners. Calibration lines are displayed at the bottom. Corresponding mean ± SE values of relative open probabilities (Po) plotted as the function of luminal Ca2+ concentrations ([Ca2+]Lum) are shown on the right. (n = 5–7, A; n = 3–6, B; n = 3, C; n = 5–19, D). Values are expressed relative to the control (50 μM luminal Ca2+ for RyR1 or 1 μM luminal Ca2+ for RyR2). Cytoplasmic [Ca2+]s were 50 μM or 100 nM for RyR1 and 5 μM or 100 nM for RyR2, respectively, as indicated.
Figure 2
Figure 2
Voltage-dependent effect of luminal Ca2+. (A) Representative single-channel current traces of RyR1 recorded at +60 (left) and −60 mV (right). Top traces were recorded under control conditions, in symmetric 50 μM Ca2+. Bottom traces were recorded at 50 μM cytoplasmic (cyt) and 1 mM luminal (lum) Ca2+. The closed state current levels are labeled with “c” on the sides. (B) Relative Po % values are expressed as (Po 1 mM lum/Po 50 μM lum) – 1 and plotted as the function of the membrane potential (n = 7). Columns and error bars represent mean ± SE. Asterisk (∗) indicates p < 0.05. The illustration in the inset depicts the movement of Ca2+ directed by the driving force at −60 mV. To see this figure in color, go online.
Figure 3
Figure 3
Luminally applied Eu3+ inhibits RyR1. (A) Representative single-channel current traces of RyR1 recorded at 50 μM cytoplasmic (cyt) and luminal (lum) Ca2+ and in the presence of Eu3+ as indicated, which was added in addition to 50 μM Ca2+. Closed state current level is labeled by “c”. Downward deflections represent channel openings. Calibration lines are shown at the bottom. (B) Pooled data of currents, like shown in (A). Average values (±SE) of relative open probabilities (Po). Po values obtained from Eu3+-treated RyR1s were normalized to control (untreated) values and plotted as the function of luminal Eu3+ concentration ([Eu3+]Lum) (n = 4–19). Both the cytoplasmic and luminal [Ca2+] were 50 μM. Empty dots represent averaged data obtained in a recording medium containing 50 μM Ca2+, 1 mM Mg2+ (both sides), and 3 mM ATP in the cytoplasmic chamber. (C) Representative single-channel current traces of RyR1 recorded at 100 nM cytoplasmic (cyt) Ca2+ under control conditions and during additional Eu3+ treatment. The luminal [Ca2+] was 50 μM. (D) Average values of relative Pos of RyR1s obtained under conditions shown in (C). Po values of Eu3+ were normalized to control (untreated) values in the absence (white squares, w/o caff) or presence of 2 mM caffeine (black spheres, w/caff) (n = 3–11 and n = 4). Cytoplasmic [Ca2+] = 100 nM, and luminal = 50 μM. (E) Biphasic response of RyR2 to luminal Eu3+. Representative single-channel current traces of RyR2 recorded at 100 nM cytoplasmic (cyt) Ca2+ and during Eu3+ treatment. The closed state level of the channel is labeled by “c”. Luminal [Ca2+] was 5 μM. (F) Average values of relative Pos of multiple RyR2s. Po values of Eu3+ were normalized to control (untreated) values (n = 5).
Figure 4
Figure 4
Eu3+ occludes the pore. (A) Single-channel recordings demonstrate that RyR1 occasionally but permanently closes during 10 μM Eu3+ treatment, which is canceled by the chelation of Eu3+ using equimolar EGTA. EGTA was added ∼15 s before this trace. (B) Single-channel conductance as the function of [Eu3+]. Individual data points and mean ± SE are shown.
Figure 5
Figure 5
Voltage dependence of luminal Eu3+. (A and C) Representative single-channel current traces of RyR1 recorded at +60 (top) and −60 mV (bottom) under indicated ionic concentrations (50 μM and 100 nM cyt Ca2+, 50 μM lum Ca2+). Bottom traces were recorded after Eu3+ was added to the luminal face of the same channel in indicated concentrations. Closed state levels of the currents are labeled by “c”. (B) Pooled data of experiments similar to the sample recording in (A). Mean Po±SE at 8 μM Eu3+ plotted as the function of the membrane potential. [Ca2+]s were as in (A). The drawings in the inset illustrate the direction of Eu3+ movement at corresponding membrane potentials (n = 5). (C) Representative RyR1 currents recorded at +60 and −60 mV Ca2+ and Eu3+ concentrations, and Po values are indicated in the headline. (D) Relative Po values are expressed as (Po 1 mM lum/Po 50 μM lum) – 1 using recordings similar in (C). Mean ± SE values were plotted as the function of the membrane potential (n = 3 and n = 3). Asterisk (∗) indicates p<0.05 (E) Representative RyR2 currents recorded at +40 and −40 mV Ca2+ and Eu3+ concentrations, and Po values are indicated in the headline. (F) Relative Po values of RyR2 currents similar to that in (E) are expressed as (Po 1 mM lum/Po 5 μM lum) – 1. Mean ± SE values were plotted as the function of the membrane potential (n = 3 and n = 3). n.s., non-significant. To see this figure in color, go online.
Figure 6
Figure 6
MHS RyR1 is inhibited by luminal Ca2+. (A and C) Single-channel current traces of Y524S MHS RyR1 recorded at 50 μM or 100 nM cytoplasmic (cyt) and different concentrations of luminal (lum) Ca2+. Closed state level of the currents are labeled by “c”. (B) Values were expressed relative to control. Mean relative Po ±SE of wild-type RyR1 (white spheres) and Y524S MHS RyR1(black squares) recorded at 50 μM cytoplasmic (cyt) Ca2+ were plotted as the function of luminal Ca2+ concentration ([Ca2+]Lum) (n = 5–7 and n = 6–8). The [Ca2+]Lum in baseline conditions was 50 μM. (D) Mean relative Po ±SE of Y524S MHS RyR1 recorded at 100 nM cytoplasmic (cyt) Ca2+ plotted as the function of luminal Ca2+ concentration ([Ca2+]Lum) (n = 4–22). The [Ca2+]Lum in baseline conditions was 50 μM.
Figure 7
Figure 7
MHS RyR1 is inhibited by luminal Eu3+. (A and C) Single-channel current traces of Y524S MHS mouse RyR1 recorded at 50 μM or 100 nM cytoplasmic (cyt) Ca2+ and different concentrations of luminal (lum) Eu3+. The [Ca2+]Lum in baseline conditions was 50 μM. Closed state current levels are labeled by “c”. Channel openings are represented by downward deflections. (B) Pooled data of multiple RyR currents, similar to the example current shown in (A). Mean relative Po ±SE values of wild-type RyR1 (white spheres) and Y524S MHS RyR1 (black squares) recorded at 50 μM cytoplasmic (cyt) Ca2+ were plotted as the function of luminal (lum) Eu3+ concentration ([Eu3+]Lum) (n = 4–19 and (n = 6–8). (D) Pooled data of multiple RyR currents, similar to that of (C). Mean relative Po ±SE of Y524S MHS RyR1 recorded at 100 nM cytoplasmic (cis) Ca2+ plotted as the function of luminal Eu3+ concentration ([Eu3+]Lum) (n = 3–8).
Figure 8
Figure 8
Eu3+ binding site prediction on the luminal side of RyR2. Representatives of the two most likely metal ion binding sites predicted for RyR2. The view in panels (A) and (B) is down the RyR2 pore from the luminal side of the channel; PDB structure 5T15 is shown. (A) The two sites are indicated using colored sticks. The spheres show the possible binding locations for the Eu3+ ions as predicted by Placevent. The site comprised of residues 4893–4903 (the selectivity filter site) is colored yellow. D4917, which was also predicted to potentially interact with the bound ion by IonCom, is colored orange. Eu3+ is labeled with a yellow sphere. The S1-S2 luminal loop site (aa 4538–4550) is not labeled, as it is not resolved in the EM structure. (B) The electrostatic surface area of the luminal pore area. The electrostatic potential surface is ramped from −10 (red) to +10 (blue) kT/e. It can be seen that the luminal mouth, where the selectivity filter site is located, has a much greater overall negative charge than the surface loops. Eu3+ is colored yellow. (C) Schematic drawing illustrating the location of the putative inhibitory Ca2+ binding sites near the gate in RyR1. The yellow arrow shows the movement of Eu3+ in the transmembrane electric field at −60 mV membrane potential. Eu3+ is colored yellow. (D) Illustration of the location of the putative inhibitory Ca2+ binding sites near the gate and the putative activating binding site in the S1-S2 loop (in purple) in RyR2. (E) Sequence alignment of the luminal loop putative site (top) and the luminal pore site (bottom) of RyR1 and RyR2 of different species. The EF-hand-like sequence is labeled with red and the pore binding site with green letters. (F) Sequence of the putative luminal binding sites. To see this figure in color, go online.

Similar articles

Cited by

References

    1. Fill M., Copello J.A. Ryanodine Receptor Calcium Release Channels. Physiol. Rev. 2002;82:893–922. - PubMed
    1. Sárközi S., Szegedi C., et al. Jóna I. Regulation of the rat sarcoplasmic reticulum calcium release channel by calcium. J. Muscle Res. Cell Motil. 2000;21:131–138. - PubMed
    1. Szigeti G.P., Almássy J., et al. Jóna I. Alterations in the calcium homeostasis of skeletal muscle from postmyocardial infarcted rats. Pflügers Archiv. 2007;455:541–553. - PubMed
    1. Meissner G. Ryanodine Receptor/Ca2+ Release Channels and Their Regulation by Endogenous Effectors. Annu. Rev. Physiol. 1994;56:485–508. - PubMed
    1. Ashley R.H., Williams A.J. Divalent cation activation and inhibition of single calcium release channels from sheep cardiac sarcoplasmic reticulum. J. Gen. Physiol. 1990;95:981–1005. - PMC - PubMed

Publication types

MeSH terms

Substances

LinkOut - more resources