. 2023 Aug 1;11(1):coad056.
doi: 10.1093/conphys/coad056. eCollection 2023.

Conservation of thermal physiology in tropical intertidal snails following an evolutionary transition to a cooler ecosystem: climate change implications

Affiliations

Conservation of thermal physiology in tropical intertidal snails following an evolutionary transition to a cooler ecosystem: climate change implications

David J Marshall et al. Conserv Physiol. .

Abstract

Predictions for animal responses to climate warming usually assume that thermal physiology is adapted to present-day environments, and seldom consider the influence of evolutionary background. Little is known about the conservation of warm-adapted physiology following an evolutionary transition to a cooler environment. We used cardiac thermal performance curves (cTPCs) of six neritid gastropod species to study physiological thermal trait variation associated with a lineage transition from warmer rocky shores to cooler mangroves. We distinguished between functional thermal performance traits, related to energy homeostasis (slope gradient, slope curvature, HRmax, maximum cardiac activity and Topt, the temperature that maximizes cardiac activity) and a trait that limits performance (ULT, the upper lethal temperature). Considering the theory of optimal thermal performance, we predicted that the functional traits should be under greater selective pressure to change directionally and in magnitude than the thermal limit, which is redundant in the cooler environment. We found little variation in all traits across species, habitats and ecosystems, despite a ~20°C reduction in maximum habitat temperature in the mangrove species over 50 million years. While slope gradient was significantly lowered in the mangrove species, the effect difference was negated by greater thermal plasticity in the rocky shore species. ULT showed the least variation and suggested thermal specialization in the warmest habitat studied. The observed muted variation of the functional traits among the species may be explained by their limited role in energy acquisition and rather their association with heat tolerance adaptation, which is redundant in the mangrove species. These findings have implications for the conservation of habitat of intertidal gastropods that transition to cooler environments. Furthermore, they highlight the significance of evolutionary history and physiological conservation when predicting species responses to climate change.

Keywords: ecophysiology; gastropod; heat tolerance; thermal performance curve.


Conflict of interest statement

The authors declare no competing interests.

Figures

Figure 1
Figure 1
(A) The neritid species studied shown in apertural and abapertural view: a. Nerita chamaeleon, b. N. undata, c. N. albicilla, d. Neripteron violaceum, e. N. balteata and f. N. planospira. Scale bars represent 3 mm. (B) An abbreviated phylogeny of the species redrawn from Marshall et al. (2015), showing three independent transitions to mangroves (M). Rocky shore species occurred in the high shore (R/H), mid shore (R/M) and low shore (R/L). Numbers refer to divergence times (mya; Feng et al., 2021). Details of other phylogenies are given in Frey and Vermeij (2008), Frey (2010), Wang et al. (2019) and Feng et al. (2020, .
Figure 2
Figure 2
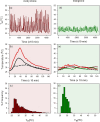
Environmental temperatures experienced by rocky shore and mangrove neritid snails (screened iButtons; Marshall et al., 2015) in Brunei. (a, d) Temperature was recorded every 10 min for 30 days from upper rocky shore (sun-exposed, air) and mangrove trunk (shade, air). (b, e) Daily temperature variation averaged for 30 days for rocky shore, max (red), mean (solid) and shade (dashed) and for mangrove, trunk max (red), trunk mean (dashed), leaf mean (green) and mud mean (brown, tidally influenced). (c, f) Temperature frequency distributions based on (a, d); mean and maximum temperature for the rocky shore were 31.8 and 51.3°C (Δ = 19.5°C), and for mangroves were 27.7 and 33.2°C (Δ = 4.5°C). Water temperatures typically vary between 27 and 30°C.
Figure 3
Figure 3
Predicted directional changes in cardiac traits with a transition from a warmer to a cooler marine intertidal environment. (a) Hypothetical cTPCs for a warm-adapted snail (A), a cool-adapted snail with Topt displaced towards cooler temperatures (B). (C) A cool-adapted snail with reduced HRmax as is observed in other intertidal gastropods (C). Slope gradient (shown here as a line drawn from HRmin to Topt; blue dashed line) may be similar or reduced and slope curvature is reduced in the cool-adapted snail. (b) The predictions are confirmed by cTPCs for a cool-adapted, low-rocky shore snail (Trochus radiatus; blue) and a hot-adapted, high-shore snail (Echinolittorina vidua; red). ULT is also reduced in the cooler-adapted snail. Data were plotted for two representative individuals from the same rocky shore and curves were fitted using negative exponential smoothing (Sigmaplot ver. 14) after correcting the data to a baseline of 50 BPM (see Monaco et al., 2017).
Figure 4
Figure 4
Variability on cTPC described using the Sharpe-Schoolfield’s model for rocky shore snails (a = N. undata, c = N. chamaeleon and e = N. albicilla) and mangrove snails (b = N. planospira, d = N. balteata and f = Neript. violaceum). Dotted and dashed vertical lines represent mean (± SD, shaded area) values of Topt and mean ULT, respectively. n = 9 snails for each species. Arrows indicate thresholds for temperature-insensitive heart rate responses by some individuals.
Figure 5
Figure 5
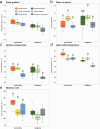
Physiological thermal traits estimated from TPCs (heart rate versus temperature) for three rocky shore and three mangrove neritid snail species. (a) and (b) Slope parameter of the relationship between heart rate (log2-transformed) and temperature for the up-slope section of the curves (i.e. temperatures < Topt). (c) Optimal temperatures (Topt). (d) Upper lethal temperature (ULT). (e) Maximum heart rate (HRmax). The slope gradient and Topt represent sub-lethal traits, while ULT is the lethal physiological limit. Different letters above the boxes indicate habitat-specific differences among species.
Figure 6
Figure 6
Acclimation experiment. Variability on cTPC described using the Sharpe-Schoolfield’s model for a rocky shore snail (Nerita undata) and a mangrove snail (Neripteron violaceum) acclimated to cool and hot temperature treatments. Dotted and dashed vertical lines represent mean (±SD, shaded area) values of Topt and mean ULT, respectively. n = 6 snails for each species.
Figure 7
Figure 7
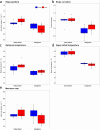
Acclimation experiment. Physiological thermal traits estimated from TPCs (heart rate versus temperature) for a rocky shore (N. undulata) and a mangrove neritid (Neript. violaceum) snail species acclimated to hot and cool temperature treatment. (a) Slope gradient and (b) slope curvature parameters of the relationship between heart rate and temperature for the up-slope section of the curves (i.e. temperatures < Topt). (c) Optimal temperatures (Topt). (d) Upper lethal temperature (ULT). (e) Maximum heart rate (HRmax). The slope gradient, slope curvature and Topt represent sublethal traits, while ULT is the lethal physiological limit. Different letters above the boxes indicate habitat-specific differences between species.
Figure 8
Figure 8
Coefficient of variation (formula image) of the sub-lethal (i.e. Topt), lethal (i.e. ULT) and performance (i.e. slope gradient, slope curvature, and HRmax) thermal traits of three rocky shore and three mangrove neritid gastropod species.

Similar articles

References

    1. Angilletta MJ (2009) Thermal Adaptation: A Theoretical and Empirical Synthesis. Oxford University Press, Oxford, England
    1. Araújo MB, Ferri-Yáñez F, Bozinovic F, Marquet PA, Valladares F, Chown SL (2013) Heat freezes niche evolution. Ecol Lett 16: 1206–1219. 10.1111/ele.12155. - DOI - PubMed
    1. Barker C, Monaco CJ, McQuaid CD (2021) Exposure to fluctuating temperature increases thermal sensitivity in two lineages of the intertidal mussel Perna perna. Mar Ecol Prog Ser 668: 85–95. 10.3354/meps13713. - DOI
    1. Bennett JM, Sunday J, Calosi P, Villalobos F, Martínez B, Molina-Venegas R, Araújo MB, Algar AC, Clusella-Trullas S, Hawkins BAet al. (2021) The evolution of critical thermal limits of life on Earth. Nat Commun 12: 1198. 10.1038/s41467-021-21263-8. - DOI - PMC - PubMed
    1. Bodensteiner BL, Agudelo-Cantero GA, Arietta AZA, Gunderson AR, Muñoz MM, Refsnider JM, Gangloff EJ (2021) Thermal adaptation revisited: how conserved are thermal traits of reptiles and amphibians? Journal of Experimental Zoology 335: 173–194. 10.1002/jez.2414. - DOI - PubMed