. 2023 May 12;26(7):106856.
doi: 10.1016/j.isci.2023.106856. eCollection 2023 Jul 21.

Assessing justice in California's transition to electric vehicles

Affiliations

Assessing justice in California's transition to electric vehicles

Eleanor M Hennessy et al. iScience. .

Abstract

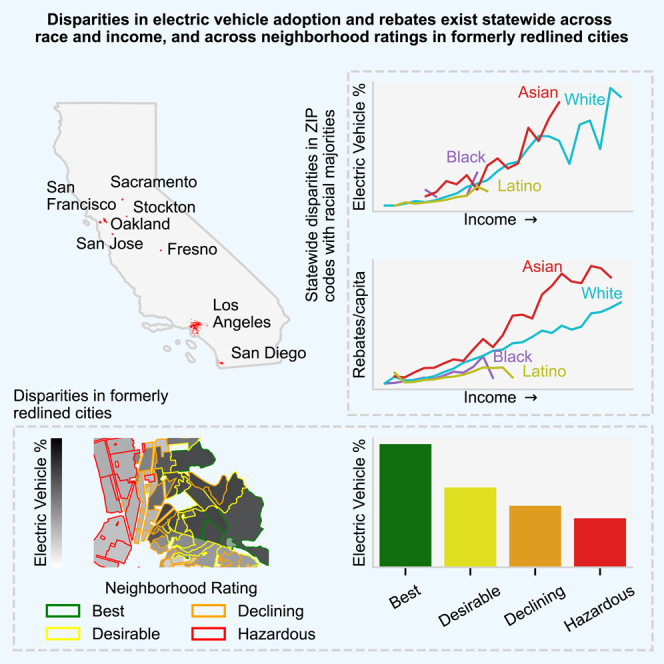
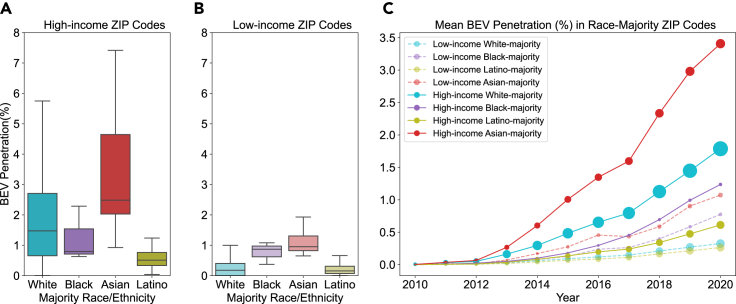
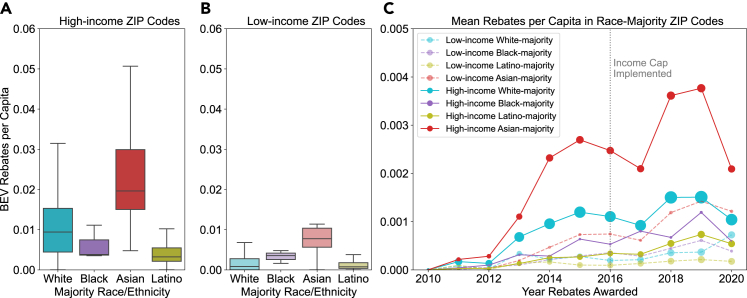
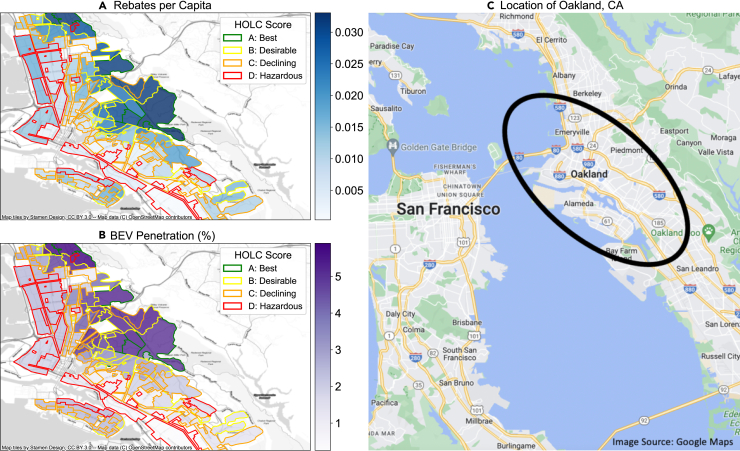
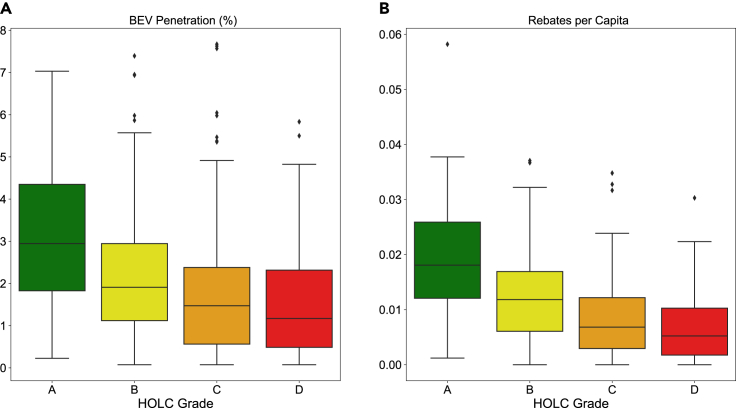
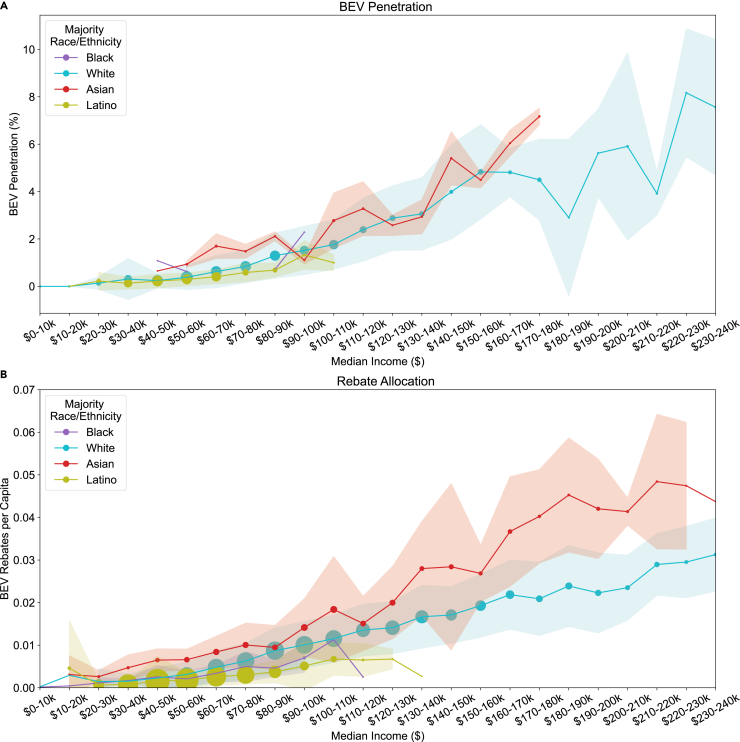
Passenger vehicles are an essential form of transportation and contribute significantly to greenhouse gas emissions and criteria air pollution. The health and climate effects associated with their use disproportionately impact low-income communities and people of color. A shift from conventional vehicles to zero-emission vehicles is essential to meet climate targets and reduce inequities. The transition to clean transportation is an opportunity to uplift underserved and marginalized communities while building a sustainable transportation system. We assess justice in California's transition to electric passenger vehicles by analyzing publicly available data on electric vehicle adoption and rebate use to measure justice in three areas: distribution of electric vehicles, allocation of state incentives, and the social and historical context of redlining. We find electric vehicle adoption and rebate use are lower in low-income and Latino-majority ZIP codes and in formerly redlined neighborhoods, indicating that California's electric vehicle transition has not been just thus far.

Keywords: Energy management; Energy policy; Energy resources.


Conflict of interest statement

The authors declare no competing interests.

Figures

None
Graphical abstract
Figure 1
Figure 1
BEV penetration in high- and low-income ZIP codes with racial and ethnic majorities (A) BEV penetration in 2020 in high-income racial and ethnic-majority ZIP codes. Statistical significance of the difference between medians is as follows: White vs. Black: ∗∗∗; White vs. Asian: ∗∗∗∗; White vs. Latino: ∗∗∗∗; Black vs. Asian: ∗∗∗∗; Black vs. Latino: ∗∗; Asian vs. Latino: ∗∗∗∗. ns = no statistical significance, ∗ = p ≤ 0.05, ∗∗ = p ≤ 0.01, ∗∗∗ = p ≤ 0.001, ∗∗∗∗ = p ≤ 0.0001. The midline indicates the median, the upper and lower edges of the box indicate the upper and lower quartiles, and the whiskers indicate the minimum and maximum values excluding outliers. (B) BEV penetration in 2020 in low-income racial and ethnic-majority ZIP codes. Statistical significance of the difference between medians is as follows: White vs. Black: ∗; White vs. Asian: ∗∗∗∗; White vs. Latino: ∗∗∗∗; Black vs. Asian: ∗∗∗∗; Black vs. Latino: ∗∗∗; Asian vs. Latino: ∗∗∗∗. ns = no statistical significance, ∗ = p ≤ 0.05, ∗∗ = p ≤ 0.01, ∗∗∗ = p ≤ 0.001, ∗∗∗∗ = p ≤ 0.0001. The midline indicates the median, the upper and lower edges of the box indicate the upper and lower quartiles, and the whiskers indicate the minimum and maximum values excluding outliers. (C) Mean BEV penetration in ZIP codes in each racial/ethnic and income category from 2010 to 2020.
Figure 2
Figure 2
BEV rebates per capita in high- and low-income ZIP codes with racial and ethnic majorities (A) Cumulative BEV rebates per capita in high-income racial and ethnic-majority ZIP codes. Statistical significance of the difference between medians is as follows: White vs. Black: ∗∗∗; White vs. Asian: ∗∗∗∗; White vs. Latino: ∗∗∗∗; Black vs. Asian: ∗∗∗∗; Black vs. Latino: ∗∗; Asian vs. Latino: ∗∗∗∗. ns = no statistical significance, ∗ = p ≤ 0.05, ∗∗ = p ≤ 0.01, ∗∗∗ = p ≤ 0.001, ∗∗∗∗ = p ≤ 0.0001. The midline indicates the median, the upper and lower edges of the box indicate the upper and lower quartiles, and the whiskers indicate the minimum and maximum values excluding outliers. (B) Cumulative BEV rebates per capita in low-income racial and ethnic-majority ZIP codes. Statistical significance of the difference between medians is as follows: White vs. Black: ∗; White vs. Asian: ∗∗∗∗; White vs. Latino: ∗∗∗∗; Black vs. Asian: ∗∗∗∗; Black vs. Latino: ∗∗∗; Asian vs. Latino: ∗∗∗∗. ns = no statistical significance, ∗ = p ≤ 0.05, ∗∗ = p ≤ 0.01, ∗∗∗ = p ≤ 0.001, ∗∗∗∗ = p ≤ 0.0001. The midline indicates the median, the upper and lower edges of the box indicate the upper and lower quartiles, and the whiskers indicate the minimum and maximum values excluding outliers. (C) Mean annual BEV rebates per capita from 2010 to 2020.
Figure 3
Figure 3
BEV penetration and rebates per capita in formerly redlined neighborhoods in Oakland, California (A) Cumulative rebates per capita awarded in neighborhoods in Oakland, California. Darker blue indicates higher rebates per capita. The color of the outlines corresponds to the HOLC score in the neighborhood, with green corresponding to an “A” grade, yellow corresponding to a “B” grade, orange to a “C” grade, and red to a “D” grade. (B) BEV penetration in 2020 in neighborhoods in Oakland, California. Darker purple indicates higher BEV penetration. The color of the outlines corresponds to the HOLC score in the neighborhood, with green corresponding to an “A” grade, yellow corresponding to a “B” grade, orange to a “C” grade, and red to a “D” grade. (C) Location of Oakland, California. Figures showing additional cities can be found in the SI (Figures S8–S14).
Figure 4
Figure 4
BEV penetration and rebates per capita in formerly redlined cities in California (A) BEV Penetration in redlined neighborhoods. Statistical significance of the difference between medians is as follows: A vs. B: ∗∗∗∗; A vs. C: ∗∗∗∗; A vs. D: ∗∗∗∗; B vs. C: ∗∗∗∗; C vs. D: ns. ns = no statistical significance, ∗ = p ≤ 0.05, ∗∗ = p ≤ 0.01, ∗∗∗ = p ≤ 0.001, ∗∗∗∗ = p ≤ 0.0001. The midline indicates the median, the upper and lower edges of the box indicate the upper and lower quartiles, and the whiskers indicate the minimum and maximum values excluding outliers. (B) Rebates per capita in redlined neighborhoods. Statistical significance of the difference between medians is as follows: A vs. B: ∗∗∗∗; A vs. C: ∗∗∗∗; A vs. D: ∗∗∗∗; B vs. C: ∗∗∗∗; B vs. D: ∗∗∗∗; C vs. D: ∗. ns = no statistical significance, ∗ = p ≤ 0.05, ∗∗ = p ≤ 0.01, ∗∗∗ = p ≤ 0.001, ∗∗∗∗ = p ≤ 0.0001. The midline indicates the median, the upper and lower edges of the box indicate the upper and lower quartiles, and the whiskers indicate the minimum and maximum values excluding outliers.
Figure 5
Figure 5
BEV penetration and BEV rebates per capita in ZIP codes with racial and ethnic majorities across income levels (A) BEV penetration in racial and ethnic-majority ZIP codes by median income. Marker size corresponds to the number of ZIP codes, marker location indicates the mean BEV penetration, and shading indicates the standard deviation of BEV penetration in each income bracket and racial/ethnic-majority. (B) BEV rebates per capita in racial and ethnic-majority census tracts. Note that census tracts are used in this analysis due to their finer granularity and larger sample size. Marker size corresponds to the number of census tracts, marker location indicates the mean rebates per capita, and shading indicates the standard deviation of rebates per capita in each income bracket and racial/ethnic-majority.

References

    1. IPCC . Climate Change 2021: The Physical Science Basis. Contribution of Working Group I to the Sixth Assessment Report of the Intergovernmental Panel on Climate Change. 2021. Summary for policymakers. - DOI
    1. United States Environmental Protection Agency Global greenhouse gas emissions data. https://www.epa.gov/ghgemissions/globalgreenhouse-gas-emissions-data
    1. United States Environmental Protection Agency Sources of greenhouse gas emissions. https://www.epa.gov/ghgemissions/sourcesgreenhouse-gas-emissions
    1. California Air Resources Board California greenhouse gas emissions for 2000 to 2019. 2021. https://ww2.arb.ca.gov/sites/default/files/classic/cc/ca_ghg_inventory_t...
    1. Moody J., Farr E., Papagelis M., Keith D.R. The value of car ownership and use in the United States. Nat. Sustain. 2021;4:769–774. doi: 10.1038/s41893-021-00731-5. - DOI

LinkOut - more resources