. 2023 May 29;26(7):106999.
doi: 10.1016/j.isci.2023.106999. eCollection 2023 Jul 21.

Peroxisome proliferator activated receptor-γ in osteoblasts controls bone formation and fat mass by regulating sclerostin expression

Affiliations

Peroxisome proliferator activated receptor-γ in osteoblasts controls bone formation and fat mass by regulating sclerostin expression

Soohyun P Kim et al. iScience. .

Abstract

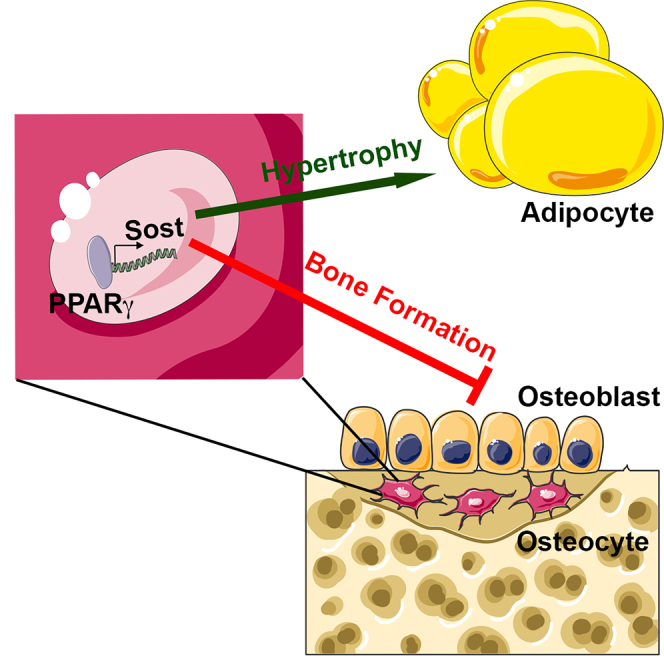
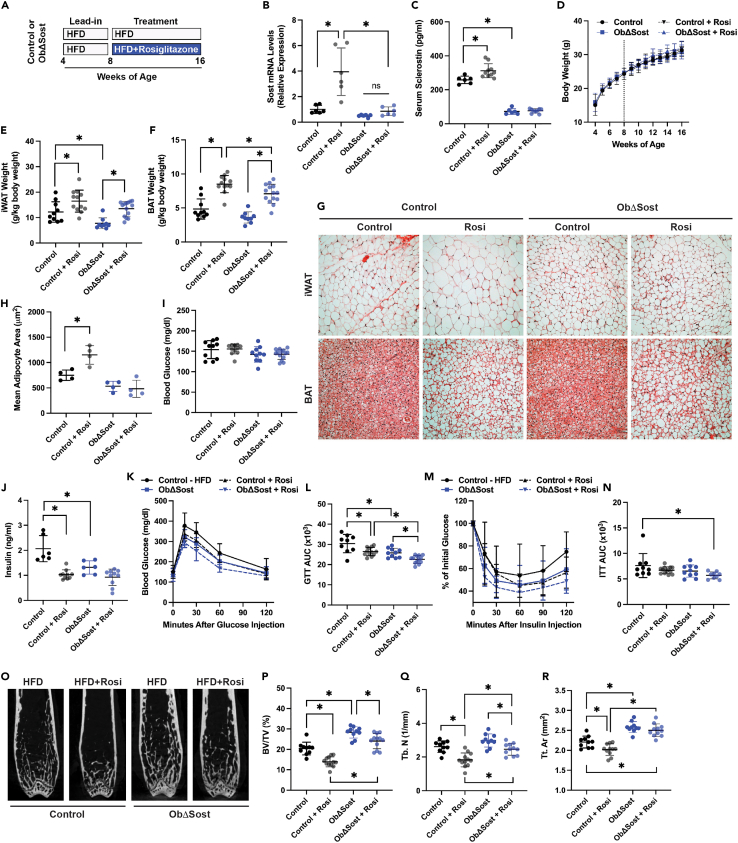
The nuclear receptor peroxisome proliferator activated receptor-γ (PPARγ) is a key contributor to metabolic function via its adipogenic and insulin-sensitizing functions, but it has negative effects on skeletal homeostasis. Here, we questioned whether the skeletal and metabolic actions of PPARγ are linked. Ablating Pparg expression in osteoblasts and osteocytes produced a high bone mass phenotype, secondary to increased osteoblast activity, and a reduction in subcutaneous fat mass because of reduced fatty acid synthesis and increased fat oxidation. The skeletal and metabolic phenotypes in Pparg mutants proceed from the regulation of sclerostin production by PPARγ. Mutants exhibited reductions in skeletal Sost expression and serum sclerostin levels while increasing production normalized both phenotypes. Importantly, disrupting the production of sclerostin synergized with the insulin-sensitizing actions of a PPARγ agonist while preventing bone loss. These data suggest that modulating sclerostin action may prevent bone loss associated with anti-diabetic therapies and augment their metabolic actions.

Keywords: Cell biology; Molecular physiology.


Conflict of interest statement

The authors declare that they have no known competing financial interests or personal relationships that could have appeared to influence the work reported in this article.

Figures

None
Graphical abstract
Figure 1
Figure 1
ΔPparg mice develop an increase in bone volume (A) qPCR analysis of Pparg mRNA levels in the femur of male control and ΔPparg mice (n = 6–8 mice per genotype). (B) Allele-specific PCR analysis of Pparg gene recombination in tissues isolated from a ΔPparg mouse. (C) Body weight of male control and ΔPparg mice (n = 6–11 mice per genotype). (D) Representative microCT images of the distal femur in male control and ΔPparg mice at the indicated ages. (E–G) MicroCT quantification of trabecular bone volume per tissue volume (BV/TV, E), trabecular number (Tb.N, F) and trabecular thickness (Tb.Th, G) in the distal femur of male control and ΔPparg mice (n = 8–10 mice per genotype). (H) Representative microCT images of the femoral mid-diaphysis from male 24-week-old control and ΔPparg mice. (I–K) MicroCT quantification of cortical tissue area (Tt.Ar, I), cortical bone area per tissue area (Ct.Ar/Tt.Ar, J) and cortical thickness (Ct.Th, K) at the femoral mid-diaphysis of control and ΔPparg mice (8–10 mice per genotype). (L–O) Dynamic histomorphometric quantification of osteoblastic activity in 16-week-old male control and ΔPparg mice including assessment of mineralizing surface per bone surface (MS/BS, L), representative calcein and alizarin red labeled sections (M), mineral apposition rate (MAR, N), and bone formation rate per bone surface (BFR/BS, O) (n = 6–7 mice per genotype). (P) Representative histological images stained for tartrare-resistant acid phosphate activity (10× original magnification). (Q) Quantification of osteoclast number per bone surfaces (Oc.N/BS) in the distal femur (7 mice per genotype). (R) Representative hematoxylin and eosin-stained histological sections to identify marrow adipocytes (10× original magnification). Data presented as mean and standard deviation. ∗, p < 0.05 comparison between control and knockout, #, p < 0.05 comparison between an 8-week timepoint and the labeled timepoint in control mice. Data were analyzed by unpaired Student’s t test.
Figure 2
Figure 2
ΔPparg mice have reduced fat mass and increase insulin sensitivity (A–C) Mass of the gonadal (gWAT, A), inguinal (iWAT, B), and intrascapular brown (BAT, C) adipose were assessed in male control and ΔPparg mice and normalized to body weight (n = 9–11 mice per genotype). (D) Representative histological sections of iWAT and BAT stained with hematoxylin and eosin or immunostained for UCP1 expression (10× original magnification) from 16-week-old male mice. (E) Food intake during 12 h light and dark periods (n = 7 mice per genotype). (F) Energy expenditure assessed by indirect calorimetry (n = 7 mice per genotype). (G and I) qPCR analysis of gene expression in iWAT isolated from 16-week-old male mice (n = 6 mice per genotype). (H and J) Representative western blot analysis of protein expression in iWAT. (K) qPCR analysis of gene expression in intrascapular brown adipose tissue (n = 6 mice per genotype). (L–N) Random fed serum lipid analysis in 16-week-old male control and ΔPparg mice (n = 8–9 mice per genotype). (O and P) Random fed glucose and serum insulin levels (n = 9 mice per genotype). (Q and R). Representative hematoxylin and eosin stained histological sections of pancreatic b-cell islets (20× original magnification) and quantification of islet area (n = 6 mice per genotype). (S and T) Glucose tolerance (S) and insulin tolerance (T) test at age 16 weeks(n = 8–9 mice per genotype). (U) Western blot analysis of AKT phosphorylation in iWAT, quadriceps and liver before and after insulin injection. Fold change in phosphorylation levels relative to untreated samples are show for each tissue (n = 8 mice per genotype). Data presented as mean and standard deviation. ∗, p < 0.05. Data were analyzed by unpaired Student’s t test.
Figure 3
Figure 3
ΔPparg mice are resistant to high fat diet feeding Male control and ΔPparg mice were fed a high fat diet (60% kcal from fat) from ages 4 to 16 weeks. (A and B) MicroCT quantification of trabecular bone volume per tissue volume (BV/TV) in the distal femur (A) and cortical tissue area (Tt.Ar, B, (n = 8 mice per genotype)). (C) Weekly assessment of body weights in control and ΔPparg mice fed a high fat diet (n = 9–10 mice per genotype). (D–F) Mass of white adipose tissue depots (D), BAT (E), and liver (F) normalized to body weight (n = 8–10 mice per genotype). (G) Representative hematoxylin and eosin histological sections of iWAT, BAT, and liver (10× original magnification). (H) Size distribution of adipocytes in histological sections of iWAT (n = 5 mice per genotype). (I–K) qPCR and western blot analysis of genes (I) and proteins (J) involved in fatty acid synthesis and genes involved in fatty acid catabolism or beiging (K) (n = 6 mice per genotype). (L) Quantification of triglycerides liver tissue (n = 8–10 mice per genotype). (M and N) qPCR and western blot analysis of genes and proteins involved in fatty acid synthesis and steatosis in the liver of high fat diet fed control and ΔPparg mice (n = 6 mice per genotype). (O and P) Random fed glucose and insulin levels (n = 8–10 mice per genotype). (Q and R) Glucose tolerance (Q) and insulin tolerance test (R) after 12 weeks of high-fat diet feeding (n = 8–10 mice per genotype). (S–U) Random fed serum lipid analysis in high fat diet fed control and ΔPparg mice (n = 8–10 mice per genotype). Data presented as mean and standard deviation. ∗, p < 0.05. Data were analyzed by unpaired Student’s t test.
Figure 4
Figure 4
PPARγ in osteoblasts regulated sclerostin production to influence metabolism (A) qPCR analysis of Sost mRNA levels in the femur of male control and ΔPparg mice (n = 6–8 mice per genotype). (B) Quantification of serum sclerostin levels in male control and ΔPparg mice (n = 6–8 mice per genotype). (C and D) Sost mRNA levels (n = 6 mice per genotype, C) and serum sclerostin levels (n = 8–10 mice per genotype, D) were quantified in male control and ΔPparg mice fed a high fat diet (60% kcal from fat) from ages 4 to 16 weeks. (E and F) Sost mRNA levels (n = 6 mice per genotype, C) and serum sclerostin levels (n = 6–8 mice per genotype, D) were quantified in female control and ΔPparg mice. (G) qPCR analysis of Sost mRNA levels in cultures of control and ΔPparg primary osteoblasts after 14 days of differentiation (n = 11 samples per group). (H and I) qPCR analysis of Sost (H) and Axin2 (I) mRNA levels in Ocy454 cells 24 h after treatment with vehicle or rosiglitazone (n = 6 samples per group). (J) Western blot analysis of active, non-phosphorylated b-catenin and total b-catenin in the iWAT of 16-week-old male control and ΔPparg mice. (K and L) qPCR analysis of Axin2 and Ctnnb1 mRNA levels in the iWAT of control and ΔPparg mice fed a chow diet (K) or a high fat diet from ages 4 to 16 weeks (n = 5–6 mice per genotype). (M–Y) 8-week-old control and ΔPparg mice were injected with AAV-8 constructs directing the expression of Sost or GFP and then aged for an additional 8 weeks. (M) Serum sclerostin levels (n = 8–10 mice per group). (N) Western blot analysis of active, non-phosphorylated β-catenin and total β-catenin in the iWAT. (O) Weight gained during the 8-week experiment (n = 8–10 mice per group). (P and Q) Representative microCT images of the distal femur and quantification of trabecular bone volume (n = 8–10 mice per group). (R) iWAT mass (n = 8–10 mice per group). (S) Representative hematoxylin and eosin histological sections of iWAT (10× original magnification). (T and U) qPCR analysis of Fasn and Ucp1 mRNA levels in iWAT (n = 8–9 mice per group). (V) Random fed blood glucose (n = 8–10 mice per group). (W) Serum insulin levels (n = 8–10 mice per group). (X and Y) Insulin tolerance testing and area under the curve analysis (n = 8–10 mice per group). Data presented as mean and standard deviation. ∗, p < 0.05. Data were analyzed by unpaired Student’s t test or Anova followed by Tukey’s multiple comparison post hoc test.
Figure 5
Figure 5
Sost gene deficiency synergizes with the metabolic actions of rosiglitazone 4-week-old male control and ObΔSost mice were fed a high fat diet (HFD, 60% kcal from fat) for 4 weeks and then randomly to continue on an HFD or fed an HFD containing rosiglitazone (100 ppm), which results in treatment with 20 mg/kg/day rosiglitazone. (A) Schematic of experimental plan. (B and C) qPCR analysis of Sost mRNA levels in the femur (B, n = 6 mice per group) and serum sclerostin levels (C, n = 6–10 mice per group) at the conclusion of the experiment. (D) Weekly body weight during the 12-week experiment (n = 10–14 mice per group). The vertical dash lined marks the start of rosiglitazone containing diet. (E and F) iWAT and BAT tissue weight (n = 10–14 mice per group). (G) Representative hematoxylin and eosin histological sections of iWAT and BAT (10× original magnification). (H) Quantification of iWAT adipocyte area (n = 4 mice per group). (I and J) Quantification of random fed blood glucose levels (I, n = 10–14 mice per group) and serum insulin levels (J, n = 6–10 mice per group). (K and L) Glucose tolerance testing and area under the curve analysis (n = 9–13 mice per group). (M and N) Insulin tolerance testing and area under the curve analysis (n = 9–13 mice per group). (O) Representative microCT images of the distal femur (P-P) MicroCT quantification of trabecular bone volume per tissue volume (BV/TV, P), trabecular number (Tb.N, Q) cortical tissue area (Tt.Ar, R) at the mid-diaphysis (n = 10–11 mice per group). Data presented as mean and standard deviation. ∗, p < 0.05. Data were analyzed by unpaired Student’s t test or Anova followed by Tukey’s multiple comparison post hoc test.

Similar articles

Cited by

References

    1. Misra M., Klibanski A. Endocrine consequences of anorexia nervosa. Lancet Diabetes Endocrinol. 2014;2:581–592. doi: 10.1016/S2213-8587(13)70180-3. - DOI - PMC - PubMed
    1. Hofbauer L.C., Busse B., Eastell R., Ferrari S., Frost M., Müller R., Burden A.M., Rivadeneira F., Napoli N., Rauner M. Bone fragility in diabetes: novel concepts and clinical implications. Lancet Diabetes Endocrinol. 2022;10:207–220. doi: 10.1016/S2213-8587(21)00347-8. - DOI - PubMed
    1. Kajimura D., Lee H.W., Riley K.J., Arteaga-Solis E., Ferron M., Zhou B., Clarke C.J., Hannun Y.A., DePinho R.A., Guo X.E., et al. Adiponectin regulates bone mass via opposite central and peripheral mechanisms through FoxO1. Cell Metab. 2013;17:901–915. doi: 10.1016/j.cmet.2013.04.009. - DOI - PMC - PubMed
    1. Estell E.G., Le P.T., Vegting Y., Kim H., Wrann C., Bouxsein M.L., Nagano K., Baron R., Spiegelman B.M., Rosen C.J. Irisin directly stimulates osteoclastogenesis and bone resorption in vitro and in vivo. Elife. 2020;9:e58172. doi: 10.7554/eLife.58172. - DOI - PMC - PubMed
    1. Hansen M.S., Frost M. Alliances of the gut and bone axis. Semin. Cell Dev. Biol. 2022;123:74–81. doi: 10.1016/j.semcdb.2021.06.024. - DOI - PubMed

LinkOut - more resources