Development and Validation of Prediction Models for All-Cause Mortality and Cardiovascular Mortality in Patients on Hemodialysis: A Retrospective Cohort Study in China
- PMID: 37534232
- PMCID: PMC10392814
- DOI: 10.2147/CIA.S416421
Development and Validation of Prediction Models for All-Cause Mortality and Cardiovascular Mortality in Patients on Hemodialysis: A Retrospective Cohort Study in China
Abstract
Purpose: This study aimed to develop two predictive nomograms for the assessment of long-term survival status in hemodialysis (HD) patients by examining the prognostic factors for all-cause mortality and cardiovascular (CVD) event mortality.
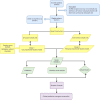
Patients and methods: A total of 551 HD patients with an average age of over 60 were included in this study. The patients' medical records were collected from our hospital and randomly allocated to two cohorts: the training cohort (n=385) and the validation cohort (n=166). We employed multivariate Cox assessments and fine-gray proportional hazards models to explore the predictive factors for both all-cause mortality and cardiovascular event mortality risk in HD patients. Two nomograms were established based on predictive factors to forecast patients' likelihood of survival for 3, 5, and 8 years. The performance of both models was evaluated using the area under the curve (AUC), calibration plots, and decision curve analysis.
Results: The nomogram for all-cause mortality prediction included seven factors: age ≥ 60, sex (male), history of diabetes and coronary artery disease, diastolic blood pressure, total triglycerides (TG), and total cholesterol (TC). The nomogram for cardiovascular event mortality prediction included three factors: history of diabetes and coronary artery disease, and total cholesterol (TC). Both models demonstrated good discrimination, with AUC values of 0.716, 0.722 and 0.725 for all-cause mortality at 3, 5, and 8 years, respectively, and 0.702, 0.695, and 0.677 for cardiovascular event mortality, respectively. The calibration plots indicated a good agreement between the predictions and the decision curve analysis demonstrated a favorable clinical utility of the nomograms.
Conclusion: Our nomograms were well-calibrated and exhibited significant estimation efficiency, providing a valuable predictive tool to forecast prognosis in HD patients.
Keywords: all-cause; cardiovascular; hemodialysis; model; mortality; nomogram.
© 2023 Yang et al.
Conflict of interest statement
The authors declare that they have no competing interests.
Figures


References
MeSH terms
Substances
LinkOut - more resources
Full Text Sources
Medical
Miscellaneous

