. 2023 Jul 18:13:1210130.
doi: 10.3389/fonc.2023.1210130. eCollection 2023.

PLX4032 resistance of patient-derived melanoma cells: crucial role of oxidative metabolism

Affiliations

PLX4032 resistance of patient-derived melanoma cells: crucial role of oxidative metabolism

Ombretta Garbarino et al. Front Oncol. .

Abstract

Background: Malignant melanoma is the most lethal form of skin cancer which shows BRAF mutation in 50% of patients. In this context, the identification of BRAFV600E mutation led to the development of specific inhibitors like PLX4032. Nevertheless, although its initial success, its clinical efficacy is reduced after six-months of therapy leading to cancer relapse due to the onset of drug resistance. Therefore, investigating the mechanisms underlying PLX4032 resistance is fundamental to improve therapy efficacy. In this context, several models of PLX4032 resistance have been developed, but the discrepancy between in vitro and in vivo results often limits their clinical translation.

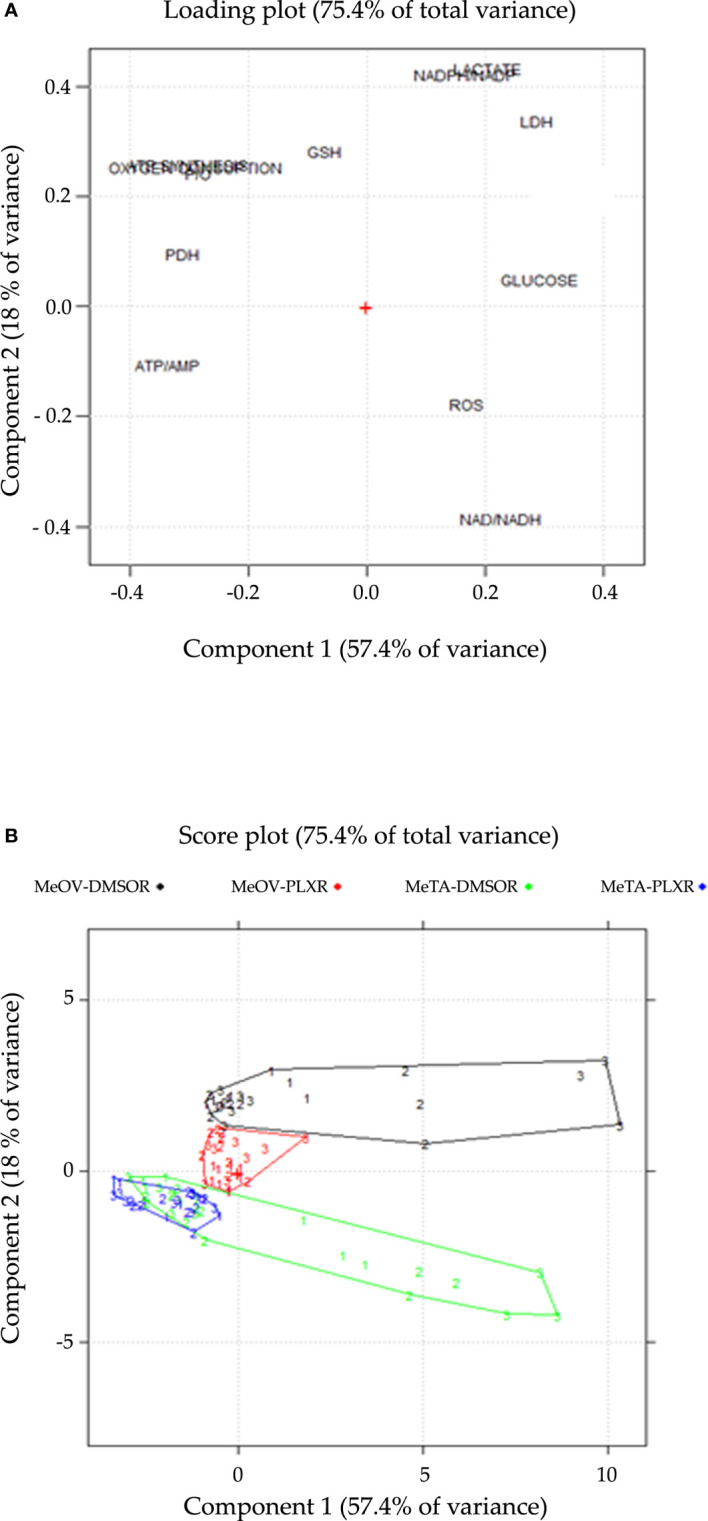
Methods: The herein reported model has been realized by treating with PLX4032, for six months, patient-derived BRAF-mutated melanoma cells in order to obtain a reliable model of acquired PLX4032 resistance that could be predictive of patient's treatment responses. Metabolic analyses were performed by evaluating glucose consumption, ATP synthesis, oxygen consumption rate, P/O ratio, ATP/AMP ratio, lactate release, lactate dehydrogenase activity, NAD+/NADH ratio and pyruvate dehydrogenase activity in parental and drug resistant melanoma cells. The intracellular oxidative state was analyzed in terms of reactive oxygen species production, glutathione levels and NADPH/NADP+ ratio. In addition, a principal component analysis was conducted in order to identify the variables responsible for the acquisition of targeted therapy resistance.

Results: Collectively, our results demonstrate, for the first time in patient-derived melanoma cells, that the rewiring of oxidative phosphorylation and the maintenance of pyruvate dehydrogenase activity and of high glutathione levels contribute to trigger the onset of PLX4032 resistance.

Conclusion: Therefore, it is possible to hypothesize that inhibitors of glutathione biosynthesis and/or pyruvate dehydrogenase activity could be used in combination with PLX4032 to overcome drug resistance of BRAF-mutated melanoma patients. However, the identification of new adjuvant targets related to drug-induced metabolic reprogramming could be crucial to counteract the failure of targeted therapy in metastatic melanoma.

Keywords: BRAF; PLX4032; glutathione; melanoma; oxidative metabolism; pyruvate dehydrogenase; targeted therapy resistance.


Conflict of interest statement

The authors declare that the research was conducted in the absence of any commercial or financial relationships that could be construed as a potential conflict of interest.

Figures

Figure 1
Figure 1
Chronic exposure of MeOV (A) and MeTA (B) melanoma cells to PLX4032 or DMSO is able to select a resistant phenotype. PLX4032 and DMSO chronically-treated MeOV and MeTA cells were exposed for 72 h to increasing concentrations (0.1-20 µM) of PLX4032 (left panels) or DMSO (0.0025-0.1% v/v) (right panels) and cell viability was analyzed by MTT assay. The blue line is drawn at 50% cell viability. Graphs summarize quantitative data of the means ± S.E.M. of four independent experiments. **p<0.01 vs. untreated cells; ***p<0.001 vs. untreated cells; ****p<0.0001 vs. untreated cells.
Figure 2
Figure 2
Analysis of glucose consumption in DMSO-R (left panels) and PLX-R (right panels) MeOV (A) and MeTA (B) cells exposed to 1.5 µM PLX4032 or to DMSO for 24, 48 and 72 h. Results were reported as mM glucose/106 cells. Histograms summarize quantitative data of the means ± S.E.M. of four independent experiments. **p<0.01 vs. untreated cells (Ctr); ***p<0.001 vs. untreated cells (Ctr); ****p<0.0001 vs. untreated cells (Ctr).
Figure 3
Figure 3
Analysis of ATP synthesis using pyruvate plus malate (P/M, Complex I, upper panels) or succinate (succ, Complex II, lower panels) in DMSO-R (left panels) and PLX-R (right panels) MeOV (A) and MeTA (B) cells exposed to 1.5 µM PLX4032 or to DMSO for 24, 48 and 72 h. Results were reported as nmol ATP/min/106 cells. Histograms summarize quantitative data of the means ± S.E.M. of four independent experiments. *p<0.1 vs. untreated cells (Ctr); **p<0.01 vs. untreated cells (Ctr); ***p<0.001 vs. untreated cells (Ctr); ****p<0.0001 vs. untreated cells (Ctr).
Figure 4
Figure 4
Analysis of oxygen consumption rate (OCR) using pyruvate plus malate (P/M, Complex I, upper panels) or succinate (succ, Complex II, lower panels) in DMSO-R (left panels) and PLX-R (right panels) MeOV (A) and MeTA (B) in cells exposed to 1.5 µM PLX4032 or to DMSO for 24, 48 and 72 h. Results were reported as nmol O2/min/106 cells. Histograms summarize quantitative data of the means ± S.E.M. of four independent experiments. **p<0.01 vs. untreated cells (Ctr); ***p<0.001 vs. untreated cells (Ctr); ****p<0.0001 vs. untreated cells (Ctr).
Figure 5
Figure 5
Analysis of ATP and AMP content in DMSO-R (left panels) and PLX-R (right panels) MeOV (A) and MeTA (B) melanoma cells, exposed to 1.5 µM PLX4032 or to DMSO for 24, 48 and 72 h. Histograms summarize quantitative data of the means ± S.E.M. of four independent experiments. **p<0.01 vs. untreated cells (Ctr); ***p<0.001 vs. untreated cells (Ctr); ****p<0.0001 vs. untreated cells (Ctr).
Figure 6
Figure 6
Analysis of extracellular lactate concentration and lactate dehydrogenase activity (LDH) in DMSO-R (left panels) and PLX4032-R (right panels) MeOV (A) and MeTA (B) exposed to 1.5 µM PLX4032 or DMSO for 24, 48 and 72 h. Results were reported as mM lactate/106 cells for lactate release and as U/mg (lactate μmol/min/mg of total protein) for LDH activity. Histogram summarizes quantitative data of the means ± S.E.M. of four independent experiments. *p<0.1 vs. untreated cells (Ctr); ***p<0.001 vs. untreated cells (Ctr); ****p<0.0001 vs. untreated cells (Ctr).
Figure 7
Figure 7
Evaluation of NAD+/NADH ratio in DMSO-R (left panels) and PLX-R (right panels) Me-OV (A) and MeTA (B) melanoma cells, exposed to 1.5 µM PLX4032 or to DMSO for 24, 48 and 72 h. Histograms summarize quantitative data of the means ± S.E.M. of four independent experiments. *p<0.1 vs. untreated cells (Ctr); **p<0.01 vs. untreated cells (Ctr).
Figure 8
Figure 8
Analysis of PDH activity (left panels) and protein levels (right panels) in DMSO-R and PLX4032-R MeOV (A) and MeTA (B) melanoma cells treated with 1.5 µM PLX4032 or with DMSO for 72 h. Results were expressed as mOD/min/mg protein. Immunoblots shown are representative of three independent experiments. β-Actin is the internal loading control. (C) DCA pre-treatment of DMSO-R cells reduces the cytotoxic effect of PLX4032. Cell viability was determined by MTT assays in MeOV (left panel) and MeTA (right panel) cells pre-treated for 2 h with 25mM or 50 mM DCA and then exposed for additional 70 h to 1.5 μM or 5 μM PLX4032. Histograms summarize quantitative data of the means ± S.E.M. of four independent experiments. **p<0.01 vs. untreated cells (Ctr); ****p<0.0001 vs. untreated cells (Ctr); °°°° p<0.0001 vs. PLX-4032-treated cells.
Figure 9
Figure 9
Analysis of ROS production in DMSO-R (left panels) and PLX4032-R (right panels) MeOV (A) and MeTA (B) melanoma cells, exposed to 1.5 µM PLX4032 or to DMSO for 24, 48 and 72 h. Histograms summarize quantitative data of the means ± S.E.M. of four independent experiments. **p<0.01 vs. untreated cells (Ctr).
Figure 10
Figure 10
Analysis of total GSH levels in DMSO-R and PLX4032-R MeOV (A) and MeTA (B) melanoma cells exposed to 1.5 µM PLX4032 or DMSO for 24, 48 and 72 h. Results were reported as μM/μg protein. (C) NAC pre-treatment of DMSO-R cells reduces the cytotoxic effect of PLX4032. Cell viability was determined by MTT assays in MeOV (left panel) and MeTA (right panel) cells pre-treated for 2 h with 2 μM or 4 μM NAC and then exposed for additional 70 h to 1.5 μM or 5 μM PLX4032. Histograms summarize quantitative data of the means ± S.E.M. of four independent experiments. *p<0.01 vs. untreated cells (Ctr); **p<0.01 vs. untreated cells (Ctr); ****p<0.0001 vs. untreated cells (Ctr); °°°° p<0.0001 vs. PLX-4032-treated cells.
Figure 11
Figure 11
Evaluation of NADPH/NADP+ ratio in DMSO-R (left panels) and PLX-R (right panels) MeOV (A) and MeTA (B) melanoma cells, exposed to 1.5 µM PLX4032 or to DMSO for 24, 48 and 72 h. Histograms summarize quantitative data of the means ± S.E.M. of four independent experiments. **p<0.01 vs. untreated cells (Ctr).
Figure 12
Figure 12
Loading (A) and score (B) plots are shown on the PC1-PC2 plane. (A) The loading plot describes the correlation pattern between the variables, where PC1 explains the cell viability and PC2 explains the cell-type dependent behavior in response to PLX treatment. (B) The score plot displays the objects in the component space, with each sample coded according to the treatment time point (1 = 24 h, 2 = 48 h, 3 = 72 h), colored and connected by a convex hull according to the cell line and the type of resistance (DMSO-R MeOV, PLX-R MeOV, DMSO-R MeTA, PLX-R MeTA).

Similar articles

Cited by

References

    1. Pisani P, Parkin DM, Bray F, Ferlay J. Estimates of the worldwide mortality from 25 cancers in 1990. Int J Cancer (1999) 83:18–29. doi: 10.1002/(sici)1097-0215(19990924)83:1<18::aid-ijc5>3.0.co;2-m - DOI - PubMed
    1. Schadendorf D, Fisher DE, Garbe C, Gershenwald JE, Grob JJ, Halpern A, et al. . Melanoma. Nat Rev Dis Primers (2015) 1:15003. doi: 10.1038/nrdp.2015.3 - DOI - PubMed
    1. Michielin O, van Akkooi ACJ, Ascierto PA, Dummer R, Keilholz U. ESMO guidelines committee. electronic address: clinicalguidelines@esmo.org. cutaneous melanoma: ESMO clinical practice guidelines for diagnosis, treatment and follow-up. Ann Oncol (2019) 30:1884–901. doi: 10.1093/annonc/mdz411 - DOI - PubMed
    1. Erdei E, Torres SM. A new understanding in the epidemiology of melanoma. Expert Rev Anticancer Ther (2010) 10:1811–23. doi: 10.1586/era.10.170 - DOI - PMC - PubMed
    1. Leary M, Heerboth S, Lapinska K, Sarkar S. Sensitization of drug resistant cancer cells: a matter of combination therapy. Cancers (2018) 10:483. doi: 10.3390/cancers10120483 - DOI - PMC - PubMed